Lampasas, TX (Texas) Houses and Residents
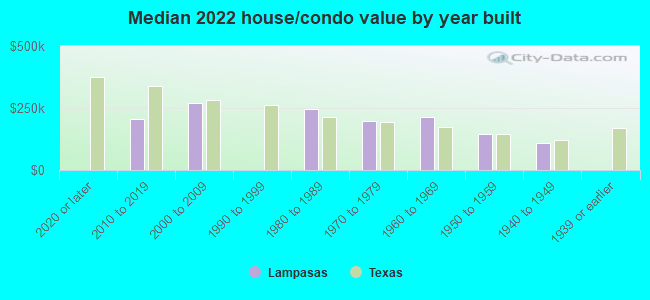
| Lampasas: | $202,269 |
| Texas: | $275,400 |
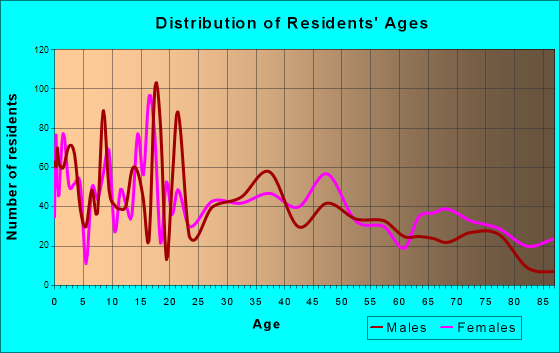
Total population: 7,223 (Urban population: 6,589 (all inside urban clusters), Rural population: 226 (all nonfarm))
Houses: 3,200 (2,676 occupied: 1,714 owner occupied, 1,003 renter occupied)
| % of renters here: | 37% |
| State: | 38% |
Housing density: 517 houses/condos per square mile
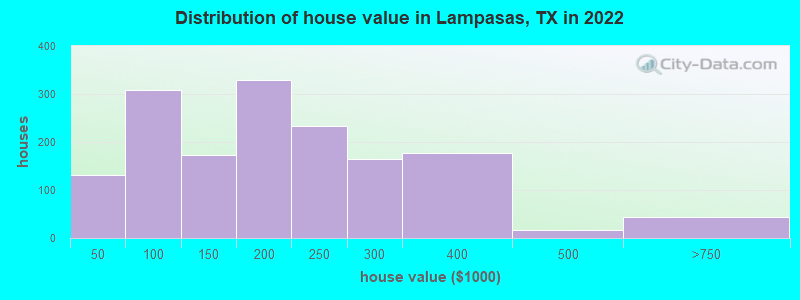
Median price asked for vacant for-sale houses and condos in 2022: $179,243.
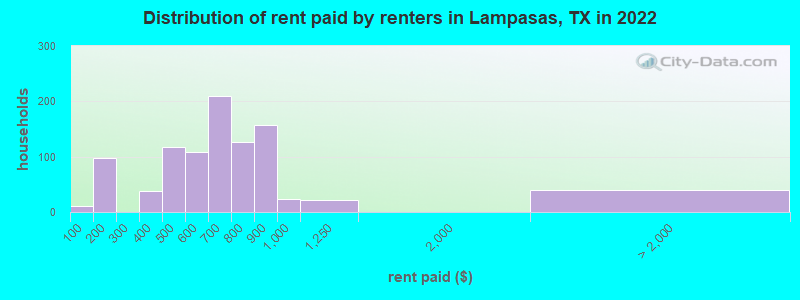
Median contract rent in 2022: $645 (lower quartile is $482, upper quartile is $814)
Median rent asked for vacant for-rent units in 2022: $1,248
Median gross rent in Lampasas, TX in 2022: $857
Housing units in Lampasas with a mortgage: 900 (0 second mortgage, 0 home equity loan, 0 both second mortgage and home equity loan)
Houses without a mortgage: 218
Median household income for houses/condos with a mortgage: $113,534
Median household income for apartments without a mortgage: $58,927
Median monthly housing costs: $911
Compare current foreclosures near Lampasas, TX:
| Photo | Address | Area | Beds / Baths | Price | Details |
|---|---|---|---|---|---|

|
#1
E 7th St
Lampasas, TX 76550
|
1,503 sq. feet
|
2 baths 3 beds |
show details | |

|
#2
W Ave A
Lampasas, TX 76550
|
- sq. feet
|
3 baths 4 beds |
show details | |

|
#3
Taylor St
Lampasas, TX 76550
|
- sq. feet
|
2 baths 3 beds |
show details | |

|
#4
E Highway 190
Lampasas, TX 76550
|
2,400 sq. feet
|
- baths - beds |
show details | |

|
#5
728 County Rd
Lampasas, TX 76550
|
- sq. feet
|
- baths - beds |
show details | |

|
#6
Naruna Rd
Lampasas, TX 76550
|
- sq. feet
|
- baths - beds |
show details | |

|
#7
County Road 2026
Lampasas, TX 76550
|
- sq. feet
|
- baths - beds |
show details | |

|
#8
Casbeer St
Lampasas, TX 76550
|
- sq. feet
|
- baths - beds |
show details | |

|
#9
N Fairview St
Lampasas, TX 76550
|
- sq. feet
|
- baths - beds |
show details | |

|
#10
Jacob St
Copperas Cove, TX 76522
|
2,042 sq. feet
|
2 baths 4 beds |
show details |
| Photo | Address | Area | Beds / Baths | Price | Details |
|---|---|---|---|---|---|

|
#11
Cheyenne St
Copperas Cove, TX 76522
|
2,629 sq. feet
|
2 baths 4 beds |
show details | |

|
#12
Halter Dr
Copperas Cove, TX 76522
|
1,166 sq. feet
|
2 baths 3 beds |
show details | |

|
#13
Laurie Ln
Copperas Cove, TX 76522
|
1,480 sq. feet
|
2 baths - beds |
show details | |

|
#14
Shiela Ct
Copperas Cove, TX 76522
|
1,766 sq. feet
|
2 baths - beds |
show details | |

|
#15
Merle Dr
Copperas Cove, TX 76522
|
1,832 sq. feet
|
2 baths - beds |
show details | |

|
#16
Meggs Blvd
Copperas Cove, TX 76522
|
1,416 sq. feet
|
1 baths - beds |
show details | |

|
#17
Scott Dr
Copperas Cove, TX 76522
|
2,064 sq. feet
|
2 baths - beds |
show details | |

|
#18
Katelyn Cir
Copperas Cove, TX 76522
|
1,565 sq. feet
|
2 baths - beds |
show details | |

|
#19
Indian Camp Trl
Copperas Cove, TX 76522
|
1,708 sq. feet
|
2 baths - beds |
show details | |

|
#20
Dixon Cir
Copperas Cove, TX 76522
|
1,580 sq. feet
|
2 baths - beds |
show details |
| Photo | Address | Area | Beds / Baths | Price | Details |
|---|---|---|---|---|---|

|
#21
Laurie Ln
Copperas Cove, TX 76522
|
- sq. feet
|
- baths - beds |
show details | |

|
#22
W Ave E, # B
Copperas Cove, TX 76522
|
- sq. feet
|
- baths - beds |
show details | |

|
#23
County Road 4765
Kempner, TX 76539
|
2,474 sq. feet
|
- baths - beds |
show details | |

|
#24
Sunflower Trl
Copperas Cove, TX 76522
|
- sq. feet
|
- baths - beds |
show details | |

|
#25
Marissa Dr
Copperas Cove, TX 76522
|
- sq. feet
|
- baths - beds |
show details | |

|
#26
County Road 3270
Kempner, TX 76539
|
- sq. feet
|
- baths - beds |
show details | |

|
#27
Coy Dr
Copperas Cove, TX 76522
|
- sq. feet
|
- baths - beds |
show details | |

|
#28
Apache St
Kempner, TX 76539
|
- sq. feet
|
- baths - beds |
show details | |

|
#29
County Road 3372
Kempner, TX 76539
|
- sq. feet
|
- baths - beds |
show details | |

|
#30
County Road 3351
Kempner, TX 76539
|
- sq. feet
|
- baths - beds |
show details |
| Photo | Address | Area | Beds / Baths | Price | Details |
|---|---|---|---|---|---|

|
#31
Fm 580 E
Kempner, TX 76539
|
- sq. feet
|
- baths - beds |
show details | |

|
#32
Mulberry Dr
Kempner, TX 76539
|
- sq. feet
|
- baths - beds |
show details | |

|
Check over 1 million property listings on Foreclosure.com!
|
browse all offers | |||

Latest news about housing in Lampasas, TX collected exclusively by city-data.com from local newspapers, TV, and radio stations


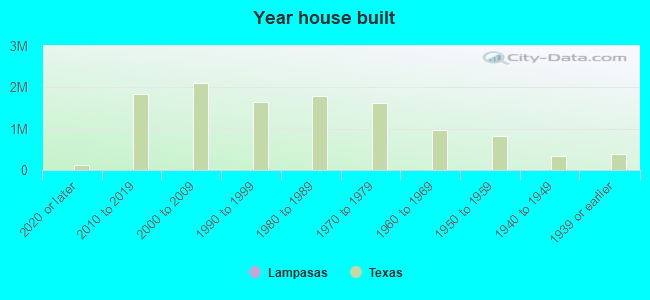
Median year apartment built: 1979
Household type by relationship:
Households: 7,575- Male householders: 1,229 (235 living alone), Female householders: 1,410 (461 living alone)
1,241 spouses (1,223 opposite-sex spouses), 186 unmarried partners, (186 opposite-sex unmarried partners), 2,210 children (2,007 natural, 29 adopted, 173 stepchildren), 357 grandchildren, 235 brothers or sisters, 44 parents, 0 foster children, 326 other relatives, 99 non-relatives
- In group quarters: 233
Size of family households: 693 2-persons, 530 3-persons, 261 4-persons, 269 5-persons, 44 6-persons, 82 7-or-more-persons.
Size of nonfamily households: 733 1-person, 103 2-persons.
1,042 married couples with children.
411 single-parent households (137 men, 274 women).
86.3% of residents of Lampasas speak English at home.
11.4% of residents speak Spanish at home (68% speak English very well, 25% speak English well, 3% speak English not well, 3% don't speak English at all).
1.9% of residents speak other Indo-European language at home (100% speak English very well).
0.8% of residents speak Asian or Pacific Island language at home (35% speak English well, 65% speak English not well).
Foreign born population: 413 (5.5%)
(41.2% of them are naturalized citizens)
| Here: | 6.2 |
| State: | 6.3 |
| Here: | 4.3 |
| State: | 4.0 |
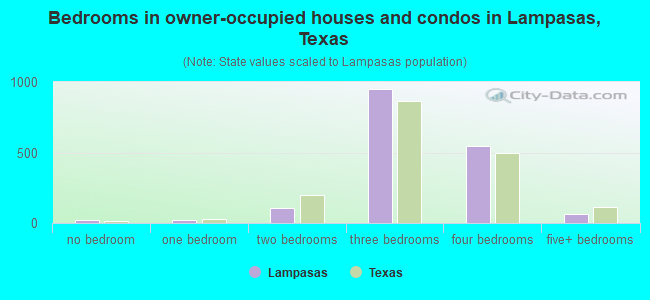
- Bedrooms in owner-occupied houses and condos in Lampasas, Texas
- 24no bedroom
- 241 bedroom
- 1062 bedrooms
- 9503 bedrooms
- 5494 bedrooms
- 615+ bedrooms
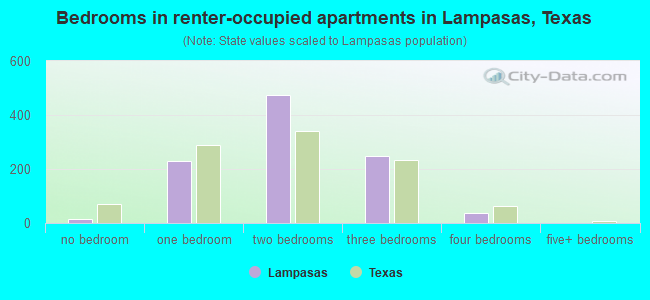
- Bedrooms in renter-occupied apartments in Lampasas, Texas
- 15no bedroom
- 2291 bedroom
- 4752 bedrooms
- 2473 bedrooms
- 374 bedrooms
- 05+ bedrooms
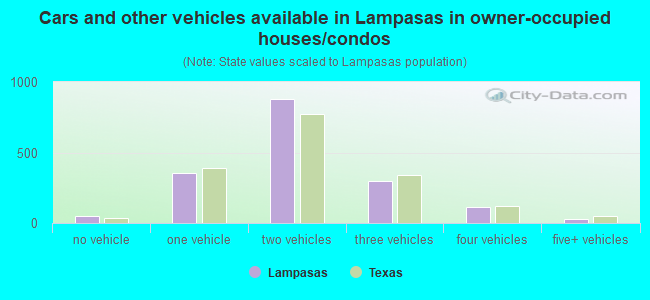
- Cars and other vehicles available in Lampasas in owner-occupied houses/condos
- 49no vehicle
- 3531 vehicle
- 8772 vehicles
- 2983 vehicles
- 1124 vehicles
- 255+ vehicles
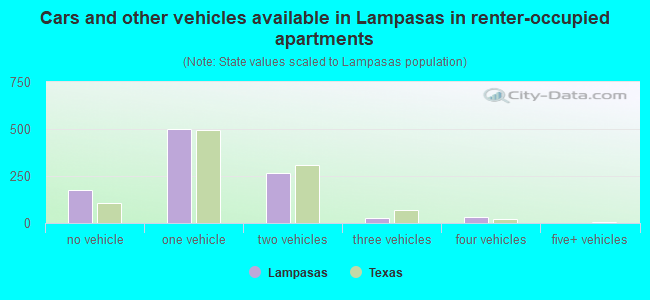
- Cars and other vehicles available in Lampasas in renter-occupied apartments
- 174no vehicle
- 5021 vehicle
- 2652 vehicles
- 293 vehicles
- 334 vehicles
- 05+ vehicles
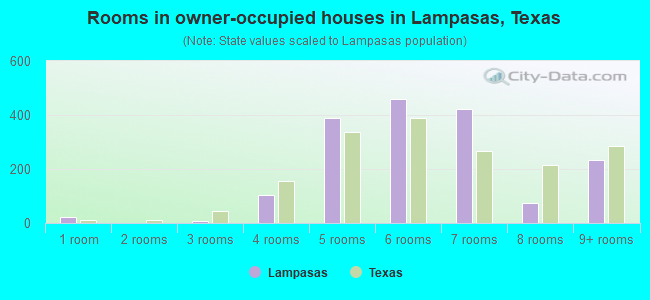
- Rooms in owner-occupied houses in Lampasas, Texas
- 241 room
- 02 rooms
- 73 rooms
- 1044 rooms
- 3885 rooms
- 4596 rooms
- 4237 rooms
- 758 rooms
- 2359+ rooms
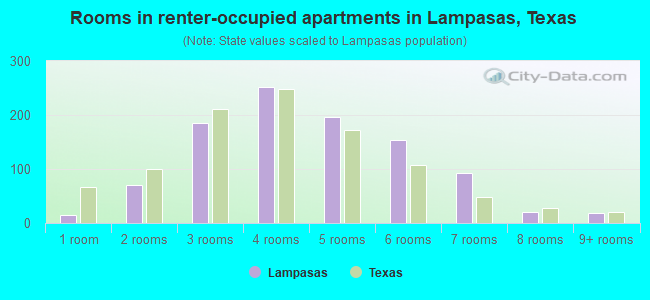
- Rooms in renter-occupied apartments in Lampasas, Texas
- 141 room
- 702 rooms
- 1863 rooms
- 2524 rooms
- 1965 rooms
- 1546 rooms
- 927 rooms
- 218 rooms
- 199+ rooms
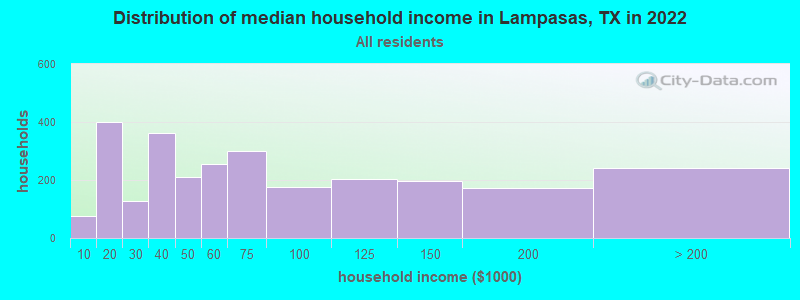
Lampasas, TX household income distribution

- 75Less than $10,000
- 401$10,000 to $19,999
- 129$20,000 to $29,999
- 361$30,000 to $39,999
- 210$40,000 to $49,999
- 255$50,000 to $59,999
- 299$60,000 to $74,999
- 177$75,000 to $99,999
- 202$100,000 to $124,999
- 197$125,000 to $149,999
- 173$150,000 to $199,999
- 243$200,000 or more
Home value of owner - occupied houses in 2022 in Lampasas, TX
-
- 74Less than $10,000
- 7$15,000 to $19,999
- 13$20,000 to $24,999
- 9$30,000 to $34,999
- 26$40,000 to $49,999
- 42$50,000 to $59,999
- 70$60,000 to $69,999
- 82$70,000 to $79,999
- 56$80,000 to $89,999
- 28$90,000 to $99,999
- 96$100,000 to $124,999
- 77$125,000 to $149,999
- 138$150,000 to $174,999
- 190$175,000 to $199,999
- 234$200,000 to $249,999
- 164$250,000 to $299,999
- 177$300,000 to $399,999
- 16$400,000 to $499,999
- 42$500,000 to $749,999
Rent paid by renters in 2022 in Lampasas, TX
-
- 11Less than $100
- 20$100 to $149
- 77$150 to $199
- 18$300 to $349
- 20$350 to $399
- 26$400 to $449
- 91$450 to $499
- 71$500 to $549
- 37$550 to $599
- 140$600 to $649
- 68$650 to $699
- 78$700 to $749
- 47$750 to $799
- 157$800 to $899
- 23$900 to $999
- 21$1,000 to $1,249
- 22$2,000 to $2,499
- 17No cash rent
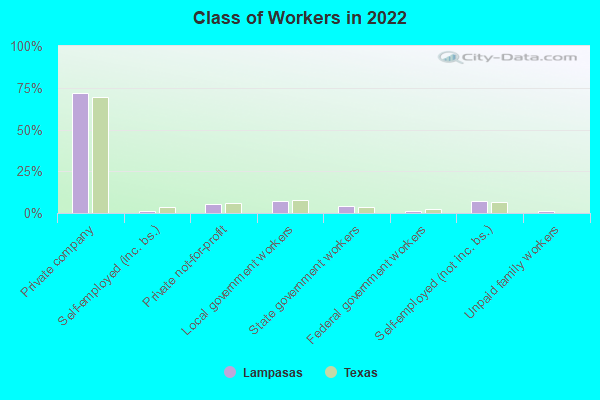
Percentage of workers working in this county: 73.0%
Number of people working at home: 217 (6.6% of all workers)
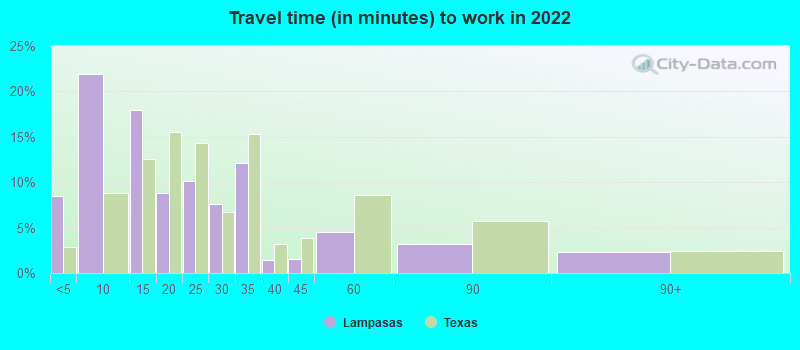
Travel time to work (commute)
- Less than 5 minutes: 255
- 5 to 9 minutes: 817
- 10 to 14 minutes: 395
- 15 to 19 minutes: 208
- 20 to 24 minutes: 77
- 25 to 29 minutes: 98
- 30 to 34 minutes: 446
- 35 to 39 minutes: 89
- 40 to 44 minutes: 54
- 45 to 59 minutes: 233
- 60 to 89 minutes: 155
- 90 or more minutes: 196
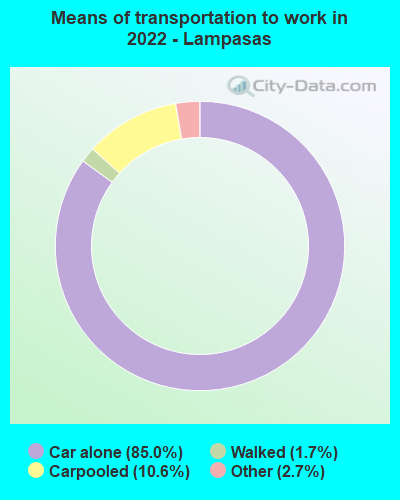
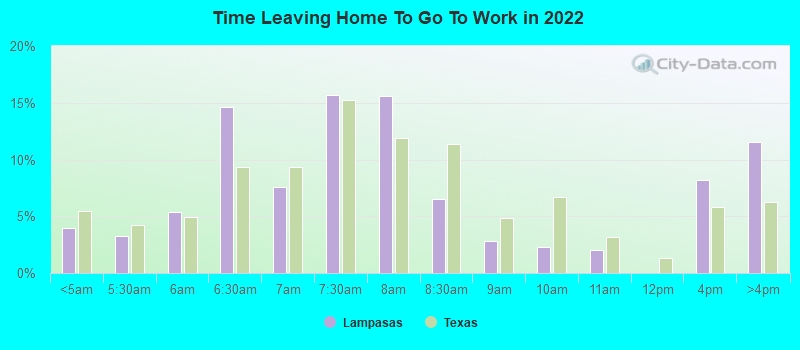
Means of transportation to work:
- Drove a car alone: 3,328 (77.5%)
- Carpooled: 452 (10.5%)
- Taxi: 129 (3.0%)
- Walked: 71 (1.7%)
- Worked at home: 217 (5.1%)
- Unemployment by race in 2022
- Unemployment rate for White non-Hispanic residents
- 0.6%Males
- 6.3%Females
- Unemployment rate for Hispanic or Latino residents
- 4.3%Females
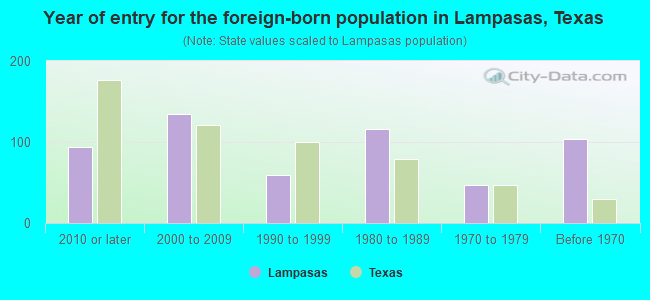
- Year of entry for the foreign-born population in Lampasas, Texas
- 942010 or later
- 1342000 to 2009
- 591990 to 1999
- 1161980 to 1989
- 471970 to 1979
- 104Before 1970
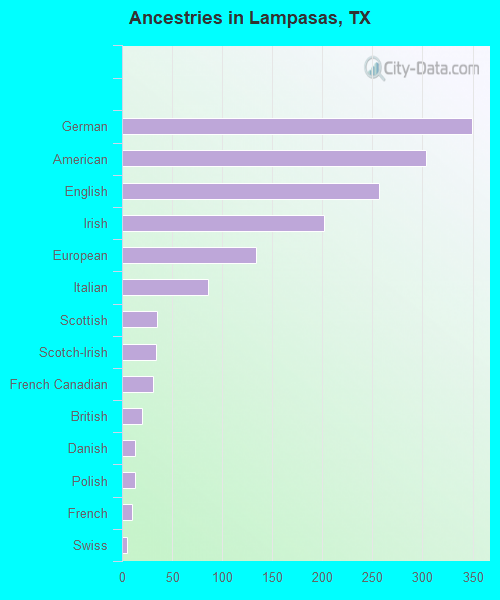
First ancestries reported:
- German: 349 (10.6%)
- American: 304 (9.3%)
- English: 257 (7.8%)
- Irish: 202 (6.2%)
- European: 134 (4.1%)
- Italian: 86 (2.6%)
- Scottish: 35 (1.1%)
- Scotch-Irish: 34 (1.0%)
- French Canadian: 31 (0.9%)
- British: 20 (0.6%)
- Danish: 13 (0.4%)
- Polish: 13 (0.4%)
- French: 10 (0.3%)
- Swiss: 5 (0.2%)
- Norwegian: 3 (0.09%)
- Scandinavian: 2 (0.06%)
Most common places of birth for foreign-born residents (%):
| Lampasas: | 48.4% (200) |
| Texas: | 48.4% (2,411,723) |
| Lampasas: | 9.0% (37) |
| Texas: | 2.1% (103,148) |
| Lampasas: | 8.0% (33) |
| Texas: | 0.8% (37,989) |
| Lampasas: | 7.5% (31) |
| Texas: | 0.1% (4,295) |
| Lampasas: | 6.8% (28) |
| Texas: | 6.1% (306,347) |
| Lampasas: | 5.6% (23) |
| Texas: | 0.3% (15,368) |
| Lampasas: | 3.9% (16) |
| Texas: | 0.2% (7,705) |
| Lampasas: | 3.1% (13) |
| Texas: | 2.3% (115,558) |
| Lampasas: | 1.7% (7) |
| Texas: | 1.8% (87,382) |
| Lampasas: | 1.7% (7) |
| Texas: | 3.0% (147,182) |
Place of birth for U.S.-born residents:
- This state: 5,047
- Other state: 1,956
- Northeast: 169
- Midwest: 294
- South: 777
- West: 724
92.5% of Lampasas residents lived in the same house 1 years ago.
Out of people who lived in different houses, 25.3% lived in this county.
Out of people who lived in different counties, 46.6% lived in Texas.
| Lampasas: | 92.5% |
| State average: | 85.7% |
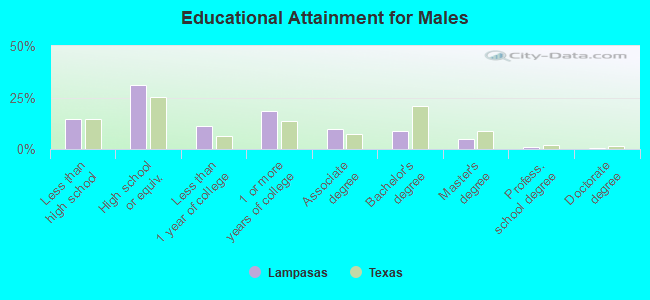
Education attainment for males 25 years and older:
- No schooling: 164
- Nursery to 4th grade: 69
- 5th and 6th grade: 57
- 7th and 8th grade: 5
- 9th grade: 0
- 10th grade: 15
- 11th grade: 11
- 12th grade, no diploma: 20
- High school graduate (or equivalency): 730
- Less than 1 year of college: 257
- Some college more than 1 year, no degree: 427
- Associate degree: 232
- Bachelor's degree: 207
- Master's degree: 116
- Professional school degree: 21
- Doctorate degree: 6
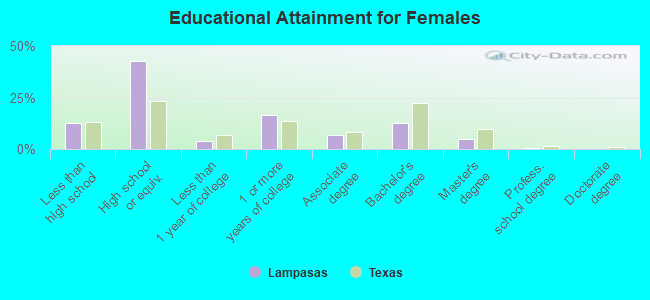
Education attainment for females 25 years and older:
- No schooling: 49
- Nursery to 4th grade: 3
- 5th and 6th grade: 21
- 7th and 8th grade: 10
- 9th grade: 5
- 10th grade: 72
- 11th grade: 81
- 12th grade, no diploma: 98
- High school graduate (or equivalency): 1,142
- Less than 1 year of college: 107
- Some college more than 1 year, no degree: 440
- Associate degree: 182
- Bachelor's degree: 334
- Master's degree: 132
- Professional school degree: 9
- Doctorate degree: 0
Housing units in structures:
- One, detached: 2,408
- One, attached: 22
- Two: 251
- 3 or 4: 172
- 5 to 9: 226
- 10 to 19: 7
- 20 to 49: 59
- 50 or more: 43
- Boats, RVs, vans, etc.: 7
Housing units lacking complete kitchen facilities in 2022: 9.0%
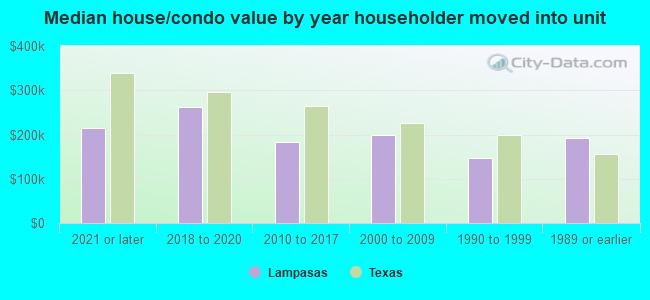
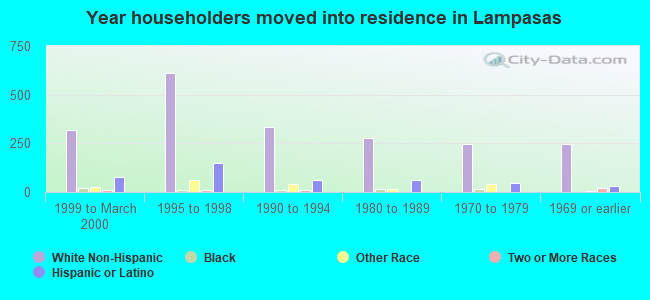
House/condo owner moved in on average 10 years ago
Renter moved in on average 4 years ago
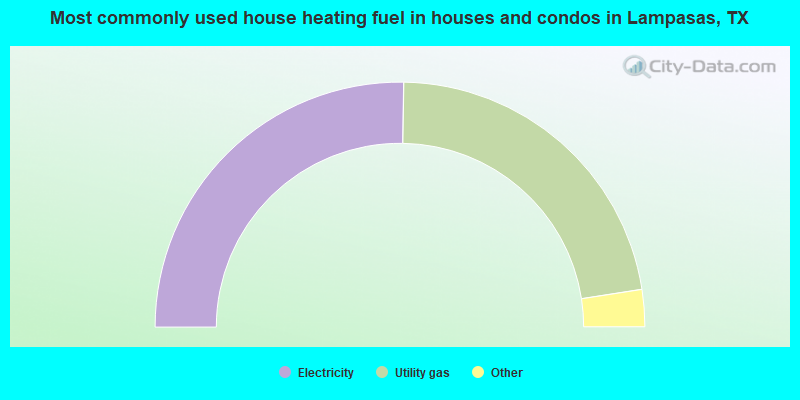
- 50.5%Electricity
- 44.6%Utility gas
- 2.5%Fuel oil, kerosene, etc.
- 1.7%Bottled, tank, or LP gas
- 0.7%Wood
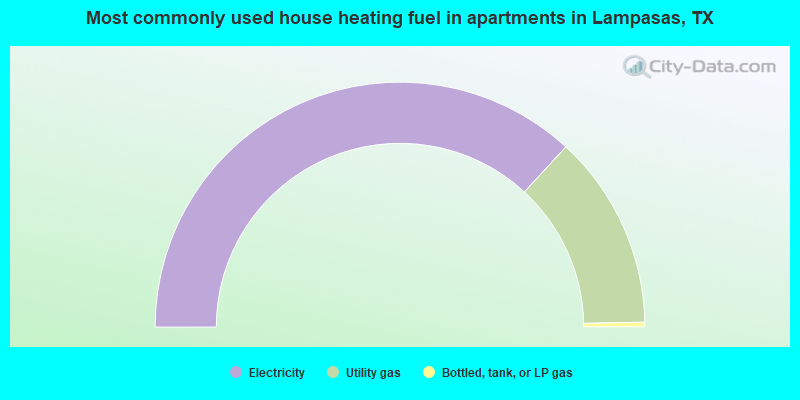
- 73.7%Electricity
- 25.7%Utility gas
- 0.6%Bottled, tank, or LP gas
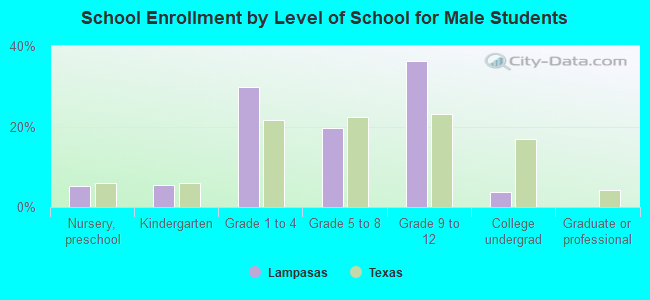
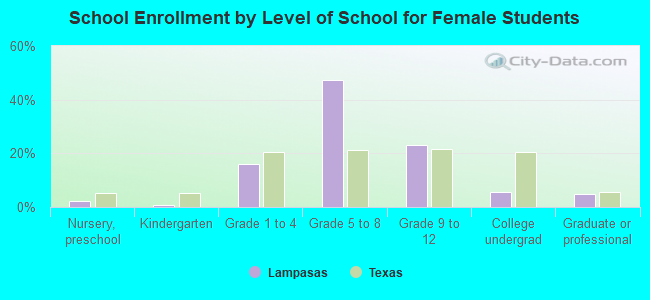
Private vs. public school enrollment:
| Here: | 1.9% |
| Texas: | 8.8% |
| Here: | 5.9% |
| Texas: | 8.0% |
| Here: | 0.0% |
| Texas: | 16.2% |