Lakewood, OH (Ohio) Houses and Residents
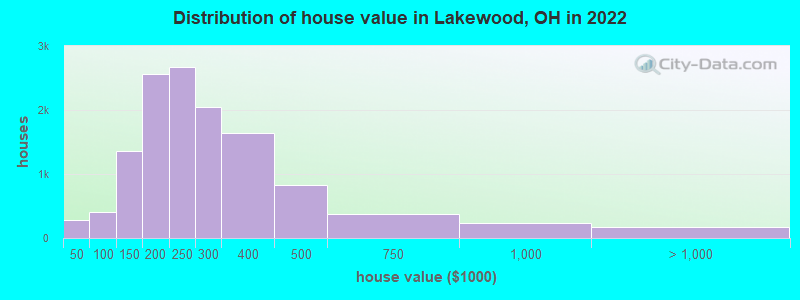
Estimated median house or condo value in 2022: $244,298 (it was $117,600 in 2000 )
Lakewood:
$244,298Ohio:
$204,100
Lower value quartile - upper value quartile: $182,932 - $318,436Mean price in 2022: Detached houses: $309,763 Here:
$309,763State:
$254,366
Townhouses or other attached units: $352,617 Here:
$352,617State:
$225,733
In 2-unit structures: $200,431 Here:
$200,431State:
$144,384
In 3-to-4-unit structures: $349,410 Here:
$349,410State:
$203,002
In 5-or-more-unit structures: $199,741 Here:
$199,741State:
$211,593
Total population: 50,926 (All urban)
Houses: 28,700 (26,409 occupied: 11,636 owner occupied, 14,927 renter occupied )
% of renters here:
56%State:
33%
Housing density: 5,172 houses/condos per square mile
Median price asked for vacant for-sale houses and condos in 2022: $104,334.
Median contract rent in 2022: $841 (lower quartile is $696, upper quartile is $1,094)
Median rent asked for vacant for-rent units in 2022: $1,314
Median gross rent in Lakewood, OH in 2022: $964
Housing units in Lakewood with a mortgage: 7,973 (1,055 second mortgage, 38 home equity loan, 910 both second mortgage and home equity loan )Houses without a mortgage: 644
Median household income for houses/condos with a mortgage: $115,135
Median household income for apartments without a mortgage: $67,033
Median monthly housing costs: $1,078
Data:
Median house or condo value ($)
Median house or condo value ($ change since 2000)
Median house or condo value ($) - White
Median house or condo value ($) - Black or African American
Median house or condo value ($) - Asian
Median house or condo value ($) - Hispanic or Latino
Median house or condo value ($) - American Indian and Alaska Native
Median house or condo value ($) - Multirace
Median house or condo value ($) - Other Race
Median price asked for mobile homes ($)
Household density (households per square mile)
Mean house or condo value by units in structure - 1, detached ($)
Mean house or condo value by units in structure - 1, attached ($)
Mean house or condo value by units in structure - 2 ($)
Mean house or condo value by units in structure by units in structure - 3 or 4 ($)
Mean house or condo value by units in structure - 5 or more ($)
Mean house or condo value by units in structure - Boat, RV, van, etc. ($)
Mean house or condo value by units in structure - Mobile home ($)
Median contract rent ($)
Median contract rent - Lower quartile ($)
Median contract rent - Upper quartile ($)
Median gross rent ($)
Urban houses (%)
Rural houses (%)
Houses occupied (%)
Houses occupied (% change since 2000)
Houses owner occupied (%)
Houses owner occupied (% change since 2000)
Houses renter occupied (%)
Houses renter occupied (% change since 2000)
Vacant housing units - For rent (%)
Vacant housing units - For rent (% change since 2000)
Vacant housing units - For sale only (%)
Vacant housing units - For sale only (% change since 2000)
Vacant housing units - Rented or sold, not occupied (%)
Vacant housing units - Rented or sold, not occupied (% change since 2000)
Vacant housing units - For seasonal, recreational, or occasional use (%)
Vacant housing units - For seasonal, recreational, or occasional use (% change since 2000)
Vacant housing units - For migrant workers (%)
Vacant housing units - For migrant workers (% change since 2000)
Vacant housing units - Other vacant (%)
Vacant housing units - Other vacant (% change since 2000)
Median monthly housing costs ($)
Median household income for houses/condos with a mortgage ($)
Median household income for houses/condos without a mortgage ($)
Median household income ($)
Median household income ($) - White
Median household income ($) - Black or African American
Median household income ($) - Asian
Median household income ($) - Hispanic or Latino
Median household income ($) - American Indian and Alaska Native
Median household income ($) - Multirace
Median household income ($) - Other Race
Mortgage status - with mortgage (%)
Mortgage status - with second mortgage (%)
Mortgage status - with home equity loan (%)
Mortgage status - with both second mortgage and home equity loan (%)
Mortgage status - without a mortgage (%)
Median year house/condo built
Median year apartment built
Household type by relationship - Male householder living alone (%)
Household type by relationship - Male householder not living alone (%)
Household type by relationship - Female householder living alone (%)
Household type by relationship - Female householder not living alone (%)
Household type by relationship - Opposite-Sex spouse (%)
Household type by relationship - Same-Sex spouse (%)
Household type by relationship - Opposite-Sex unmarried partner (%)
Household type by relationship - Same-Sex unmarried partner (%)
Household type by relationship - In group quarters (%)
Size of family households - 2-person household (%)
Size of family households - 3-person household (%)
Size of family households - 4-person household (%)
Size of family households - 5-person household (%)
Size of family households - 6-person household (%)
Size of family households - 7-or-more-person household (%)
Size of nonfamily households - 1-person household (%)
Size of nonfamily households - 2-person household (%)
Size of nonfamily households - 3-person household (%)
Size of nonfamily households - 4-person household (%)
Size of nonfamily households - 5-person household (%)
Size of nonfamily households - 6-person household (%)
Size of nonfamily households - 7-or-moreperson household (%)
Year house built - Built 2010 or later (%)
Year house built - Built 2000 to 2009 (%)
Year house built - Built 1990 to 1999 (%)
Year house built - Built 1980 to 1989 (%)
Year house built - Built 1970 to 1979 (%)
Year house built - Built 1960 to 1969 (%)
Year house built - Built 1950 to 1959 (%)
Year house built - Built 1940 to 1949 (%)
Year house built - Built 1939 or earlier (%)
Median number of rooms in houses and condos
Median number of rooms in apartments
Median number of bedrooms in owner occupied houses
Mean number of bedrooms in owner occupied houses
Median number of bedrooms in renter occupied houses
Mean number of bedrooms in renter occupied houses
Median number of vehichles in owner occupied houses
Mean number of vehichles in owner occupied houses
Median number of vehichles in renter occupied houses
Mean number of vehichles in renter occupied houses
Rooms in owner-occupied houses - 1 room (%)
Rooms in owner-occupied houses - 2 rooms (%)
Rooms in owner-occupied houses - 3 rooms (%)
Rooms in owner-occupied houses - 4 rooms (%)
Rooms in owner-occupied houses - 5 rooms (%)
Rooms in owner-occupied houses - 6 rooms (%)
Rooms in owner-occupied houses - 7 rooms (%)
Rooms in owner-occupied houses - 8 rooms (%)
Rooms in owner-occupied houses - 9+ rooms (%)
Rooms in renter-occupied houses - 1 room (%)
Rooms in renter-occupied houses - 2 rooms (%)
Rooms in renter-occupied houses - 3 rooms (%)
Rooms in renter-occupied houses - 4 rooms (%)
Rooms in renter-occupied houses - 5 rooms (%)
Rooms in renter-occupied houses - 6 rooms (%)
Rooms in renter-occupied houses - 7 rooms (%)
Rooms in renter-occupied houses - 8 rooms (%)
Rooms in renter-occupied houses - 9+ rooms (%)
Bedrooms in owner-occupied houses - no bedrooms (%)
Bedrooms in owner-occupied houses - 1 bedroom (%)
Bedrooms in owner-occupied houses - 2 bedrooms (%)
Bedrooms in owner-occupied houses - 3 bedrooms (%)
Bedrooms in owner-occupied houses - 4 bedrooms (%)
Bedrooms in owner-occupied houses - 5+ bedrooms (%)
Bedrooms in renter-occupied houses - no bedrooms (%)
Bedrooms in renter-occupied houses - 1 bedroom (%)
Bedrooms in renter-occupied houses - 2 bedrooms (%)
Bedrooms in renter-occupied houses - 3 bedrooms (%)
Bedrooms in renter-occupied houses - 4 bedrooms (%)
Bedrooms in renter-occupied houses - 5+ bedrooms (%)
Vehicles available in owner-occupied houses - no vehicle available (%)
Vehicles available in owner-occupied houses - 1 vehicle available(%)
Vehicles available in owner-occupied houses - 2 Vehicles available (%)
Vehicles available in owner-occupied houses - 3 Vehicles available (%)
Vehicles available in owner-occupied houses - 4 Vehicles available (%)
Vehicles available in owner-occupied houses - 5+ Vehicles available (%)
Vehicles available in renter-occupied houses - no vehicle available (%)
Vehicles available in renter-occupied houses - 1 vehicle available (%)
Vehicles available in renter-occupied houses - 2 Vehicles available (%)
Vehicles available in renter-occupied houses - 3 Vehicles available (%)
Vehicles available in renter-occupied houses - 4 Vehicles available (%)
Vehicles available in renter-occupied houses - 5+ Vehicles available (%)
Housing units in structures - 1, detached (%)
Housing units in structures - 1, attached (%)
Housing units in structures - 2 (%)
Housing units in structures - 3 or 4 (%)
Housing units in structures - 5 to 9 (%)
Housing units in structures - 10 to 19 (%)
Housing units in structures - 20 to 49 (%)
Housing units in structures - 50 or more (%)
Housing units in structures - Mobile home (%)
Housing units in structures - Boat, RV, van, etc. (%)
Housing units in structures - Owners - 1, detached (%)
Housing units in structures - Owners - 1, attached (%)
Housing units in structures - Owners - 2 (%)
Housing units in structures - Owners - 3 or 4 (%)
Housing units in structures - Owners - 5 to 9 (%)
Housing units in structures - Owners - 10 to 19 (%)
Housing units in structures - Owners - 20 to 49 (%)
Housing units in structures - Owners - 50 or more (%)
Housing units in structures - Owners - Mobile home (%)
Housing units in structures - Owners - Boat, RV, van, etc. (%)
Housing units in structures - Renters - 1, detached (%)
Housing units in structures - Renters - 1, attached (%)
Housing units in structures - Renters - 2 (%)
Housing units in structures - Renters - 3 or 4 (%)
Housing units in structures - Renters - 5 to 9 (%)
Housing units in structures - Renters - 10 to 19 (%)
Housing units in structures - Renters - 20 to 49 (%)
Housing units in structures - Renters - 50 or more (%)
Housing units in structures - Renters - Mobile home (%)
Housing units in structures - Renters - Boat, RV, van, etc. (%)
House/condo owner moved in on average (years ago)
Renter moved in on average (years ago)
Year householder moved into unit - Moved in 1999 to March 2000 (%)
Year householder moved into unit - Moved in 1999 to March 2000 (%) - White
Year householder moved into unit - Moved in 1999 to March 2000 (%) - Black or African American
Year householder moved into unit - Moved in 1999 to March 2000 (%) - Asian
Year householder moved into unit - Moved in 1999 to March 2000 (%) - Hispanic or Latino
Year householder moved into unit - Moved in 1999 to March 2000 (%) - American Indian and Alaska Native
Year householder moved into unit - Moved in 1999 to March 2000 (%) - Multirace
Year householder moved into unit - Moved in 1999 to March 2000 (%) - Other Race
Year householder moved into unit - Moved in 1995 to 1998 (%)
Year householder moved into unit - Moved in 1995 to 1998 (%) - White
Year householder moved into unit - Moved in 1995 to 1998 (%) - Black or African American
Year householder moved into unit - Moved in 1995 to 1998 (%) - Asian
Year householder moved into unit - Moved in 1995 to 1998 (%) - Hispanic or Latino
Year householder moved into unit - Moved in 1995 to 1998 (%) - American Indian and Alaska Native
Year householder moved into unit - Moved in 1995 to 1998 (%) - Multirace
Year householder moved into unit - Moved in 1995 to 1998 (%) - Other Race
Year householder moved into unit - Moved in 1990 to 1994 (%)
Year householder moved into unit - Moved in 1990 to 1994 (%) - White
Year householder moved into unit - Moved in 1990 to 1994 (%) - Black or African American
Year householder moved into unit - Moved in 1990 to 1994 (%) - Asian
Year householder moved into unit - Moved in 1990 to 1994 (%) - Hispanic or Latino
Year householder moved into unit - Moved in 1990 to 1994 (%) - American Indian and Alaska Native
Year householder moved into unit - Moved in 1990 to 1994 (%) - Multirace
Year householder moved into unit - Moved in 1990 to 1994 (%) - Other Race
Year householder moved into unit - Moved in 1980 to 1989 (%)
Year householder moved into unit - Moved in 1980 to 1989 (%) - White
Year householder moved into unit - Moved in 1980 to 1989 (%) - Black or African American
Year householder moved into unit - Moved in 1980 to 1989 (%) - Asian
Year householder moved into unit - Moved in 1980 to 1989 (%) - Hispanic or Latino
Year householder moved into unit - Moved in 1980 to 1989 (%) - American Indian and Alaska Native
Year householder moved into unit - Moved in 1980 to 1989 (%) - Multirace
Year householder moved into unit - Moved in 1980 to 1989 (%) - Other Race
Year householder moved into unit - Moved in 1970 to 1979 (%)
Year householder moved into unit - Moved in 1970 to 1979 (%) - White
Year householder moved into unit - Moved in 1970 to 1979 (%) - Black or African American
Year householder moved into unit - Moved in 1970 to 1979 (%) - Asian
Year householder moved into unit - Moved in 1970 to 1979 (%) - Hispanic or Latino
Year householder moved into unit - Moved in 1970 to 1979 (%) - American Indian and Alaska Native
Year householder moved into unit - Moved in 1970 to 1979 (%) - Multirace
Year householder moved into unit - Moved in 1970 to 1979 (%) - Other Race
Year householder moved into unit - Moved in 1969 or earlier (%)
Year householder moved into unit - Moved in 1969 or earlier (%) - White
Year householder moved into unit - Moved in 1969 or earlier (%) - Black or African American
Year householder moved into unit - Moved in 1969 or earlier (%) - Asian
Year householder moved into unit - Moved in 1969 or earlier (%) - Hispanic or Latino
Year householder moved into unit - Moved in 1969 or earlier (%) - American Indian and Alaska Native
Year householder moved into unit - Moved in 1969 or earlier (%) - Multirace
Year householder moved into unit - Moved in 1969 or earlier (%) - Other Race
Housing units lacking complete plumbing facilities (%)
Housing units lacking complete kitchen facilities (%)
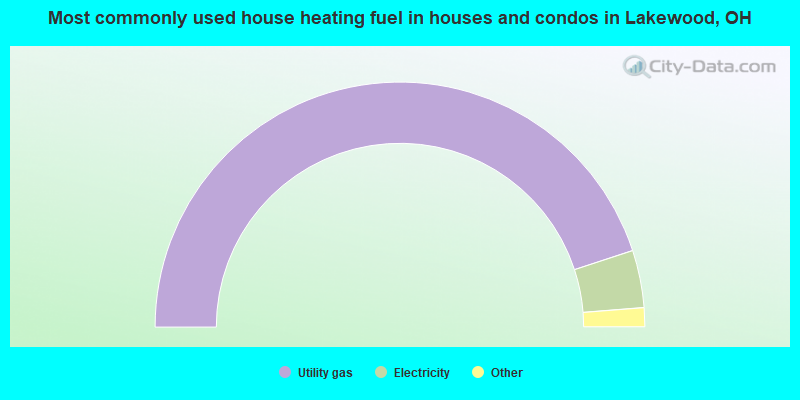
House heating fuel used in houses and condos - Utility gas (%)
House heating fuel used in houses and condos - Bottled, tank, or LP gas (%)
House heating fuel used in houses and condos - Electricity (%)
House heating fuel used in houses and condos - Fuel oil, kerosene, etc. (%)
House heating fuel used in houses and condos - Coal or coke (%)
House heating fuel used in houses and condos - Wood (%)
House heating fuel used in houses and condos - Solar energy (%)
House heating fuel used in houses and condos - Other fuel (%)
House heating fuel used in houses and condos - No fuel used (%)
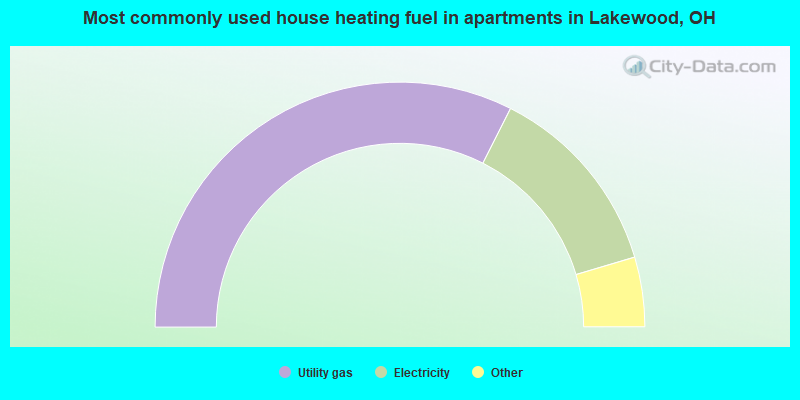
House heating fuel used in apartments - Utility gas (%)
House heating fuel used in apartments - Bottled, tank, or LP gas (%)
House heating fuel used in apartments - Electricity (%)
House heating fuel used in apartments - Fuel oil, kerosene, etc. (%)
House heating fuel used in apartments - Coal or coke (%)
House heating fuel used in apartments - Wood (%)
House heating fuel used in apartments - Solar energy (%)
House heating fuel used in apartments - Other fuel (%)
House heating fuel used in apartments - No fuel used (%)
Latest news about housing in Lakewood, OH collected exclusively by city-data.com from local newspapers, TV, and radio stations
Median year house/condo built: 1938Median year apartment built: 1948Household type by relationship:
Households: 49,776
Male householders: 12,690 (5,793 living alone ), Female householders: 13,318 (6,847 living alone )7,086 spouses (6,798 opposite-sex spouses ), 2,599 unmarried partners , (2,321 opposite-sex unmarried partners ), 9,866 children (9,330 natural , 172 adopted , 363 stepchildren ), 522 grandchildren , 396 brothers or sisters , 285 parents , 0 foster children , 282 other relatives , 2,383 non-relatives In group quarters: 345
Size of family households: 5,109 2-persons , 2,439 3-persons , 1,563 4-persons , 683 5-persons , 159 6-persons , 83 7-or-more-persons .
Size of nonfamily households: 12,730 1-person , 3,399 2-persons , 273 3-persons , 55 4-persons , 41 5-persons .
5,057 married couples with children. single-parent households (598 men , 1,156 women ).
89.9% of residents of Lakewood speak English at home. of residents speak Spanish at home (84% speak English very well , 14% speak English well , 3% speak English not well ).of residents speak other Indo-European language at home (69% speak English very well , 19% speak English well , 9% speak English not well , 3% don't speak English at all ).of residents speak Asian or Pacific Island language at home (81% speak English very well , 10% speak English well , 8% speak English not well , 1% don't speak English at all ).of residents speak other language at home (54% speak English very well , 19% speak English well , 17% speak English not well , 9% don't speak English at all ).
Foreign born population: 3,695 (7.4%)of them are naturalized citizens )
Median number of rooms in houses and condos:
Median number of rooms in apartments
Owner-occupied Renter-occupied
Rooms in owner-occupied houses in Lakewood, Ohio
88 1 room 30 2 rooms 441 3 rooms 685 4 rooms 1,228 5 rooms 2,435 6 rooms 2,482 7 rooms 1,810 8 rooms 2,436 9+ rooms
Rooms in renter-occupied apartments in Lakewood, Ohio
924 1 room 1,462 2 rooms 3,134 3 rooms 3,538 4 rooms 3,144 5 rooms 1,718 6 rooms 414 7 rooms 273 8 rooms 320 9+ rooms
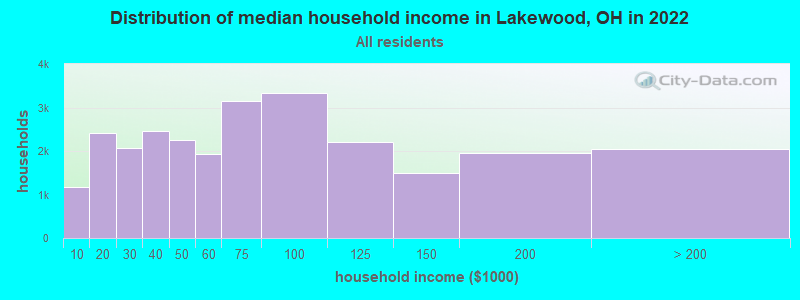
Lakewood, OH household income distribution 1,174 Less than $10,0002,418 $10,000 to $19,9992,063 $20,000 to $29,9992,458 $30,000 to $39,9992,253 $40,000 to $49,9991,935 $50,000 to $59,9993,146 $60,000 to $74,9993,336 $75,000 to $99,9992,199 $100,000 to $124,9991,493 $125,000 to $149,9991,961 $150,000 to $199,9992,048 $200,000 or more
Home value of owner - occupied houses in 2022 in Lakewood, OH 27 Less than $10,00014 $10,000 to $14,99958 $15,000 to $19,99932 $20,000 to $24,99925 $25,000 to $29,99955 $30,000 to $34,9995 $35,000 to $39,99957 $40,000 to $49,99970 $50,000 to $59,99928 $60,000 to $69,99944 $70,000 to $79,999104 $80,000 to $89,999107 $90,000 to $99,999646 $100,000 to $124,999716 $125,000 to $149,9991,577 $150,000 to $174,999992 $175,000 to $199,9992,671 $200,000 to $249,9992,046 $250,000 to $299,9991,638 $300,000 to $399,999821 $400,000 to $499,999376 $500,000 to $749,999232 $750,000 to $999,99974 $1,000,000 to $1,499,99913 $1,500,000 to $1,999,99987 $2,000,000 or moreRent paid by renters in 2022 in Lakewood, OH 24 Less than $1005 $100 to $14912 $150 to $199167 $200 to $24964 $250 to $299205 $300 to $34989 $350 to $39992 $400 to $449213 $450 to $499360 $500 to $549470 $550 to $5991,097 $600 to $6491,324 $650 to $6991,305 $700 to $7491,055 $750 to $7991,790 $800 to $8991,581 $900 to $9992,549 $1,000 to $1,2491,345 $1,250 to $1,499535 $1,500 to $1,99973 $2,000 to $2,4994 $3,000 to $3,49935 $3,500 or more324 No cash rent
Percentage of workers working in this county: 89.0%Number of people working at home: 6,489 (21.3% of all workers )
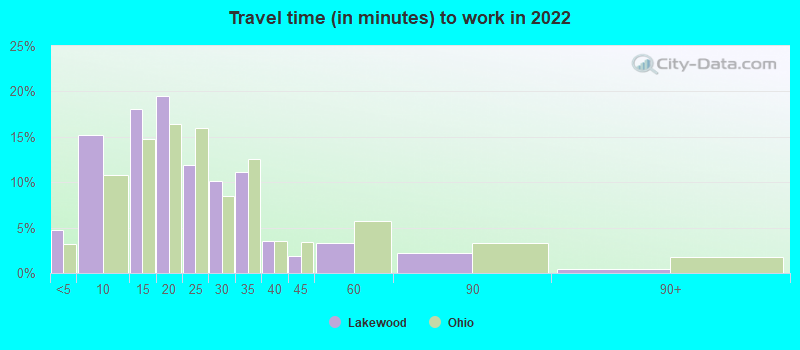
Travel time to work (commute)
Less than 5 minutes: 6155 to 9 minutes: 1,86110 to 14 minutes: 3,31315 to 19 minutes: 4,73720 to 24 minutes: 4,68225 to 29 minutes: 2,66930 to 34 minutes: 3,17235 to 39 minutes: 99040 to 44 minutes: 67645 to 59 minutes: 99760 to 89 minutes: 52690 or more minutes: 300
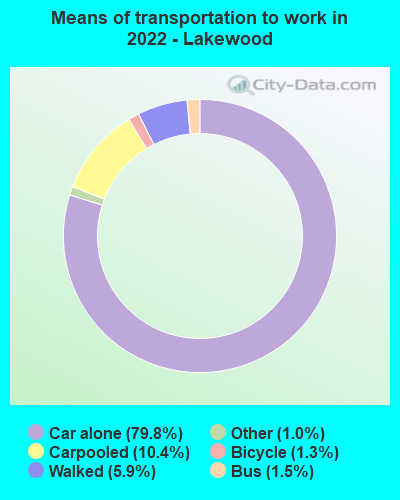
Means of transportation to work:
Drove a car alone: 8,745 (54.4%)Carpooled: 1,154 (7.2%)Bus : 141 (0.9%)Taxi: 118 (0.7%)Bicycle: 235 (1.5%)Walked: 756 (4.7%)Worked at home: 6,489 (40.4%)
Unemployment by race in 2022
Unemployment rate for White non-Hispanic residents 2.4% Males2.2% FemalesUnemployment rate for Black residents 33.4% Males4.5% FemalesUnemployment rate for American Indian and Alaska Native residents 42.1% FemalesUnemployment rate for Asian residents 1.9% MalesUnemployment rate for other race residents 5.0% MalesUnemployment rate for two or more race residents 2.3% Males5.8% FemalesUnemployment rate for Hispanic or Latino residents 1.3% Males4.6% Females
Year of entry for the foreign-born population in Lakewood, Ohio
1,578 2010 or later 543 2000 to 2009 642 1990 to 1999 691 1980 to 1989 541 1970 to 1979 1,446 Before 1970
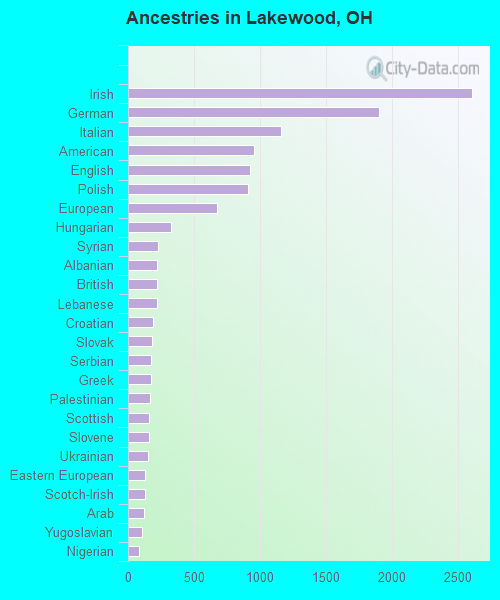
First ancestries reported:
Irish: 2,605 (14.1%)
German: 1,900 (10.3%)
Italian: 1,156 (6.3%)
American: 956 (5.2%)
English: 928 (5.0%)
Polish: 911 (4.9%)
European: 676 (3.7%)
Hungarian: 329 (1.8%)
Syrian: 231 (1.2%)
Albanian: 220 (1.2%)
British: 220 (1.2%)
Lebanese: 217 (1.2%)
Croatian: 187 (1.0%)
Slovak: 182 (1.0%)
Serbian: 178 (1.0%)
Greek: 171 (0.9%)
Palestinian: 170 (0.9%)
Scottish: 162 (0.9%)
Slovene: 158 (0.9%)
Ukrainian: 149 (0.8%)
Eastern European: 129 (0.7%)
Scotch-Irish: 127 (0.7%)
Arab: 118 (0.6%)
Yugoslavian: 109 (0.6%)
Nigerian: 82 (0.4%)
Belgian: 74 (0.4%)
Dutch: 68 (0.4%)
Scandinavian: 67 (0.4%)
Romanian: 65 (0.4%)
Moroccan: 62 (0.3%)
Czech: 55 (0.3%)
Jordanian: 54 (0.3%)
French: 53 (0.3%)
Norwegian: 48 (0.3%)
Afghan: 46 (0.2%)
Austrian: 42 (0.2%)
Finnish: 38 (0.2%)
Swedish: 38 (0.2%)
Egyptian: 29 (0.2%)
Iraqi: 25 (0.1%)
Northern European: 24 (0.1%)
Swiss: 23 (0.1%)
Portuguese: 20 (0.1%)
West Indian: 19 (0.1%)
Russian: 18 (0.10%)
African: 14 (0.08%)
Latvian: 10 (0.05%)
Canadian: 10 (0.05%)
Czechoslovakian: 9 (0.05%)
Macedonian: 8 (0.04%)
Welsh: 8 (0.04%)
Israeli: 7 (0.04%)
Cypriot: 7 (0.04%)
Slavic: 4 (0.02%)
Lithuanian: 2 (0.01%)
Most common places of birth for foreign-born residents (%): Syria Lakewood:
8.5% (327)Ohio:
0.7% (3,842)
Afghanistan Lakewood:
6.1% (232)Ohio:
0.2% (1,151)
Germany Lakewood:
5.3% (202)Ohio:
2.2% (12,846)
Albania Lakewood:
5.1% (195)Ohio:
0.4% (2,186)
Democratic Republic of Congo (Zaire) Lakewood:
4.0% (152)Ohio:
0.4% (2,154)
China, excluding Hong Kong and Taiwan Lakewood:
3.7% (140)Ohio:
6.2% (35,703)
Serbia Lakewood:
3.6% (139)Ohio:
0.3% (1,875)
Italy Lakewood:
3.5% (134)Ohio:
1.2% (6,679)
Mexico Lakewood:
3.2% (123)Ohio:
7.8% (44,796)
Other Western Africa Lakewood:
3.1% (120)Ohio:
0.9% (5,331)
Nigeria Lakewood:
2.9% (112)Ohio:
1.2% (7,029)
Belgium Lakewood:
2.9% (110)Ohio:
0.1% (700)
Tanzania Lakewood:
2.8% (107)Ohio:
0.2% (1,305)
England Lakewood:
2.7% (103)Ohio:
1.0% (5,979)
Philippines Lakewood:
2.3% (88)Ohio:
3.1% (17,818)
Other Eastern Europe Lakewood:
2.2% (84)Ohio:
0.7% (4,155)
Asia, n.e.c. Lakewood:
2.0% (75)Ohio:
0.5% (2,826)
Greece Lakewood:
1.9% (73)Ohio:
0.5% (2,690)
Cuba Lakewood:
1.6% (61)Ohio:
0.4% (2,031)
Romania Lakewood:
1.6% (60)Ohio:
1.1% (6,346)
Pakistan Lakewood:
1.5% (59)Ohio:
1.0% (5,444)
Place of birth for U.S.-born residents:
This state: 35,765Other state: 9,599Northeast: 3,439Midwest: 2,501South: 2,529West: 1,168 80.3% of Lakewood residents lived in the same house 1 years ago.
Out of people who lived in different houses, 39.2% lived in this county.
Out of people who lived in different counties, 54.9% lived in Ohio.
Lakewood:
80.3%State average:
87.8%
Education attainment for males 25 years and older:
No schooling: 123Nursery to 4th grade: 65th and 6th grade: 07th and 8th grade: 1029th grade: 12210th grade: 9911th grade: 16212th grade, no diploma: 193High school graduate (or equivalency): 3,526Less than 1 year of college: 887Some college more than 1 year, no degree: 2,363Associate degree: 1,325Bachelor's degree: 6,704Master's degree: 2,367Professional school degree: 596Doctorate degree: 247
Education attainment for females 25 years and older:
No schooling: 172Nursery to 4th grade: 65th and 6th grade: 467th and 8th grade: 1329th grade: 13710th grade: 12011th grade: 18612th grade, no diploma: 130High school graduate (or equivalency): 3,458Less than 1 year of college: 931Some college more than 1 year, no degree: 2,391Associate degree: 1,314Bachelor's degree: 6,395Master's degree: 3,557Professional school degree: 578Doctorate degree: 261
Housing units in structures:
One, detached: 10,445One, attached: 1,389Two: 4,8323 or 4: 1,4785 to 9: 1,27710 to 19: 2,15920 to 49: 2,31150 or more: 4,757Mobile homes: 49Housing units lacking complete plumbing facilities in 2022: 0.5%Housing units lacking complete kitchen facilities in 2022: 1.1%House/condo owner moved in on average 10 years ago
Renter moved in on average 1 years ago
Private vs. public school enrollment:
Students in private schools in grades 1 to 8 (elementary and middle school): 634 Students in private schools in grades 9 to 12 (high school): 253 Students in private undergraduate colleges: 500