Housing density: 2,701 houses/condos per square mile
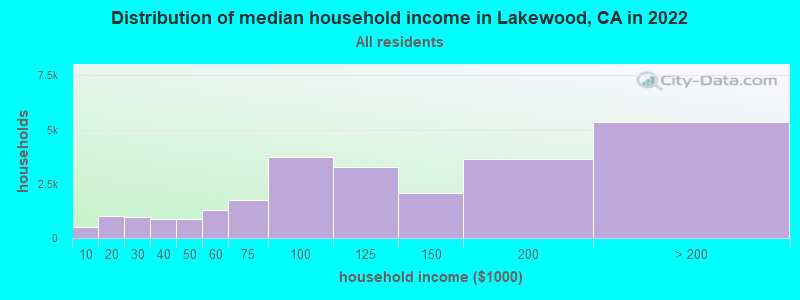
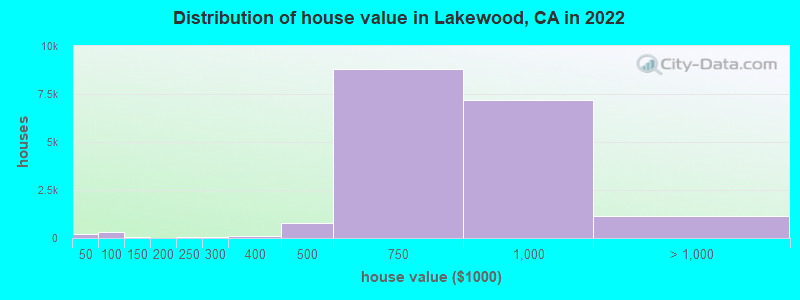
Median price asked for vacant for-sale houses and condos in 2022: $612,031.
Median contract rent in 2022: over $2,000 (lower quartile is $1,483, upper quartile is over $2,000)
Median rent asked for vacant for-rent units in 2022: $2,115
Median gross rent in Lakewood, CA in 2022: over $2,000
Housing units in Lakewood with a mortgage: 11,810 (773 second mortgage, 0 home equity loan, 455 both second mortgage and home equity loan) Houses without a mortgage: 239
Median household income for houses/condos with a mortgage: $159,292
Median household income for apartments without a mortgage: $80,699
9,308 married couples with children.
3,474 single-parent households (1,773 men, 1,701 women).
65.0% of residents of Lakewood speak English at home.
20.2% of residents speak Spanish at home (73% speak English very well, 15% speak English well, 9% speak English not well, 3% don't speak English at all).
2.3% of residents speak other Indo-European language at home (84% speak English very well, 10% speak English well, 6% speak English not well).
12.4% of residents speak Asian or Pacific Island language at home (59% speak English very well, 23% speak English well, 13% speak English not well, 5% don't speak English at all).
0.6% of residents speak other language at home (79% speak English very well, 13% speak English well, 8% speak English not well).
Foreign born population: 18,573 (23.5%)
(68.2% of them are naturalized citizens)
Percentage of workers working in this county: 75.4% Number of people working at home: 5,205 (12.5% of all workers)
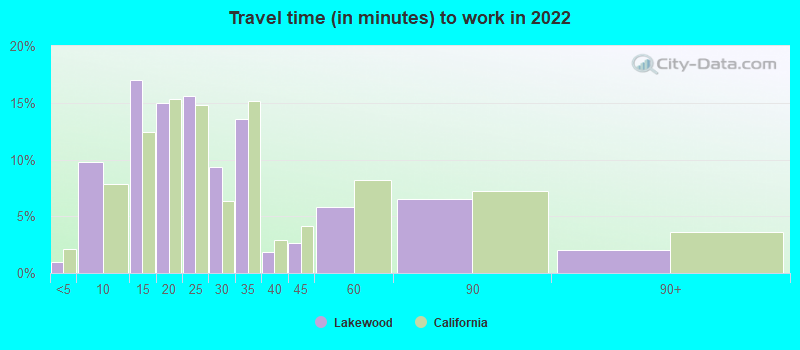
Travel time to work (commute)
Less than 5 minutes: 132
5 to 9 minutes: 2,453
10 to 14 minutes: 3,102
15 to 19 minutes: 4,457
20 to 24 minutes: 6,490
25 to 29 minutes: 2,447
30 to 34 minutes: 6,304
35 to 39 minutes: 1,478
40 to 44 minutes: 2,194
45 to 59 minutes: 4,054
60 to 89 minutes: 2,367
90 or more minutes: 1,054
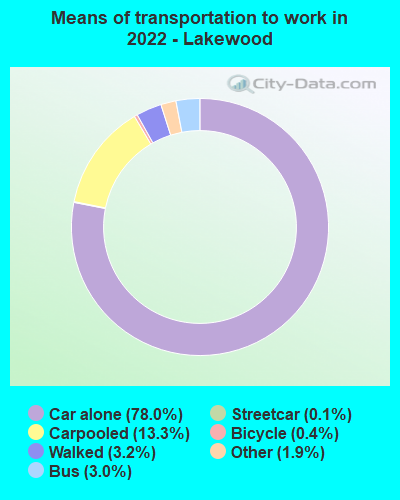
Means of transportation to work:
Drove a car alone: 11,677 (58.9%)
Carpooled: 2,201 (11.1%)
Bus: 404 (2.0%)
Subway or elevated rail: 13 (0.1%)
Taxi: 318 (1.6%)
Bicycle: 64 (0.3%)
Walked: 524 (2.6%)
Worked at home: 5,205 (26.3%)
Unemployment by race in 2022
Unemployment rate for White non-Hispanic residents
6.3%Females
Unemployment rate for Black residents
11.8%Males
2.7%Females
Unemployment rate for American Indian and Alaska Native residents
13.6%Males
Unemployment rate for Asian residents
6.1%Males
3.4%Females
Unemployment rate for other race residents
6.1%Males
14.4%Females
Unemployment rate for two or more race residents
0.8%Males
7.0%Females
Unemployment rate for Hispanic or Latino residents
4.8%Males
9.2%Females
Year of entry for the foreign-born population in Lakewood, California
2,6792010 or later
2,6332000 to 2009
3,1101990 to 1999
4,8561980 to 1989
3,4521970 to 1979
2,474Before 1970
First ancestries reported:
German: 1,419 (3.0%)
English: 1,317 (2.8%)
Italian: 1,299 (2.8%)
American: 973 (2.1%)
Irish: 823 (1.8%)
European: 696 (1.5%)
Polish: 329 (0.7%)
Portuguese: 322 (0.7%)
Ethiopian: 289 (0.6%)
Dutch: 269 (0.6%)
Scottish: 226 (0.5%)
African: 153 (0.3%)
Norwegian: 150 (0.3%)
Romanian: 142 (0.3%)
British: 141 (0.3%)
French: 115 (0.2%)
Iranian: 101 (0.2%)
Scotch-Irish: 93 (0.2%)
Greek: 91 (0.2%)
French Canadian: 87 (0.2%)
Swedish: 81 (0.2%)
Eastern European: 76 (0.2%)
Welsh: 72 (0.2%)
Danish: 71 (0.2%)
Serbian: 70 (0.1%)
Russian: 66 (0.1%)
Nigerian: 61 (0.1%)
Syrian: 54 (0.1%)
Scandinavian: 50 (0.1%)
Brazilian: 42 (0.09%)
Jamaican: 37 (0.08%)
Palestinian: 34 (0.07%)
Moroccan: 34 (0.07%)
Finnish: 34 (0.07%)
Canadian: 31 (0.07%)
Egyptian: 31 (0.07%)
Armenian: 28 (0.06%)
Turkish: 25 (0.05%)
Northern European: 24 (0.05%)
Czech: 22 (0.05%)
Lebanese: 21 (0.04%)
Belizean: 19 (0.04%)
Czechoslovakian: 18 (0.04%)
Israeli: 12 (0.03%)
Icelander: 8 (0.02%)
Guyanese: 7 (0.01%)
Basque: 6 (0.01%)
Swiss: 5 (0.01%)
Bahamian: 3 (0.01%)
Most common places of birth for foreign-born residents (%):
Mexico
Lakewood:
26.3% (4,374)
California:
37.2% (3,881,193)
Philippines
Lakewood:
25.9% (4,322)
California:
7.8% (818,297)
Cambodia
Lakewood:
8.4% (1,403)
California:
0.5% (51,974)
Korea
Lakewood:
3.9% (647)
California:
3.0% (315,248)
Guatemala
Lakewood:
3.1% (512)
California:
2.8% (290,436)
El Salvador
Lakewood:
3.1% (509)
California:
4.2% (440,287)
China, excluding Hong Kong and Taiwan
Lakewood:
2.8% (473)
California:
6.6% (684,672)
Thailand
Lakewood:
2.8% (459)
California:
0.6% (65,335)
Vietnam
Lakewood:
2.7% (447)
California:
4.9% (512,335)
Place of birth for U.S.-born residents:
This state: 49,806
Other state: 9,304
Northeast: 1,920
Midwest: 2,952
South: 2,919
West: 1,513
91.9% of Lakewood residents lived in the same house 1 years ago. Out of people who lived in different houses, 41.9% lived in this county. Out of people who lived in different counties, 78.2% lived in California.
Lakewood:
91.9%
State average:
88.9%
Education attainment for males 25 years and older:
No schooling: 658
Nursery to 4th grade: 68
5th and 6th grade: 301
7th and 8th grade: 0
9th grade: 171
10th grade: 41
11th grade: 266
12th grade, no diploma: 888
High school graduate (or equivalency): 5,750
Less than 1 year of college: 2,400
Some college more than 1 year, no degree: 5,354
Associate degree: 2,673
Bachelor's degree: 6,168
Master's degree: 1,667
Professional school degree: 352
Doctorate degree: 263
Education attainment for females 25 years and older:
No schooling: 949
Nursery to 4th grade: 39
5th and 6th grade: 226
7th and 8th grade: 325
9th grade: 413
10th grade: 46
11th grade: 321
12th grade, no diploma: 721
High school graduate (or equivalency): 6,467
Less than 1 year of college: 2,171
Some college more than 1 year, no degree: 5,098
Associate degree: 2,549
Bachelor's degree: 5,540
Master's degree: 3,514
Professional school degree: 366
Doctorate degree: 197
Housing units in structures:
One, detached: 20,243
One, attached: 1,086
Two: 144
3 or 4: 478
5 to 9: 862
10 to 19: 974
20 to 49: 567
50 or more: 1,119
Housing units lacking complete plumbing facilities in 2022: 0.2%
Housing units lacking complete kitchen facilities in 2022: 0.9%
House/condo owner moved in on average 17 years ago