Lakeway, TX (Texas) Houses and Residents
| Lakeway: | $821,641 |
| Texas: | $275,400 |
Mean price in 2022:
Detached houses: $863,399
Here: $863,399 State: $369,058 Townhouses or other attached units: $521,899
Here: $521,899 State: $327,631 In 3-to-4-unit structures: $395,165
Here: $395,165 State: $209,652 In 5-or-more-unit structures: $498,334
Here: $498,334 State: $413,944
Total population: 13,685 (Urban population: 8,070 (all inside urban clusters), Rural population: 103 (all nonfarm))
Houses: 9,261 (8,413 occupied: 7,071 owner occupied, 1,364 renter occupied)
| % of renters here: | 16% |
| State: | 38% |
Housing density: 1,596 houses/condos per square mile
Median price asked for vacant for-sale houses and condos in 2022: $452,738.
Median contract rent in 2022: over $2,000 (lower quartile is $1,679, upper quartile is over $2,000)
Median rent asked for vacant for-rent units in 2022: $3,779
Median gross rent in Lakeway, TX in 2022: over $2,000
Housing units in Lakeway with a mortgage: 4,694 (335 second mortgage, 101 home equity loan, 210 both second mortgage and home equity loan)
Houses without a mortgage: 69
Median household income for houses/condos with a mortgage: $199,192
Median household income for apartments without a mortgage: $138,389
Median monthly housing costs: $2,640
Compare current foreclosures near Lakeway, TX:
| Photo | Address | Area | Beds / Baths | Price | Details |
|---|---|---|---|---|---|

|
#1
Buttercup Creek Blvd Unit 602
Cedar Park, TX 78613
|
1,336 sq. feet
|
2 baths 3 beds |
show details | |

|
#2
White Sands Dr
Austin, TX 78734
|
2,256 sq. feet
|
2 baths 4 beds |
show details | |

|
#3
Hilltop Dr
Leander, TX 78641
|
1,274 sq. feet
|
2 baths 3 beds |
show details | |

|
#4
Exposition Blvd
Austin, TX 78703
|
2,156 sq. feet
|
2 baths 3 beds |
show details | |

|
#5
S West Dr
Leander, TX 78641
|
1,163 sq. feet
|
2 baths 3 beds |
show details | |

|
#6
Romayne Ln
Austin, TX 78748
|
1,372 sq. feet
|
2 baths 3 beds |
show details | |

|
#7
Ritter Dr
Cedar Park, TX 78613
|
2,712 sq. feet
|
2 baths 3 beds |
show details | |

|
#8
Boggy Ridge Dr
Austin, TX 78748
|
1,129 sq. feet
|
2 baths 3 beds |
show details | |

|
#9
Rolling Green Dr
Austin, TX 78734
|
2,289 sq. feet
|
3 baths 4 beds |
show details | |

|
#10
Paradise Manor Cir
Marble Falls, TX 78654
|
2,590 sq. feet
|
1 baths - beds |
show details |
| Photo | Address | Area | Beds / Baths | Price | Details |
|---|---|---|---|---|---|

|
#11
Turtle River Dr
Leander, TX 78641
|
1,666 sq. feet
|
2 baths - beds |
show details | |

|
#12
Marin Cv
Leander, TX 78641
|
2,079 sq. feet
|
2 baths - beds |
show details | |

|
#13
Candlelight Dr
Leander, TX 78641
|
2,339 sq. feet
|
2 baths - beds |
show details | |

|
#14
Pebble Garden Ln
Austin, TX 78739
|
4,544 sq. feet
|
3 baths - beds |
show details | |

|
#15
Tisdale Dr
Austin, TX 78757
|
1,469 sq. feet
|
1 baths - beds |
show details | |

|
#16
S Bell Blvd
Cedar Park, TX 78613
|
1,420 sq. feet
|
- baths - beds |
show details | |

|
#17
Zach Russell Dr
Cedar Park, TX 78613
|
3,859 sq. feet
|
4 baths - beds |
show details | |

|
#18
Bliss Spillar Rd
Manchaca, TX 78652
|
1,570 sq. feet
|
2 baths - beds |
show details | |

|
#19
Brentwood Dr
Leander, TX 78641
|
2,228 sq. feet
|
2 baths - beds |
show details | |

|
#20
Almarion Way
Austin, TX 78746
|
1,782 sq. feet
|
1 baths - beds |
show details |
| Photo | Address | Area | Beds / Baths | Price | Details |
|---|---|---|---|---|---|

|
#21
Comfort Cv
Austin, TX 78731
|
2,099 sq. feet
|
2 baths - beds |
show details | |

|
#22
Liberty Park 401
Austin, TX 78746
|
3,607 sq. feet
|
3 baths - beds |
show details | |

|
#23
Twin Oak Trl
Cedar Park, TX 78613
|
1,340 sq. feet
|
2 baths - beds |
show details | |

|
#24
Turkey Path Bnd
Cedar Park, TX 78613
|
3,206 sq. feet
|
2 baths - beds |
show details | |

|
#25
Chukar Cir
Austin, TX 78758
|
1,233 sq. feet
|
2 baths - beds |
show details | |

|
#26
Knollwood Dr # B
Austin, TX 78731
|
1,310 sq. feet
|
2 baths - beds |
show details | |

|
#27
Pleasant Dr
Austin, TX 78746
|
2,489 sq. feet
|
3 baths - beds |
show details | |

|
#28
Romeo Dr
Cedar Park, TX 78613
|
2,518 sq. feet
|
2 baths - beds |
show details | |

|
#29
Chardonnay Xing
Leander, TX 78641
|
1,928 sq. feet
|
2 baths - beds |
show details | |

|
#30
Harvest Bend Ln
Cedar Park, TX 78613
|
2,235 sq. feet
|
2 baths - beds |
show details |
| Photo | Address | Area | Beds / Baths | Price | Details |
|---|---|---|---|---|---|

|
#31
Firethorn Ln
Austin, TX 78750
|
1,290 sq. feet
|
2 baths - beds |
show details | |

|
#32
Alden Dr
Austin, TX 78758
|
1,214 sq. feet
|
2 baths - beds |
show details | |

|
#33
Westlake Dr Apt 1
Austin, TX 78746
|
4,608 sq. feet
|
5 baths - beds |
show details | |

|
#34
Cordova Dr
Austin, TX 78759
|
2,307 sq. feet
|
2 baths - beds |
show details | |

|
#35
Harvestman Cv
Austin, TX 78731
|
4,199 sq. feet
|
4 baths - beds |
show details | |

|
#36
Prince Dr
Austin, TX 78752
|
2,096 sq. feet
|
2 baths - beds |
show details | |

|
#37
Northcrest Blvd
Austin, TX 78752
|
1,144 sq. feet
|
2 baths - beds |
show details | |

|
#38
S 3rd St
Austin, TX 78704
|
1,690 sq. feet
|
1 baths - beds |
show details | |

|
#39
Holly Springs Dr
Austin, TX 78748
|
768 sq. feet
|
2 baths - beds |
show details | |

|
#40
W 30th St
Austin, TX 78705
|
1,203 sq. feet
|
1 baths - beds |
show details |
| Photo | Address | Area | Beds / Baths | Price | Details |
|---|---|---|---|---|---|

|
#41
Pyreneese Dr
Austin, TX 78759
|
1,604 sq. feet
|
2 baths - beds |
show details | |

|
#42
Glen Field Dr
Cedar Park, TX 78613
|
2,593 sq. feet
|
2 baths - beds |
show details | |

|
#43
Burnhill Dr
Austin, TX 78745
|
1,531 sq. feet
|
1 baths - beds |
show details | |

|
#44
Primrose Ln
Leander, TX 78641
|
1,402 sq. feet
|
2 baths - beds |
show details | |

|
#45
Brushy Creek Rd # A
Cedar Park, TX 78613
|
1,280 sq. feet
|
3 baths - beds |
show details | |

|
#46
Spotted Horse Dr
Austin, TX 78759
|
1,549 sq. feet
|
2 baths - beds |
show details | |

|
#47
Banbridge Trl
Austin, TX 78717
|
2,448 sq. feet
|
2 baths - beds |
show details | |

|
#48
New Lido Dr
Austin, TX 78734
|
2,062 sq. feet
|
2 baths - beds |
show details | |

|
#49
Iron Horse
Leander, TX 78641
|
2,093 sq. feet
|
2 baths - beds |
show details | |

|
Check over 1 million property listings on Foreclosure.com!
|
browse all offers | |||

Latest news about housing in Lakeway, TX collected exclusively by city-data.com from local newspapers, TV, and radio stations


Median year apartment built: 2012
Household type by relationship:
Households: 19,381- Male householders: 4,093 (597 living alone), Female householders: 3,876 (865 living alone)
5,248 spouses (5,214 opposite-sex spouses), 119 unmarried partners, (112 opposite-sex unmarried partners), 5,383 children (5,052 natural, 186 adopted, 145 stepchildren), 95 grandchildren, 6 brothers or sisters, 249 parents, 0 foster children, 10 other relatives, 113 non-relatives
- In group quarters: 185
Size of family households: 3,714 2-persons, 1,169 3-persons, 1,167 4-persons, 318 5-persons, 48 6-persons, 42 7-or-more-persons.
Size of nonfamily households: 1,655 1-person, 105 2-persons.
3,183 married couples with children.
859 single-parent households (439 men, 420 women).
89.8% of residents of Lakeway speak English at home.
4.7% of residents speak Spanish at home (82% speak English very well, 17% speak English well, 1% don't speak English at all).
3.3% of residents speak other Indo-European language at home (84% speak English very well, 9% speak English well, 7% speak English not well).
2.6% of residents speak Asian or Pacific Island language at home (84% speak English very well, 12% speak English well, 4% speak English not well).
0.7% of residents speak other language at home (99% speak English very well, 1% speak English not well).
Foreign born population: 1,469 (7.6%)
(74.5% of them are naturalized citizens)
| Here: | 7.6 |
| State: | 6.3 |
| Here: | 5.3 |
| State: | 4.0 |

- Bedrooms in owner-occupied houses and condos in Lakeway, Texas
- 0no bedroom
- 2671 bedroom
- 3712 bedrooms
- 2,8403 bedrooms
- 2,5734 bedrooms
- 1,0215+ bedrooms

- Bedrooms in renter-occupied apartments in Lakeway, Texas
- 63no bedroom
- 2021 bedroom
- 3282 bedrooms
- 5523 bedrooms
- 2024 bedrooms
- 195+ bedrooms

- Cars and other vehicles available in Lakeway in owner-occupied houses/condos
- 50no vehicle
- 1,3171 vehicle
- 3,9682 vehicles
- 1,2773 vehicles
- 3374 vehicles
- 1235+ vehicles

- Cars and other vehicles available in Lakeway in renter-occupied apartments
- 150no vehicle
- 7241 vehicle
- 3812 vehicles
- 1093 vehicles
- 04 vehicles
- 05+ vehicles

- Rooms in owner-occupied houses in Lakeway, Texas
- 01 room
- 02 rooms
- 253 rooms
- 1354 rooms
- 6585 rooms
- 1,6096 rooms
- 9427 rooms
- 1,1158 rooms
- 2,5879+ rooms

- Rooms in renter-occupied apartments in Lakeway, Texas
- 631 room
- 732 rooms
- 1833 rooms
- 1994 rooms
- 1615 rooms
- 3816 rooms
- 1557 rooms
- 618 rooms
- 889+ rooms


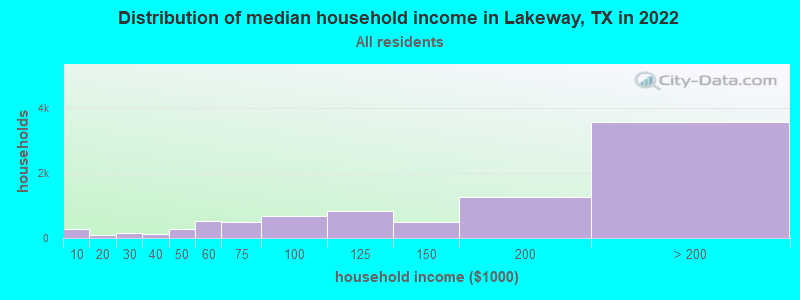
Lakeway, TX household income distribution

- 264Less than $10,000
- 102$10,000 to $19,999
- 168$20,000 to $29,999
- 131$30,000 to $39,999
- 270$40,000 to $49,999
- 522$50,000 to $59,999
- 491$60,000 to $74,999
- 668$75,000 to $99,999
- 828$100,000 to $124,999
- 490$125,000 to $149,999
- 1,250$150,000 to $199,999
- 3,558$200,000 or more
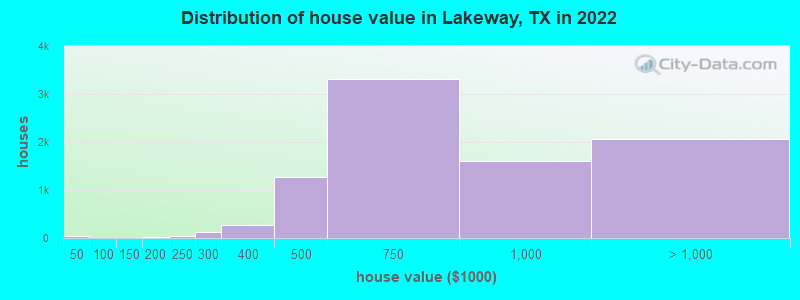
Home value of owner - occupied houses in 2022 in Lakeway, TX
-
- 34Less than $10,000
- 9$100,000 to $124,999
- 11$150,000 to $174,999
- 4$175,000 to $199,999
- 51$200,000 to $249,999
- 119$250,000 to $299,999
- 275$300,000 to $399,999
- 1,266$400,000 to $499,999
- 3,320$500,000 to $749,999
- 1,596$750,000 to $999,999
- 1,186$1,000,000 to $1,499,999
- 429$1,500,000 to $1,999,999
- 452$2,000,000 or more
Rent paid by renters in 2022 in Lakeway, TX
-
- 18$650 to $699
- 36$800 to $899
- 15$1,000 to $1,249
- 183$1,250 to $1,499
- 302$1,500 to $1,999
- 230$2,000 to $2,499
- 335$2,500 to $2,999
- 170$3,000 to $3,499
- 238$3,500 or more
- 44No cash rent


Percentage of workers working in this county: 95.3%
Number of people working at home: 4,798 (54.2% of all workers)
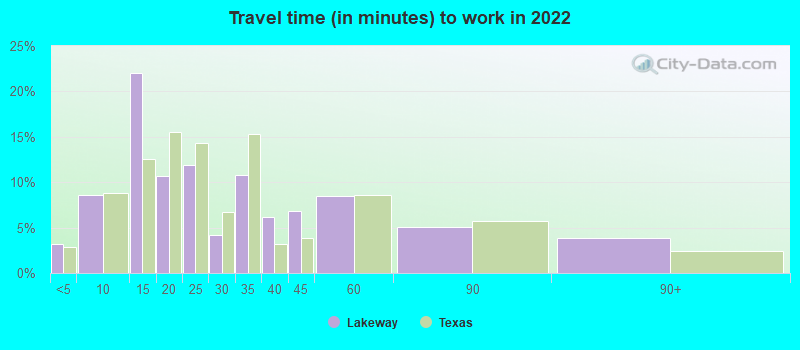
Travel time to work (commute)
- Less than 5 minutes: 280
- 5 to 9 minutes: 414
- 10 to 14 minutes: 650
- 15 to 19 minutes: 586
- 20 to 24 minutes: 590
- 25 to 29 minutes: 264
- 30 to 34 minutes: 550
- 35 to 39 minutes: 435
- 40 to 44 minutes: 150
- 45 to 59 minutes: 551
- 60 to 89 minutes: 226
- 90 or more minutes: 20
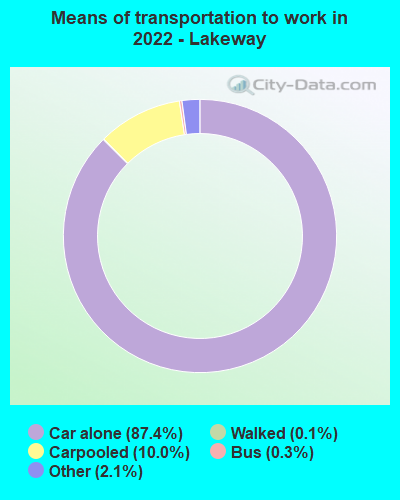
Means of transportation to work:
- Drove a car alone: 5,224 (51.8%)
- Carpooled: 606 (6.0%)
- Bus: 17 (0.2%)
- Taxi: 153 (1.5%)
- Walked: 8 (0.1%)
- Worked at home: 4,798 (47.6%)

- Unemployment by race in 2022
- Unemployment rate for White non-Hispanic residents
- 2.1%Males
- 1.0%Females
- Unemployment rate for Asian residents
- 6.7%Males
- 2.4%Females
- Unemployment rate for other race residents
- 4.4%Females
- Unemployment rate for two or more race residents
- 2.8%Females
- Unemployment rate for Hispanic or Latino residents
- 7.8%Females

- Year of entry for the foreign-born population in Lakeway, Texas
- 4962010 or later
- 2582000 to 2009
- 1981990 to 1999
- 821980 to 1989
- 341970 to 1979
- 155Before 1970

First ancestries reported:
- German: 1,289 (13.8%)
- English: 1,285 (13.8%)
- European: 1,092 (11.7%)
- American: 639 (6.8%)
- Irish: 561 (6.0%)
- Italian: 249 (2.7%)
- Scottish: 228 (2.4%)
- Dutch: 194 (2.1%)
- Scotch-Irish: 188 (2.0%)
- British: 162 (1.7%)
- French: 150 (1.6%)
- Swedish: 130 (1.4%)
- African: 115 (1.2%)
- Polish: 97 (1.0%)
- Czech: 79 (0.8%)
- Norwegian: 78 (0.8%)
- Scandinavian: 65 (0.7%)
- Russian: 50 (0.5%)
- Albanian: 42 (0.5%)
- Finnish: 37 (0.4%)
- Eastern European: 33 (0.4%)
- Danish: 30 (0.3%)
- Iranian: 29 (0.3%)
- Canadian: 29 (0.3%)
- French Canadian: 29 (0.3%)
- Greek: 27 (0.3%)
- Swiss: 23 (0.2%)
- Northern European: 12 (0.1%)
- Lebanese: 11 (0.1%)
- Bulgarian: 11 (0.1%)
- Austrian: 10 (0.1%)
- Hungarian: 9 (0.10%)
- Welsh: 6 (0.06%)
- Israeli: 4 (0.04%)
Most common places of birth for foreign-born residents (%):
| Lakeway: | 14.5% (213) |
| Texas: | 6.1% (306,347) |
| Lakeway: | 8.6% (127) |
| Texas: | 0.4% (18,642) |
| Lakeway: | 7.9% (117) |
| Texas: | 0.1% (7,230) |
| Lakeway: | 6.9% (101) |
| Texas: | 0.5% (24,723) |
| Lakeway: | 4.7% (70) |
| Texas: | 0.1% (5,793) |
| Lakeway: | 4.6% (68) |
| Texas: | 1.1% (55,371) |
| Lakeway: | 4.1% (61) |
| Texas: | 2.3% (115,558) |
| Lakeway: | 3.6% (53) |
| Texas: | 0.5% (26,969) |
| Lakeway: | 3.4% (50) |
| Texas: | 0.1% (6,728) |
| Lakeway: | 2.9% (43) |
| Texas: | 3.7% (184,770) |
| Lakeway: | 2.7% (40) |
| Texas: | 2.1% (103,148) |
| Lakeway: | 2.6% (38) |
| Texas: | 0.4% (20,885) |
| Lakeway: | 2.5% (37) |
| Texas: | 48.4% (2,411,723) |
| Lakeway: | 2.5% (37) |
| Texas: | 0.0% (755) |
| Lakeway: | 2.4% (36) |
| Texas: | 0.0% (1,899) |
| Lakeway: | 2.4% (35) |
| Texas: | 0.3% (16,549) |
| Lakeway: | 2.2% (33) |
| Texas: | 0.4% (17,796) |
| Lakeway: | 2.2% (32) |
| Texas: | 1.2% (60,172) |
| Lakeway: | 2.0% (29) |
| Texas: | 0.2% (8,866) |
| Lakeway: | 1.9% (28) |
| Texas: | 0.2% (11,402) |
| Lakeway: | 1.8% (27) |
| Texas: | 0.0% (2,130) |
| Lakeway: | 1.8% (26) |
| Texas: | 0.6% (28,963) |
| Lakeway: | 1.6% (23) |
| Texas: | 0.4% (17,748) |
Place of birth for U.S.-born residents:
- This state: 7,650
- Other state: 10,247
- Northeast: 1,884
- Midwest: 3,343
- South: 2,331
- West: 2,703
88.8% of Lakeway residents lived in the same house 1 years ago.
Out of people who lived in different houses, 24.4% lived in this county.
Out of people who lived in different counties, 28.3% lived in Texas.
| Lakeway: | 88.8% |
| State average: | 85.7% |
Education attainment for males 25 years and older:
- No schooling: 9
- Nursery to 4th grade: 0
- 5th and 6th grade: 0
- 7th and 8th grade: 0
- 9th grade: 0
- 10th grade: 0
- 11th grade: 0
- 12th grade, no diploma: 0
- High school graduate (or equivalency): 299
- Less than 1 year of college: 183
- Some college more than 1 year, no degree: 872
- Associate degree: 174
- Bachelor's degree: 3,601
- Master's degree: 1,590
- Professional school degree: 479
- Doctorate degree: 190

Education attainment for females 25 years and older:
- No schooling: 0
- Nursery to 4th grade: 0
- 5th and 6th grade: 0
- 7th and 8th grade: 0
- 9th grade: 34
- 10th grade: 32
- 11th grade: 17
- 12th grade, no diploma: 18
- High school graduate (or equivalency): 639
- Less than 1 year of college: 373
- Some college more than 1 year, no degree: 927
- Associate degree: 293
- Bachelor's degree: 3,576
- Master's degree: 1,083
- Professional school degree: 391
- Doctorate degree: 194


Housing units in structures:
- One, detached: 7,307
- One, attached: 714
- Two: 122
- 3 or 4: 247
- 5 to 9: 275
- 10 to 19: 38
- 20 to 49: 199
- 50 or more: 332
- Boats, RVs, vans, etc.: 21
Housing units lacking complete kitchen facilities in 2022: 3.2%

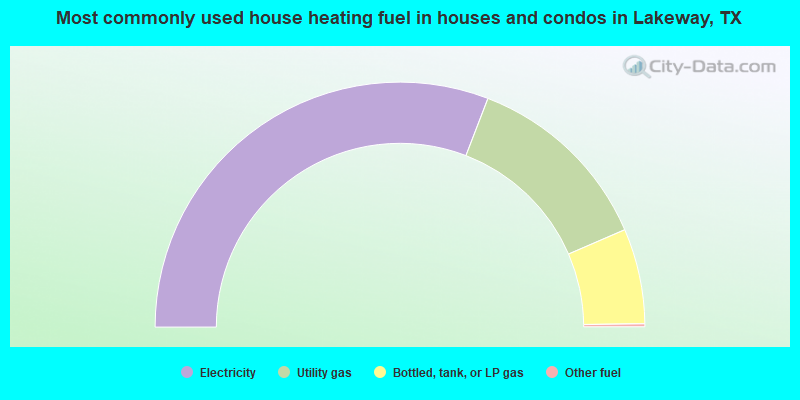
- 61.7%Electricity
- 25.3%Utility gas
- 12.6%Bottled, tank, or LP gas
- 0.4%Other fuel
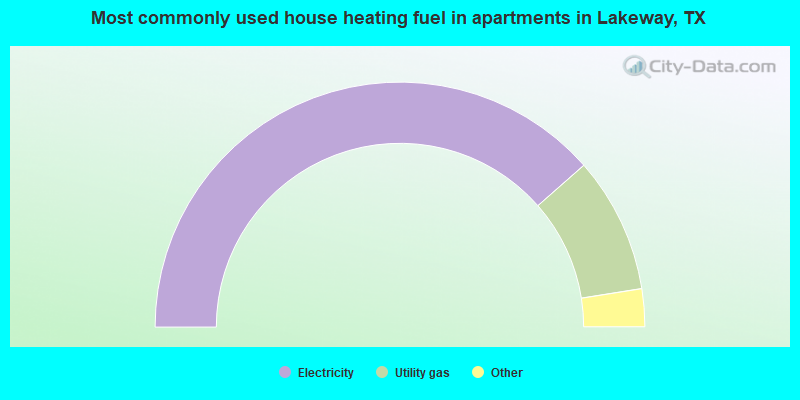
- 77.2%Electricity
- 18.0%Utility gas
- 3.3%Bottled, tank, or LP gas
- 1.6%No fuel used
Private vs. public school enrollment:
| Here: | 8.5% |
| Texas: | 8.8% |
| Here: | 1.6% |
| Texas: | 8.0% |
| Here: | 39.7% |
| Texas: | 16.2% |


