Lakeside, FL (Florida) Houses and Residents
Estimated median house or condo value in 2022: $267,821 (it was $102,000 in 2000 )
Lakeside:
$267,821Florida:
$354,100
Lower value quartile - upper value quartile: $196,114 - $320,347Mean price in 2022: Detached houses: $299,833 Here:
$299,833State:
$500,941
Townhouses or other attached units: $184,201 Here:
$184,201State:
$370,869
In 5-or-more-unit structures: $79,903 Here:
$79,903State:
$447,145
Mobile homes: $122,527 Here:
$122,527State:
$113,202
Total population: 30,943 (Urban population: 30,442, Rural population: 407 (all nonfarm) )
Houses: 12,766 (12,113 occupied: 8,934 owner occupied, 3,528 renter occupied )
% of renters here:
28%State:
33%
Housing density: 842 houses/condos per square mile
Median price asked for vacant for-sale houses and condos in 2022: $179,290.
Median contract rent in 2022: $1,280 (lower quartile is $885, upper quartile is $1,679)
Median rent asked for vacant for-rent units in 2022: $1,603
Median gross rent in Lakeside, FL in 2022: $1,463
Housing units in Lakeside with a mortgage: 6,379 (542 second mortgage, 91 home equity loan, 407 both second mortgage and home equity loan )Houses without a mortgage: 170
Median household income for houses/condos with a mortgage: $97,539
Median household income for apartments without a mortgage: $52,062
Median monthly housing costs: $1,260
Data:
Median house or condo value ($)
Median house or condo value ($ change since 2000)
Median house or condo value ($) - White
Median house or condo value ($) - Black or African American
Median house or condo value ($) - Asian
Median house or condo value ($) - Hispanic or Latino
Median house or condo value ($) - American Indian and Alaska Native
Median house or condo value ($) - Multirace
Median house or condo value ($) - Other Race
Median price asked for mobile homes ($)
Household density (households per square mile)
Mean house or condo value by units in structure - 1, detached ($)
Mean house or condo value by units in structure - 1, attached ($)
Mean house or condo value by units in structure - 2 ($)
Mean house or condo value by units in structure by units in structure - 3 or 4 ($)
Mean house or condo value by units in structure - 5 or more ($)
Mean house or condo value by units in structure - Boat, RV, van, etc. ($)
Mean house or condo value by units in structure - Mobile home ($)
Median contract rent ($)
Median contract rent - Lower quartile ($)
Median contract rent - Upper quartile ($)
Median gross rent ($)
Urban houses (%)
Rural houses (%)
Houses occupied (%)
Houses occupied (% change since 2000)
Houses owner occupied (%)
Houses owner occupied (% change since 2000)
Houses renter occupied (%)
Houses renter occupied (% change since 2000)
Vacant housing units - For rent (%)
Vacant housing units - For rent (% change since 2000)
Vacant housing units - For sale only (%)
Vacant housing units - For sale only (% change since 2000)
Vacant housing units - Rented or sold, not occupied (%)
Vacant housing units - Rented or sold, not occupied (% change since 2000)
Vacant housing units - For seasonal, recreational, or occasional use (%)
Vacant housing units - For seasonal, recreational, or occasional use (% change since 2000)
Vacant housing units - For migrant workers (%)
Vacant housing units - For migrant workers (% change since 2000)
Vacant housing units - Other vacant (%)
Vacant housing units - Other vacant (% change since 2000)
Median monthly housing costs ($)
Median household income for houses/condos with a mortgage ($)
Median household income for houses/condos without a mortgage ($)
Median household income ($)
Median household income ($) - White
Median household income ($) - Black or African American
Median household income ($) - Asian
Median household income ($) - Hispanic or Latino
Median household income ($) - American Indian and Alaska Native
Median household income ($) - Multirace
Median household income ($) - Other Race
Mortgage status - with mortgage (%)
Mortgage status - with second mortgage (%)
Mortgage status - with home equity loan (%)
Mortgage status - with both second mortgage and home equity loan (%)
Mortgage status - without a mortgage (%)
Median year house/condo built
Median year apartment built
Household type by relationship - Male householder living alone (%)
Household type by relationship - Male householder not living alone (%)
Household type by relationship - Female householder living alone (%)
Household type by relationship - Female householder not living alone (%)
Household type by relationship - Opposite-Sex spouse (%)
Household type by relationship - Same-Sex spouse (%)
Household type by relationship - Opposite-Sex unmarried partner (%)
Household type by relationship - Same-Sex unmarried partner (%)
Household type by relationship - In group quarters (%)
Size of family households - 2-person household (%)
Size of family households - 3-person household (%)
Size of family households - 4-person household (%)
Size of family households - 5-person household (%)
Size of family households - 6-person household (%)
Size of family households - 7-or-more-person household (%)
Size of nonfamily households - 1-person household (%)
Size of nonfamily households - 2-person household (%)
Size of nonfamily households - 3-person household (%)
Size of nonfamily households - 4-person household (%)
Size of nonfamily households - 5-person household (%)
Size of nonfamily households - 6-person household (%)
Size of nonfamily households - 7-or-moreperson household (%)
Year house built - Built 2010 or later (%)
Year house built - Built 2000 to 2009 (%)
Year house built - Built 1990 to 1999 (%)
Year house built - Built 1980 to 1989 (%)
Year house built - Built 1970 to 1979 (%)
Year house built - Built 1960 to 1969 (%)
Year house built - Built 1950 to 1959 (%)
Year house built - Built 1940 to 1949 (%)
Year house built - Built 1939 or earlier (%)
Median number of rooms in houses and condos
Median number of rooms in apartments
Median number of bedrooms in owner occupied houses
Mean number of bedrooms in owner occupied houses
Median number of bedrooms in renter occupied houses
Mean number of bedrooms in renter occupied houses
Median number of vehichles in owner occupied houses
Mean number of vehichles in owner occupied houses
Median number of vehichles in renter occupied houses
Mean number of vehichles in renter occupied houses
Rooms in owner-occupied houses - 1 room (%)
Rooms in owner-occupied houses - 2 rooms (%)
Rooms in owner-occupied houses - 3 rooms (%)
Rooms in owner-occupied houses - 4 rooms (%)
Rooms in owner-occupied houses - 5 rooms (%)
Rooms in owner-occupied houses - 6 rooms (%)
Rooms in owner-occupied houses - 7 rooms (%)
Rooms in owner-occupied houses - 8 rooms (%)
Rooms in owner-occupied houses - 9+ rooms (%)
Rooms in renter-occupied houses - 1 room (%)
Rooms in renter-occupied houses - 2 rooms (%)
Rooms in renter-occupied houses - 3 rooms (%)
Rooms in renter-occupied houses - 4 rooms (%)
Rooms in renter-occupied houses - 5 rooms (%)
Rooms in renter-occupied houses - 6 rooms (%)
Rooms in renter-occupied houses - 7 rooms (%)
Rooms in renter-occupied houses - 8 rooms (%)
Rooms in renter-occupied houses - 9+ rooms (%)
Bedrooms in owner-occupied houses - no bedrooms (%)
Bedrooms in owner-occupied houses - 1 bedroom (%)
Bedrooms in owner-occupied houses - 2 bedrooms (%)
Bedrooms in owner-occupied houses - 3 bedrooms (%)
Bedrooms in owner-occupied houses - 4 bedrooms (%)
Bedrooms in owner-occupied houses - 5+ bedrooms (%)
Bedrooms in renter-occupied houses - no bedrooms (%)
Bedrooms in renter-occupied houses - 1 bedroom (%)
Bedrooms in renter-occupied houses - 2 bedrooms (%)
Bedrooms in renter-occupied houses - 3 bedrooms (%)
Bedrooms in renter-occupied houses - 4 bedrooms (%)
Bedrooms in renter-occupied houses - 5+ bedrooms (%)
Vehicles available in owner-occupied houses - no vehicle available (%)
Vehicles available in owner-occupied houses - 1 vehicle available(%)
Vehicles available in owner-occupied houses - 2 Vehicles available (%)
Vehicles available in owner-occupied houses - 3 Vehicles available (%)
Vehicles available in owner-occupied houses - 4 Vehicles available (%)
Vehicles available in owner-occupied houses - 5+ Vehicles available (%)
Vehicles available in renter-occupied houses - no vehicle available (%)
Vehicles available in renter-occupied houses - 1 vehicle available (%)
Vehicles available in renter-occupied houses - 2 Vehicles available (%)
Vehicles available in renter-occupied houses - 3 Vehicles available (%)
Vehicles available in renter-occupied houses - 4 Vehicles available (%)
Vehicles available in renter-occupied houses - 5+ Vehicles available (%)
Housing units in structures - 1, detached (%)
Housing units in structures - 1, attached (%)
Housing units in structures - 2 (%)
Housing units in structures - 3 or 4 (%)
Housing units in structures - 5 to 9 (%)
Housing units in structures - 10 to 19 (%)
Housing units in structures - 20 to 49 (%)
Housing units in structures - 50 or more (%)
Housing units in structures - Mobile home (%)
Housing units in structures - Boat, RV, van, etc. (%)
Housing units in structures - Owners - 1, detached (%)
Housing units in structures - Owners - 1, attached (%)
Housing units in structures - Owners - 2 (%)
Housing units in structures - Owners - 3 or 4 (%)
Housing units in structures - Owners - 5 to 9 (%)
Housing units in structures - Owners - 10 to 19 (%)
Housing units in structures - Owners - 20 to 49 (%)
Housing units in structures - Owners - 50 or more (%)
Housing units in structures - Owners - Mobile home (%)
Housing units in structures - Owners - Boat, RV, van, etc. (%)
Housing units in structures - Renters - 1, detached (%)
Housing units in structures - Renters - 1, attached (%)
Housing units in structures - Renters - 2 (%)
Housing units in structures - Renters - 3 or 4 (%)
Housing units in structures - Renters - 5 to 9 (%)
Housing units in structures - Renters - 10 to 19 (%)
Housing units in structures - Renters - 20 to 49 (%)
Housing units in structures - Renters - 50 or more (%)
Housing units in structures - Renters - Mobile home (%)
Housing units in structures - Renters - Boat, RV, van, etc. (%)
House/condo owner moved in on average (years ago)
Renter moved in on average (years ago)
Year householder moved into unit - Moved in 1999 to March 2000 (%)
Year householder moved into unit - Moved in 1999 to March 2000 (%) - White
Year householder moved into unit - Moved in 1999 to March 2000 (%) - Black or African American
Year householder moved into unit - Moved in 1999 to March 2000 (%) - Asian
Year householder moved into unit - Moved in 1999 to March 2000 (%) - Hispanic or Latino
Year householder moved into unit - Moved in 1999 to March 2000 (%) - American Indian and Alaska Native
Year householder moved into unit - Moved in 1999 to March 2000 (%) - Multirace
Year householder moved into unit - Moved in 1999 to March 2000 (%) - Other Race
Year householder moved into unit - Moved in 1995 to 1998 (%)
Year householder moved into unit - Moved in 1995 to 1998 (%) - White
Year householder moved into unit - Moved in 1995 to 1998 (%) - Black or African American
Year householder moved into unit - Moved in 1995 to 1998 (%) - Asian
Year householder moved into unit - Moved in 1995 to 1998 (%) - Hispanic or Latino
Year householder moved into unit - Moved in 1995 to 1998 (%) - American Indian and Alaska Native
Year householder moved into unit - Moved in 1995 to 1998 (%) - Multirace
Year householder moved into unit - Moved in 1995 to 1998 (%) - Other Race
Year householder moved into unit - Moved in 1990 to 1994 (%)
Year householder moved into unit - Moved in 1990 to 1994 (%) - White
Year householder moved into unit - Moved in 1990 to 1994 (%) - Black or African American
Year householder moved into unit - Moved in 1990 to 1994 (%) - Asian
Year householder moved into unit - Moved in 1990 to 1994 (%) - Hispanic or Latino
Year householder moved into unit - Moved in 1990 to 1994 (%) - American Indian and Alaska Native
Year householder moved into unit - Moved in 1990 to 1994 (%) - Multirace
Year householder moved into unit - Moved in 1990 to 1994 (%) - Other Race
Year householder moved into unit - Moved in 1980 to 1989 (%)
Year householder moved into unit - Moved in 1980 to 1989 (%) - White
Year householder moved into unit - Moved in 1980 to 1989 (%) - Black or African American
Year householder moved into unit - Moved in 1980 to 1989 (%) - Asian
Year householder moved into unit - Moved in 1980 to 1989 (%) - Hispanic or Latino
Year householder moved into unit - Moved in 1980 to 1989 (%) - American Indian and Alaska Native
Year householder moved into unit - Moved in 1980 to 1989 (%) - Multirace
Year householder moved into unit - Moved in 1980 to 1989 (%) - Other Race
Year householder moved into unit - Moved in 1970 to 1979 (%)
Year householder moved into unit - Moved in 1970 to 1979 (%) - White
Year householder moved into unit - Moved in 1970 to 1979 (%) - Black or African American
Year householder moved into unit - Moved in 1970 to 1979 (%) - Asian
Year householder moved into unit - Moved in 1970 to 1979 (%) - Hispanic or Latino
Year householder moved into unit - Moved in 1970 to 1979 (%) - American Indian and Alaska Native
Year householder moved into unit - Moved in 1970 to 1979 (%) - Multirace
Year householder moved into unit - Moved in 1970 to 1979 (%) - Other Race
Year householder moved into unit - Moved in 1969 or earlier (%)
Year householder moved into unit - Moved in 1969 or earlier (%) - White
Year householder moved into unit - Moved in 1969 or earlier (%) - Black or African American
Year householder moved into unit - Moved in 1969 or earlier (%) - Asian
Year householder moved into unit - Moved in 1969 or earlier (%) - Hispanic or Latino
Year householder moved into unit - Moved in 1969 or earlier (%) - American Indian and Alaska Native
Year householder moved into unit - Moved in 1969 or earlier (%) - Multirace
Year householder moved into unit - Moved in 1969 or earlier (%) - Other Race
Housing units lacking complete plumbing facilities (%)
Housing units lacking complete kitchen facilities (%)
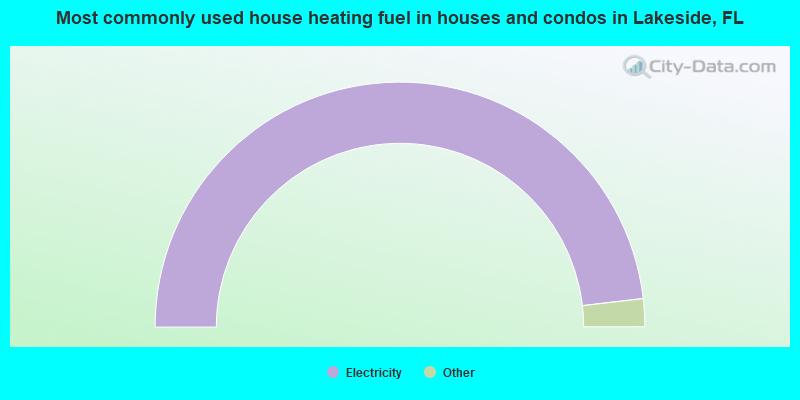
House heating fuel used in houses and condos - Utility gas (%)
House heating fuel used in houses and condos - Bottled, tank, or LP gas (%)
House heating fuel used in houses and condos - Electricity (%)
House heating fuel used in houses and condos - Fuel oil, kerosene, etc. (%)
House heating fuel used in houses and condos - Coal or coke (%)
House heating fuel used in houses and condos - Wood (%)
House heating fuel used in houses and condos - Solar energy (%)
House heating fuel used in houses and condos - Other fuel (%)
House heating fuel used in houses and condos - No fuel used (%)
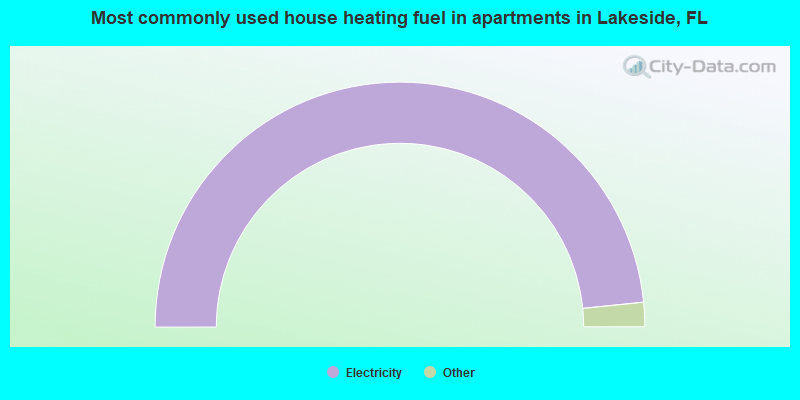
House heating fuel used in apartments - Utility gas (%)
House heating fuel used in apartments - Bottled, tank, or LP gas (%)
House heating fuel used in apartments - Electricity (%)
House heating fuel used in apartments - Fuel oil, kerosene, etc. (%)
House heating fuel used in apartments - Coal or coke (%)
House heating fuel used in apartments - Wood (%)
House heating fuel used in apartments - Solar energy (%)
House heating fuel used in apartments - Other fuel (%)
House heating fuel used in apartments - No fuel used (%)
Latest news about housing in Lakeside, FL collected exclusively by city-data.com from local newspapers, TV, and radio stations
Median year house/condo built: 1983Median year apartment built: 1994Household type by relationship:
Households: 31,951
Male householders: 5,584 (1,304 living alone ), Female householders: 6,436 (1,570 living alone )6,021 spouses (6,000 opposite-sex spouses ), 913 unmarried partners , (804 opposite-sex unmarried partners ), 8,746 children (8,021 natural , 265 adopted , 460 stepchildren ), 1,471 grandchildren , 608 brothers or sisters , 654 parents , 20 foster children , 717 other relatives , 721 non-relatives In group quarters: 55
Size of family households: 3,696 2-persons , 2,558 3-persons , 1,516 4-persons , 575 5-persons , 251 6-persons , 202 7-or-more-persons .
Size of nonfamily households: 3,227 1-person , 438 2-persons , 30 3-persons , 36 4-persons .
3,809 married couples with children. single-parent households (300 men , 872 women ).
89.5% of residents of Lakeside speak English at home. of residents speak Spanish at home (63% speak English very well , 21% speak English well , 16% speak English not well , 1% don't speak English at all ).of residents speak other Indo-European language at home (60% speak English very well , 24% speak English well , 7% speak English not well , 9% don't speak English at all ).of residents speak Asian or Pacific Island language at home (67% speak English very well , 28% speak English well , 4% speak English not well ).of residents speak other language at home (100% speak English very well ).
Foreign born population: 1,876 (5.9%)of them are naturalized citizens )
Median number of rooms in houses and condos:
Median number of rooms in apartments
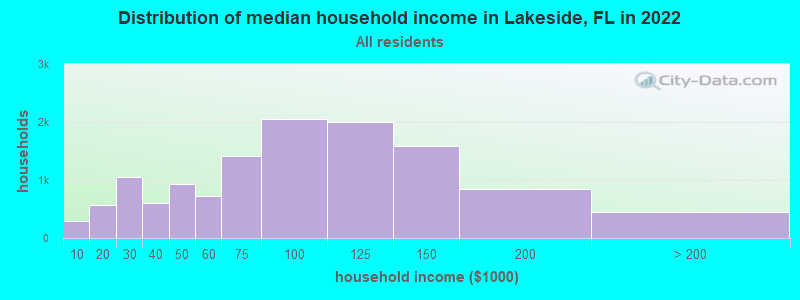
Lakeside, FL household income distribution 295 Less than $10,000573 $10,000 to $19,9991,053 $20,000 to $29,999599 $30,000 to $39,999929 $40,000 to $49,999726 $50,000 to $59,9991,409 $60,000 to $74,9992,044 $75,000 to $99,9992,003 $100,000 to $124,9991,593 $125,000 to $149,999838 $150,000 to $199,999440 $200,000 or more
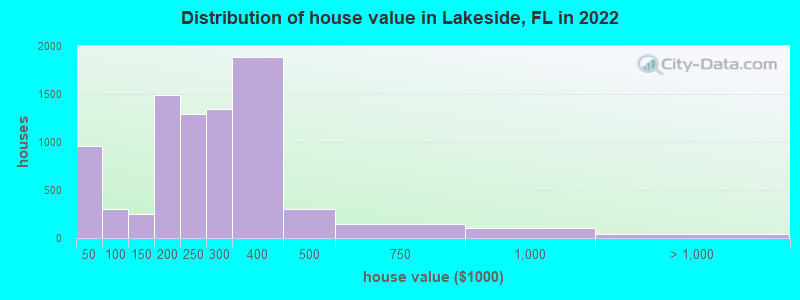
Home value of owner - occupied houses in 2022 in Lakeside, FL 502 Less than $10,00028 $10,000 to $14,99986 $15,000 to $19,99964 $20,000 to $24,99961 $25,000 to $29,999217 $30,000 to $34,99960 $50,000 to $59,99917 $60,000 to $69,999104 $70,000 to $79,999101 $80,000 to $89,99923 $90,000 to $99,999109 $100,000 to $124,999137 $125,000 to $149,999709 $150,000 to $174,999777 $175,000 to $199,9991,291 $200,000 to $249,9991,344 $250,000 to $299,9991,886 $300,000 to $399,999302 $400,000 to $499,999144 $500,000 to $749,999101 $750,000 to $999,99926 $1,000,000 to $1,499,99915 $2,000,000 or moreRent paid by renters in 2022 in Lakeside, FL 23 $150 to $19929 $350 to $39942 $400 to $4495 $450 to $49920 $550 to $599106 $600 to $649104 $650 to $699325 $700 to $74989 $750 to $799222 $800 to $899283 $900 to $999554 $1,000 to $1,249629 $1,250 to $1,499549 $1,500 to $1,999159 $2,000 to $2,499122 No cash rent
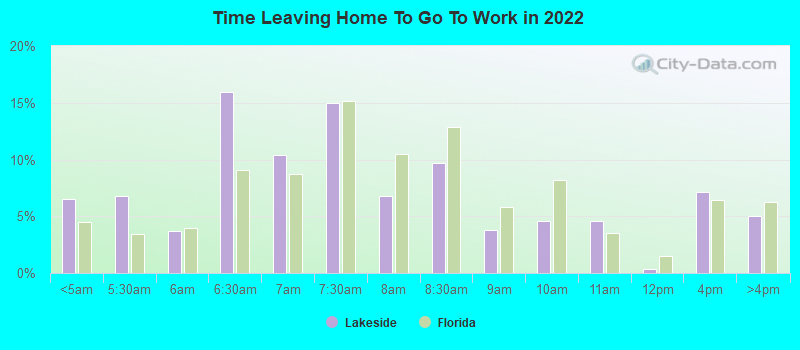
Percentage of workers working in this county: 55.7%Number of people working at home: 2,329 (14.9% of all workers )
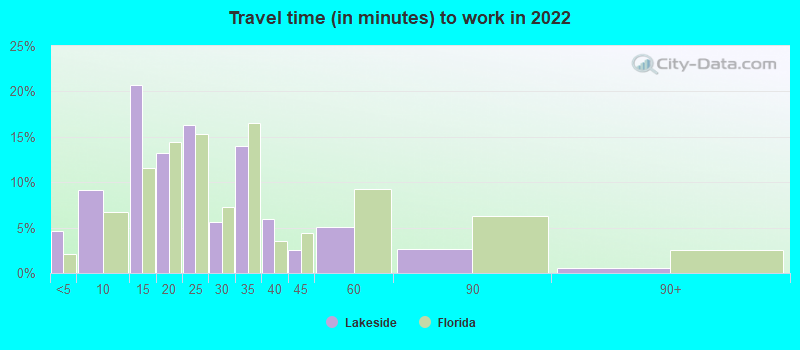
Travel time to work (commute)
Less than 5 minutes: 1915 to 9 minutes: 1,05410 to 14 minutes: 1,71915 to 19 minutes: 1,54420 to 24 minutes: 1,11225 to 29 minutes: 71130 to 34 minutes: 2,81535 to 39 minutes: 84640 to 44 minutes: 82845 to 59 minutes: 1,41260 to 89 minutes: 1,10990 or more minutes: 113
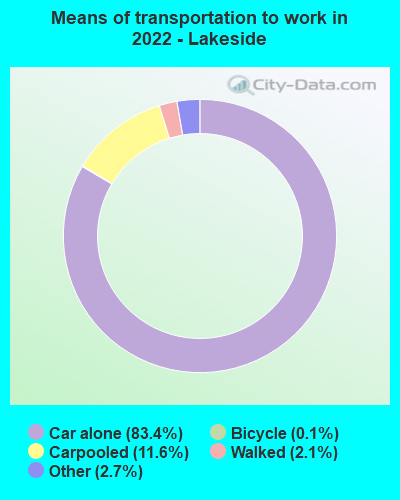
Means of transportation to work:
Drove a car alone: 6,038 (64.2%)Carpooled: 895 (9.5%)Taxi: 219 (2.3%)Bicycle: 8 (0.1%)Walked: 167 (1.8%)Worked at home: 2,329 (24.8%)
Unemployment by race in 2022
Unemployment rate for White non-Hispanic residents 3.2% Males4.0% FemalesUnemployment rate for Black residents 10.5% Males11.1% FemalesUnemployment rate for Asian residents 10.2% MalesUnemployment rate for other race residents 4.9% FemalesUnemployment rate for two or more race residents 12.9% FemalesUnemployment rate for Hispanic or Latino residents 3.8% Males0.9% Females
Year of entry for the foreign-born population in Lakeside, Florida
405 2010 or later 387 2000 to 2009 359 1990 to 1999 538 1980 to 1989 320 1970 to 1979 424 Before 1970
First ancestries reported:
American: 1,654 (11.9%)
English: 1,389 (10.0%)
German: 1,359 (9.8%)
Irish: 739 (5.3%)
European: 351 (2.5%)
Italian: 320 (2.3%)
Haitian: 254 (1.8%)
Scottish: 252 (1.8%)
French: 232 (1.7%)
Polish: 198 (1.4%)
Palestinian: 154 (1.1%)
British: 103 (0.7%)
West Indian: 100 (0.7%)
U.S. Virgin Islander: 92 (0.7%)
Scotch-Irish: 82 (0.6%)
Turkish: 79 (0.6%)
Trinidadian and Tobagonian: 75 (0.5%)
Greek: 74 (0.5%)
African: 67 (0.5%)
Brazilian: 66 (0.5%)
Portuguese: 43 (0.3%)
Norwegian: 42 (0.3%)
Arab: 39 (0.3%)
Northern European: 39 (0.3%)
Scandinavian: 39 (0.3%)
Swedish: 34 (0.2%)
Czech: 32 (0.2%)
Lebanese: 29 (0.2%)
Cajun: 29 (0.2%)
Ukrainian: 23 (0.2%)
French Canadian: 20 (0.1%)
Jamaican: 18 (0.1%)
Moroccan: 15 (0.1%)
Austrian: 15 (0.1%)
Russian: 8 (0.06%)
Dutch: 6 (0.04%) Most common places of birth for foreign-born residents (%): Guatemala Lakeside:
12.5% (240)Florida:
2.1% (97,632)
Mexico Lakeside:
9.4% (180)Florida:
5.6% (257,152)
Philippines Lakeside:
7.3% (140)Florida:
1.8% (84,403)
Nicaragua Lakeside:
6.7% (129)Florida:
2.3% (105,066)
Cuba Lakeside:
5.7% (110)Florida:
22.0% (1,006,576)
Haiti Lakeside:
4.7% (90)Florida:
7.5% (342,375)
El Salvador Lakeside:
4.6% (89)Florida:
1.1% (49,838)
Spain Lakeside:
4.0% (77)Florida:
0.5% (21,571)
Turkey Lakeside:
3.9% (75)Florida:
0.2% (10,969)
Brazil Lakeside:
3.8% (73)Florida:
2.7% (122,906)
Colombia Lakeside:
3.3% (64)Florida:
6.5% (298,669)
Jamaica Lakeside:
2.9% (56)Florida:
5.0% (227,319)
Germany Lakeside:
2.3% (45)Florida:
1.2% (54,272)
Asia, n.e.c. Lakeside:
2.2% (43)Florida:
0.1% (4,197)
Poland Lakeside:
2.2% (42)Florida:
0.6% (25,219)
Canada Lakeside:
2.2% (42)Florida:
2.4% (109,132)
Trinidad and Tobago Lakeside:
1.9% (36)Florida:
1.0% (43,642)
Belize Lakeside:
1.6% (31)Florida:
0.1% (4,021)
Morocco Lakeside:
1.6% (30)Florida:
0.2% (9,164)
Argentina Lakeside:
1.6% (30)Florida:
1.3% (57,263)
Place of birth for U.S.-born residents:
This state: 12,926Other state: 15,871Northeast: 4,197Midwest: 2,523South: 7,285West: 1,860 92.2% of Lakeside residents lived in the same house 1 years ago.
Out of people who lived in different houses, 28.3% lived in this county.
Out of people who lived in different counties, 67.0% lived in Florida.
Lakeside:
92.2%State average:
86.3%
Education attainment for males 25 years and older:
No schooling: 113Nursery to 4th grade: 05th and 6th grade: 107th and 8th grade: 249th grade: 12010th grade: 4411th grade: 6112th grade, no diploma: 166High school graduate (or equivalency): 3,154Less than 1 year of college: 1,642Some college more than 1 year, no degree: 1,589Associate degree: 1,283Bachelor's degree: 1,541Master's degree: 552Professional school degree: 44Doctorate degree: 333
Education attainment for females 25 years and older:
No schooling: 223Nursery to 4th grade: 135th and 6th grade: 337th and 8th grade: 1309th grade: 4110th grade: 13611th grade: 25912th grade, no diploma: 109High school graduate (or equivalency): 4,355Less than 1 year of college: 1,597Some college more than 1 year, no degree: 1,597Associate degree: 1,210Bachelor's degree: 1,738Master's degree: 814Professional school degree: 78Doctorate degree: 59
Housing units in structures:
One, detached: 9,894One, attached: 518Two: 1253 or 4: 6325 to 9: 34910 to 19: 9820 to 49: 24050 or more: 28Mobile homes: 879Median worth of mobile homes: $213,601
Housing units lacking complete plumbing facilities in 2022: 0.6%Housing units lacking complete kitchen facilities in 2022: 0.5%House/condo owner moved in on average 15 years ago
Renter moved in on average 3 years ago
Private vs. public school enrollment:
Students in private schools in grades 1 to 8 (elementary and middle school): 155 Students in private schools in grades 9 to 12 (high school): 149 Students in private undergraduate colleges: 226