Lake Mary, FL (Florida) Houses and Residents
Estimated median house or condo value in 2022: $473,696 (it was $175,200 in 2000 )
Lake Mary:
$473,696Florida:
$354,100
Lower value quartile - upper value quartile: $373,802 - $656,510Mean price in 2022: Detached houses: $509,378 Here:
$509,378State:
$500,941
Townhouses or other attached units: $418,133 Here:
$418,133State:
$370,869
Mobile homes: $166,941 Here:
$166,941State:
$113,202
Total population: 15,801 (Urban population: 11,289, Rural population: 0)
Houses: 7,321 (6,720 occupied: 4,624 owner occupied, 2,146 renter occupied )
% of renters here:
32%State:
33%
Housing density: 850 houses/condos per square mile
Median price asked for vacant for-sale houses and condos in 2022: $1,290,095.
Median contract rent in 2022: $1,844 (lower quartile is $1,572, upper quartile is over $2,000)
Median rent asked for vacant for-rent units in 2022: $1,860
Median gross rent in Lake Mary, FL in 2022: over $2,000
Housing units in Lake Mary with a mortgage: 3,184 (350 second mortgage, 18 home equity loan, 201 both second mortgage and home equity loan )Houses without a mortgage: 50
Median household income for houses/condos with a mortgage: $141,235
Median household income for apartments without a mortgage: $83,653
Median monthly housing costs: $1,905
Data:
Median house or condo value ($)
Median house or condo value ($ change since 2000)
Median house or condo value ($) - White
Median house or condo value ($) - Black or African American
Median house or condo value ($) - Asian
Median house or condo value ($) - Hispanic or Latino
Median house or condo value ($) - American Indian and Alaska Native
Median house or condo value ($) - Multirace
Median house or condo value ($) - Other Race
Median price asked for mobile homes ($)
Household density (households per square mile)
Mean house or condo value by units in structure - 1, detached ($)
Mean house or condo value by units in structure - 1, attached ($)
Mean house or condo value by units in structure - 2 ($)
Mean house or condo value by units in structure by units in structure - 3 or 4 ($)
Mean house or condo value by units in structure - 5 or more ($)
Mean house or condo value by units in structure - Boat, RV, van, etc. ($)
Mean house or condo value by units in structure - Mobile home ($)
Median contract rent ($)
Median contract rent - Lower quartile ($)
Median contract rent - Upper quartile ($)
Median gross rent ($)
Urban houses (%)
Rural houses (%)
Houses occupied (%)
Houses occupied (% change since 2000)
Houses owner occupied (%)
Houses owner occupied (% change since 2000)
Houses renter occupied (%)
Houses renter occupied (% change since 2000)
Vacant housing units - For rent (%)
Vacant housing units - For rent (% change since 2000)
Vacant housing units - For sale only (%)
Vacant housing units - For sale only (% change since 2000)
Vacant housing units - Rented or sold, not occupied (%)
Vacant housing units - Rented or sold, not occupied (% change since 2000)
Vacant housing units - For seasonal, recreational, or occasional use (%)
Vacant housing units - For seasonal, recreational, or occasional use (% change since 2000)
Vacant housing units - For migrant workers (%)
Vacant housing units - For migrant workers (% change since 2000)
Vacant housing units - Other vacant (%)
Vacant housing units - Other vacant (% change since 2000)
Median monthly housing costs ($)
Median household income for houses/condos with a mortgage ($)
Median household income for houses/condos without a mortgage ($)
Median household income ($)
Median household income ($) - White
Median household income ($) - Black or African American
Median household income ($) - Asian
Median household income ($) - Hispanic or Latino
Median household income ($) - American Indian and Alaska Native
Median household income ($) - Multirace
Median household income ($) - Other Race
Mortgage status - with mortgage (%)
Mortgage status - with second mortgage (%)
Mortgage status - with home equity loan (%)
Mortgage status - with both second mortgage and home equity loan (%)
Mortgage status - without a mortgage (%)
Median year house/condo built
Median year apartment built
Household type by relationship - Male householder living alone (%)
Household type by relationship - Male householder not living alone (%)
Household type by relationship - Female householder living alone (%)
Household type by relationship - Female householder not living alone (%)
Household type by relationship - Opposite-Sex spouse (%)
Household type by relationship - Same-Sex spouse (%)
Household type by relationship - Opposite-Sex unmarried partner (%)
Household type by relationship - Same-Sex unmarried partner (%)
Household type by relationship - In group quarters (%)
Size of family households - 2-person household (%)
Size of family households - 3-person household (%)
Size of family households - 4-person household (%)
Size of family households - 5-person household (%)
Size of family households - 6-person household (%)
Size of family households - 7-or-more-person household (%)
Size of nonfamily households - 1-person household (%)
Size of nonfamily households - 2-person household (%)
Size of nonfamily households - 3-person household (%)
Size of nonfamily households - 4-person household (%)
Size of nonfamily households - 5-person household (%)
Size of nonfamily households - 6-person household (%)
Size of nonfamily households - 7-or-moreperson household (%)
Year house built - Built 2010 or later (%)
Year house built - Built 2000 to 2009 (%)
Year house built - Built 1990 to 1999 (%)
Year house built - Built 1980 to 1989 (%)
Year house built - Built 1970 to 1979 (%)
Year house built - Built 1960 to 1969 (%)
Year house built - Built 1950 to 1959 (%)
Year house built - Built 1940 to 1949 (%)
Year house built - Built 1939 or earlier (%)
Median number of rooms in houses and condos
Median number of rooms in apartments
Median number of bedrooms in owner occupied houses
Mean number of bedrooms in owner occupied houses
Median number of bedrooms in renter occupied houses
Mean number of bedrooms in renter occupied houses
Median number of vehichles in owner occupied houses
Mean number of vehichles in owner occupied houses
Median number of vehichles in renter occupied houses
Mean number of vehichles in renter occupied houses
Rooms in owner-occupied houses - 1 room (%)
Rooms in owner-occupied houses - 2 rooms (%)
Rooms in owner-occupied houses - 3 rooms (%)
Rooms in owner-occupied houses - 4 rooms (%)
Rooms in owner-occupied houses - 5 rooms (%)
Rooms in owner-occupied houses - 6 rooms (%)
Rooms in owner-occupied houses - 7 rooms (%)
Rooms in owner-occupied houses - 8 rooms (%)
Rooms in owner-occupied houses - 9+ rooms (%)
Rooms in renter-occupied houses - 1 room (%)
Rooms in renter-occupied houses - 2 rooms (%)
Rooms in renter-occupied houses - 3 rooms (%)
Rooms in renter-occupied houses - 4 rooms (%)
Rooms in renter-occupied houses - 5 rooms (%)
Rooms in renter-occupied houses - 6 rooms (%)
Rooms in renter-occupied houses - 7 rooms (%)
Rooms in renter-occupied houses - 8 rooms (%)
Rooms in renter-occupied houses - 9+ rooms (%)
Bedrooms in owner-occupied houses - no bedrooms (%)
Bedrooms in owner-occupied houses - 1 bedroom (%)
Bedrooms in owner-occupied houses - 2 bedrooms (%)
Bedrooms in owner-occupied houses - 3 bedrooms (%)
Bedrooms in owner-occupied houses - 4 bedrooms (%)
Bedrooms in owner-occupied houses - 5+ bedrooms (%)
Bedrooms in renter-occupied houses - no bedrooms (%)
Bedrooms in renter-occupied houses - 1 bedroom (%)
Bedrooms in renter-occupied houses - 2 bedrooms (%)
Bedrooms in renter-occupied houses - 3 bedrooms (%)
Bedrooms in renter-occupied houses - 4 bedrooms (%)
Bedrooms in renter-occupied houses - 5+ bedrooms (%)
Vehicles available in owner-occupied houses - no vehicle available (%)
Vehicles available in owner-occupied houses - 1 vehicle available(%)
Vehicles available in owner-occupied houses - 2 Vehicles available (%)
Vehicles available in owner-occupied houses - 3 Vehicles available (%)
Vehicles available in owner-occupied houses - 4 Vehicles available (%)
Vehicles available in owner-occupied houses - 5+ Vehicles available (%)
Vehicles available in renter-occupied houses - no vehicle available (%)
Vehicles available in renter-occupied houses - 1 vehicle available (%)
Vehicles available in renter-occupied houses - 2 Vehicles available (%)
Vehicles available in renter-occupied houses - 3 Vehicles available (%)
Vehicles available in renter-occupied houses - 4 Vehicles available (%)
Vehicles available in renter-occupied houses - 5+ Vehicles available (%)
Housing units in structures - 1, detached (%)
Housing units in structures - 1, attached (%)
Housing units in structures - 2 (%)
Housing units in structures - 3 or 4 (%)
Housing units in structures - 5 to 9 (%)
Housing units in structures - 10 to 19 (%)
Housing units in structures - 20 to 49 (%)
Housing units in structures - 50 or more (%)
Housing units in structures - Mobile home (%)
Housing units in structures - Boat, RV, van, etc. (%)
Housing units in structures - Owners - 1, detached (%)
Housing units in structures - Owners - 1, attached (%)
Housing units in structures - Owners - 2 (%)
Housing units in structures - Owners - 3 or 4 (%)
Housing units in structures - Owners - 5 to 9 (%)
Housing units in structures - Owners - 10 to 19 (%)
Housing units in structures - Owners - 20 to 49 (%)
Housing units in structures - Owners - 50 or more (%)
Housing units in structures - Owners - Mobile home (%)
Housing units in structures - Owners - Boat, RV, van, etc. (%)
Housing units in structures - Renters - 1, detached (%)
Housing units in structures - Renters - 1, attached (%)
Housing units in structures - Renters - 2 (%)
Housing units in structures - Renters - 3 or 4 (%)
Housing units in structures - Renters - 5 to 9 (%)
Housing units in structures - Renters - 10 to 19 (%)
Housing units in structures - Renters - 20 to 49 (%)
Housing units in structures - Renters - 50 or more (%)
Housing units in structures - Renters - Mobile home (%)
Housing units in structures - Renters - Boat, RV, van, etc. (%)
House/condo owner moved in on average (years ago)
Renter moved in on average (years ago)
Year householder moved into unit - Moved in 1999 to March 2000 (%)
Year householder moved into unit - Moved in 1999 to March 2000 (%) - White
Year householder moved into unit - Moved in 1999 to March 2000 (%) - Black or African American
Year householder moved into unit - Moved in 1999 to March 2000 (%) - Asian
Year householder moved into unit - Moved in 1999 to March 2000 (%) - Hispanic or Latino
Year householder moved into unit - Moved in 1999 to March 2000 (%) - American Indian and Alaska Native
Year householder moved into unit - Moved in 1999 to March 2000 (%) - Multirace
Year householder moved into unit - Moved in 1999 to March 2000 (%) - Other Race
Year householder moved into unit - Moved in 1995 to 1998 (%)
Year householder moved into unit - Moved in 1995 to 1998 (%) - White
Year householder moved into unit - Moved in 1995 to 1998 (%) - Black or African American
Year householder moved into unit - Moved in 1995 to 1998 (%) - Asian
Year householder moved into unit - Moved in 1995 to 1998 (%) - Hispanic or Latino
Year householder moved into unit - Moved in 1995 to 1998 (%) - American Indian and Alaska Native
Year householder moved into unit - Moved in 1995 to 1998 (%) - Multirace
Year householder moved into unit - Moved in 1995 to 1998 (%) - Other Race
Year householder moved into unit - Moved in 1990 to 1994 (%)
Year householder moved into unit - Moved in 1990 to 1994 (%) - White
Year householder moved into unit - Moved in 1990 to 1994 (%) - Black or African American
Year householder moved into unit - Moved in 1990 to 1994 (%) - Asian
Year householder moved into unit - Moved in 1990 to 1994 (%) - Hispanic or Latino
Year householder moved into unit - Moved in 1990 to 1994 (%) - American Indian and Alaska Native
Year householder moved into unit - Moved in 1990 to 1994 (%) - Multirace
Year householder moved into unit - Moved in 1990 to 1994 (%) - Other Race
Year householder moved into unit - Moved in 1980 to 1989 (%)
Year householder moved into unit - Moved in 1980 to 1989 (%) - White
Year householder moved into unit - Moved in 1980 to 1989 (%) - Black or African American
Year householder moved into unit - Moved in 1980 to 1989 (%) - Asian
Year householder moved into unit - Moved in 1980 to 1989 (%) - Hispanic or Latino
Year householder moved into unit - Moved in 1980 to 1989 (%) - American Indian and Alaska Native
Year householder moved into unit - Moved in 1980 to 1989 (%) - Multirace
Year householder moved into unit - Moved in 1980 to 1989 (%) - Other Race
Year householder moved into unit - Moved in 1970 to 1979 (%)
Year householder moved into unit - Moved in 1970 to 1979 (%) - White
Year householder moved into unit - Moved in 1970 to 1979 (%) - Black or African American
Year householder moved into unit - Moved in 1970 to 1979 (%) - Asian
Year householder moved into unit - Moved in 1970 to 1979 (%) - Hispanic or Latino
Year householder moved into unit - Moved in 1970 to 1979 (%) - American Indian and Alaska Native
Year householder moved into unit - Moved in 1970 to 1979 (%) - Multirace
Year householder moved into unit - Moved in 1970 to 1979 (%) - Other Race
Year householder moved into unit - Moved in 1969 or earlier (%)
Year householder moved into unit - Moved in 1969 or earlier (%) - White
Year householder moved into unit - Moved in 1969 or earlier (%) - Black or African American
Year householder moved into unit - Moved in 1969 or earlier (%) - Asian
Year householder moved into unit - Moved in 1969 or earlier (%) - Hispanic or Latino
Year householder moved into unit - Moved in 1969 or earlier (%) - American Indian and Alaska Native
Year householder moved into unit - Moved in 1969 or earlier (%) - Multirace
Year householder moved into unit - Moved in 1969 or earlier (%) - Other Race
Housing units lacking complete plumbing facilities (%)
Housing units lacking complete kitchen facilities (%)
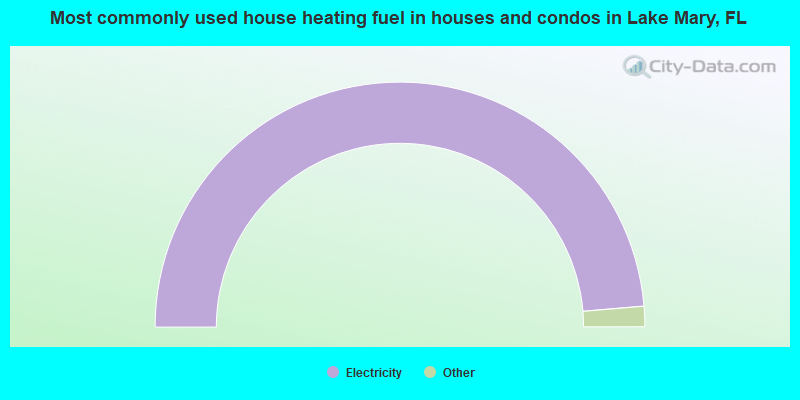
House heating fuel used in houses and condos - Utility gas (%)
House heating fuel used in houses and condos - Bottled, tank, or LP gas (%)
House heating fuel used in houses and condos - Electricity (%)
House heating fuel used in houses and condos - Fuel oil, kerosene, etc. (%)
House heating fuel used in houses and condos - Coal or coke (%)
House heating fuel used in houses and condos - Wood (%)
House heating fuel used in houses and condos - Solar energy (%)
House heating fuel used in houses and condos - Other fuel (%)
House heating fuel used in houses and condos - No fuel used (%)
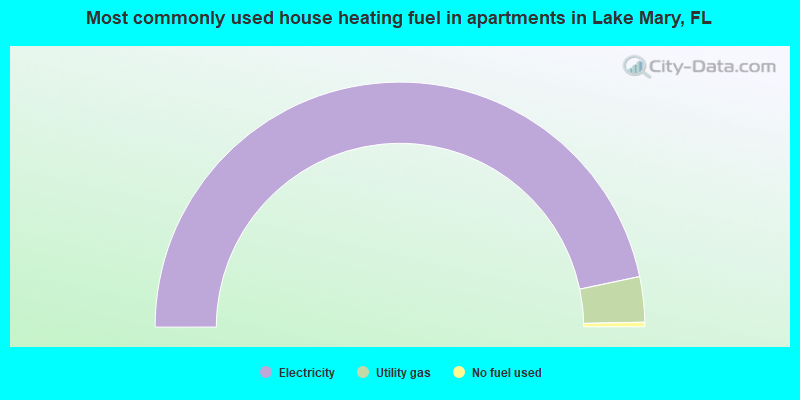
House heating fuel used in apartments - Utility gas (%)
House heating fuel used in apartments - Bottled, tank, or LP gas (%)
House heating fuel used in apartments - Electricity (%)
House heating fuel used in apartments - Fuel oil, kerosene, etc. (%)
House heating fuel used in apartments - Coal or coke (%)
House heating fuel used in apartments - Wood (%)
House heating fuel used in apartments - Solar energy (%)
House heating fuel used in apartments - Other fuel (%)
House heating fuel used in apartments - No fuel used (%)
Median year house/condo built: 1994Median year apartment built: 2008Household type by relationship:
Households: 16,898
Male householders: 3,318 (575 living alone ), Female householders: 3,342 (877 living alone )3,769 spouses (3,761 opposite-sex spouses ), 285 unmarried partners , (271 opposite-sex unmarried partners ), 4,864 children (4,684 natural , 55 adopted , 123 stepchildren ), 39 grandchildren , 82 brothers or sisters , 543 parents , 0 foster children , 31 other relatives , 335 non-relatives In group quarters: 286
Size of family households: 2,349 2-persons , 1,130 3-persons , 787 4-persons , 330 5-persons , 240 6-persons , 14 7-or-more-persons .
Size of nonfamily households: 1,435 1-person , 352 2-persons , 82 3-persons , 19 4-persons .
2,448 married couples with children. single-parent households (36 men , 781 women ).
80.8% of residents of Lake Mary speak English at home. of residents speak Spanish at home (83% speak English very well , 6% speak English well , 11% speak English not well ).of residents speak other Indo-European language at home (82% speak English very well , 16% speak English well , 2% speak English not well ).of residents speak Asian or Pacific Island language at home (83% speak English very well , 12% speak English well , 5% speak English not well ).of residents speak other language at home (62% speak English very well , 38% speak English well ).
Foreign born population: 2,995 (17.7%)of them are naturalized citizens )
Median number of rooms in houses and condos:
Median number of rooms in apartments
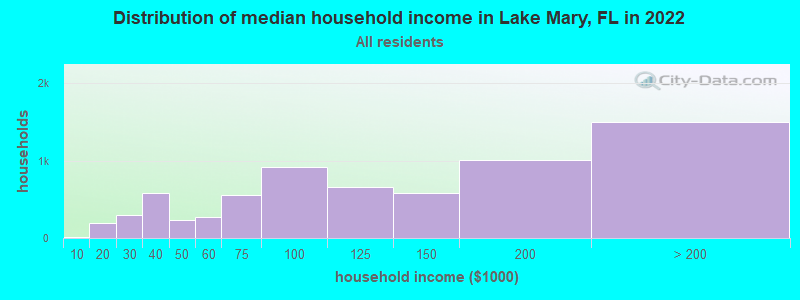
Lake Mary, FL household income distribution 16 Less than $10,000195 $10,000 to $19,999296 $20,000 to $29,999577 $30,000 to $39,999227 $40,000 to $49,999273 $50,000 to $59,999555 $60,000 to $74,999914 $75,000 to $99,999657 $100,000 to $124,999587 $125,000 to $149,9991,008 $150,000 to $199,9991,498 $200,000 or more
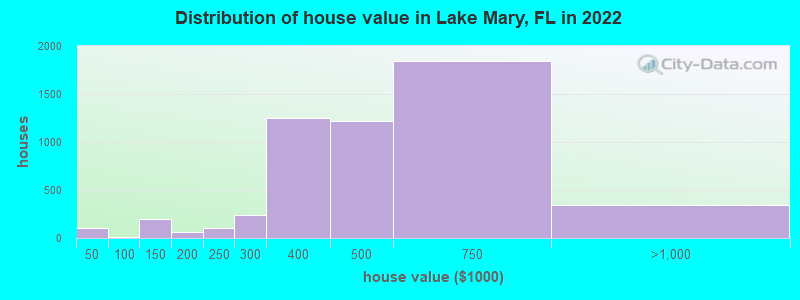
Home value of owner - occupied houses in 2022 in Lake Mary, FL 27 Less than $10,00019 $10,000 to $14,99951 $25,000 to $29,9999 $90,000 to $99,999123 $100,000 to $124,99973 $125,000 to $149,99940 $150,000 to $174,99918 $175,000 to $199,99999 $200,000 to $249,999243 $250,000 to $299,9991,248 $300,000 to $399,9991,215 $400,000 to $499,9991,847 $500,000 to $749,999347 $750,000 to $999,999Rent paid by renters in 2022 in Lake Mary, FL 20 $700 to $7497 $900 to $999110 $1,000 to $1,249430 $1,250 to $1,4991,222 $1,500 to $1,999431 $2,000 to $2,499371 $2,500 to $2,9997 $3,000 to $3,49958 $3,500 or more
Percentage of workers working in this county: 78.1%Number of people working at home: 2,534 (27.4% of all workers )
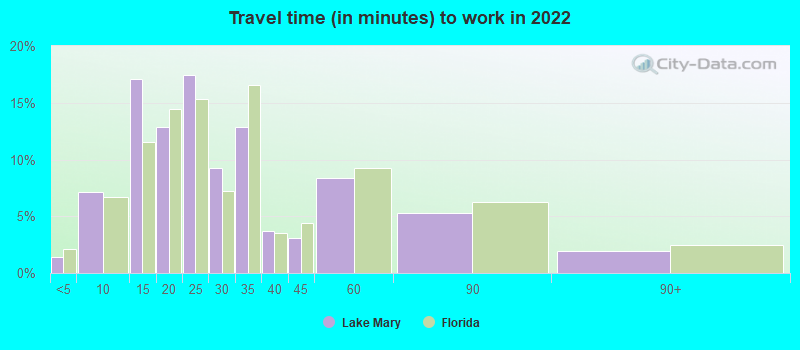
Travel time to work (commute)
Less than 5 minutes: 1905 to 9 minutes: 68810 to 14 minutes: 1,35115 to 19 minutes: 1,19520 to 24 minutes: 75625 to 29 minutes: 50230 to 34 minutes: 95235 to 39 minutes: 29040 to 44 minutes: 26245 to 59 minutes: 33160 to 89 minutes: 16290 or more minutes: 130
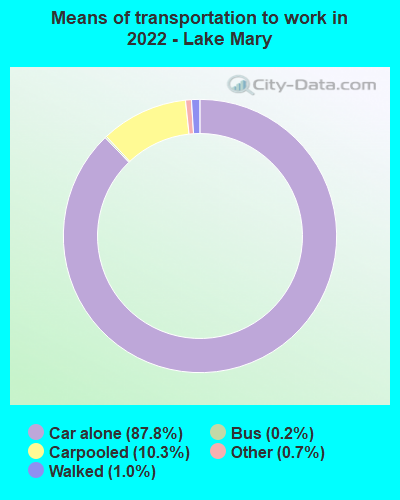
Means of transportation to work:
Drove a car alone: 17,774 (72.8%)Carpooled: 2,634 (10.8%)Bus : 35 (0.1%)Taxi: 162 (0.7%)Bicycle: 9 (0.0%)Walked: 198 (0.8%)Worked at home: 2,534 (10.4%)
Unemployment by race in 2022
Unemployment rate for White non-Hispanic residents 1.9% Males0.3% FemalesUnemployment rate for Black residents 0.8% FemalesUnemployment rate for Asian residents 5.9% FemalesUnemployment rate for other race residents 7.4% FemalesUnemployment rate for two or more race residents 6.2% MalesUnemployment rate for Hispanic or Latino residents 0.9% Females
Year of entry for the foreign-born population in Lake Mary, Florida
1,227 2010 or later 643 2000 to 2009 417 1990 to 1999 108 1980 to 1989 180 1970 to 1979 247 Before 1970
First ancestries reported:
American: 2,485 (23.6%)
English: 902 (8.6%)
German: 561 (5.3%)
Italian: 474 (4.5%)
Irish: 377 (3.6%)
Portuguese: 295 (2.8%)
Polish: 216 (2.1%)
Trinidadian and Tobagonian: 185 (1.8%)
Russian: 121 (1.1%)
African: 108 (1.0%)
French: 104 (1.0%)
Iranian: 92 (0.9%)
European: 91 (0.9%)
Danish: 83 (0.8%)
Canadian: 82 (0.8%)
Croatian: 81 (0.8%)
Brazilian: 72 (0.7%)
Eastern European: 58 (0.6%)
Jamaican: 56 (0.5%)
Ukrainian: 45 (0.4%)
U.S. Virgin Islander: 44 (0.4%)
Scottish: 42 (0.4%)
Haitian: 40 (0.4%)
Egyptian: 35 (0.3%)
Dutch: 33 (0.3%)
Northern European: 16 (0.2%)
Czech: 15 (0.1%)
Israeli: 15 (0.1%)
Swedish: 15 (0.1%)
French Canadian: 14 (0.1%)
Norwegian: 14 (0.1%)
Guyanese: 13 (0.1%)
Nigerian: 13 (0.1%)
Czechoslovakian: 9 (0.09%)
British: 8 (0.08%)
Austrian: 7 (0.07%) Most common places of birth for foreign-born residents (%): India Lake Mary:
20.3% (588)Florida:
2.1% (94,349)
Colombia Lake Mary:
8.6% (250)Florida:
6.5% (298,669)
Venezuela Lake Mary:
6.3% (183)Florida:
5.7% (262,042)
Canada Lake Mary:
4.8% (140)Florida:
2.4% (109,132)
Brazil Lake Mary:
4.7% (136)Florida:
2.7% (122,906)
Vietnam Lake Mary:
4.3% (125)Florida:
1.3% (60,604)
Trinidad and Tobago Lake Mary:
4.3% (125)Florida:
1.0% (43,642)
England Lake Mary:
4.0% (115)Florida:
0.8% (37,723)
Jamaica Lake Mary:
3.2% (94)Florida:
5.0% (227,319)
Russia Lake Mary:
2.6% (76)Florida:
0.7% (31,076)
Dominican Republic Lake Mary:
2.6% (76)Florida:
3.0% (137,727)
Peru Lake Mary:
2.1% (62)Florida:
2.1% (96,693)
Iran Lake Mary:
2.0% (58)Florida:
0.2% (11,000)
Guyana Lake Mary:
2.0% (57)Florida:
0.7% (33,556)
Grenada Lake Mary:
1.9% (56)Florida:
0.1% (3,183)
Belarus Lake Mary:
1.9% (55)Florida:
0.1% (3,802)
Other South Central Asia Lake Mary:
1.9% (54)Florida:
0.0% (1,522)
Thailand Lake Mary:
1.8% (52)Florida:
0.3% (12,303)
Philippines Lake Mary:
1.8% (52)Florida:
1.8% (84,403)
Ireland Lake Mary:
1.7% (48)Florida:
0.2% (9,421)
Ukraine Lake Mary:
1.7% (48)Florida:
0.5% (21,886)
Place of birth for U.S.-born residents:
This state: 5,123Other state: 8,216Northeast: 3,780Midwest: 1,677South: 1,965West: 784 80.9% of Lake Mary residents lived in the same house 1 years ago.
Out of people who lived in different houses, 29.9% lived in this county.
Out of people who lived in different counties, 30.5% lived in Florida.
Lake Mary:
80.9%State average:
86.3%
Education attainment for males 25 years and older:
No schooling: 52Nursery to 4th grade: 05th and 6th grade: 567th and 8th grade: 579th grade: 010th grade: 711th grade: 2612th grade, no diploma: 0High school graduate (or equivalency): 894Less than 1 year of college: 187Some college more than 1 year, no degree: 460Associate degree: 641Bachelor's degree: 1,943Master's degree: 553Professional school degree: 255Doctorate degree: 233
Education attainment for females 25 years and older:
No schooling: 80Nursery to 4th grade: 05th and 6th grade: 07th and 8th grade: 1359th grade: 010th grade: 2611th grade: 012th grade, no diploma: 132High school graduate (or equivalency): 1,244Less than 1 year of college: 660Some college more than 1 year, no degree: 432Associate degree: 965Bachelor's degree: 2,165Master's degree: 1,053Professional school degree: 178Doctorate degree: 52
Housing units in structures:
One, detached: 4,513One, attached: 677Two: 1853 or 4: 2265 to 9: 36510 to 19: 23320 to 49: 2350 or more: 727Mobile homes: 367Median worth of mobile homes: $216,607
Housing units lacking complete plumbing facilities in 2022: 0.3%Housing units lacking complete kitchen facilities in 2022: 0.5%House/condo owner moved in on average 9 years ago
Renter moved in on average 1 years ago
Private vs. public school enrollment:
Students in private schools in grades 1 to 8 (elementary and middle school): 206 Students in private schools in grades 9 to 12 (high school): 133 Students in private undergraduate colleges: 159