Housing density: 817 houses/condos per square mile
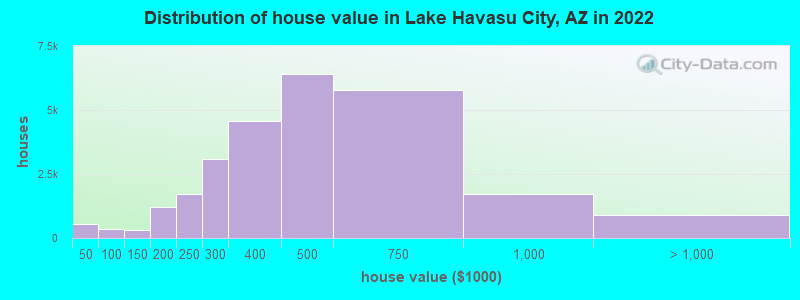
Median price asked for vacant for-sale houses and condos in 2022: $180,664.
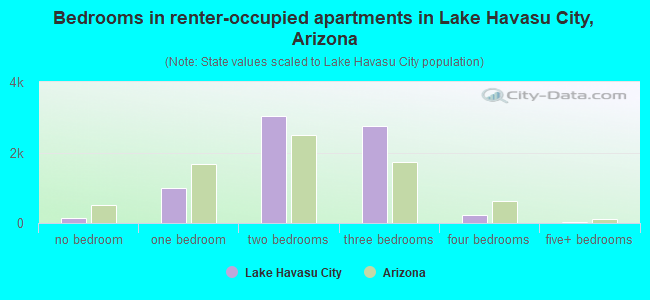
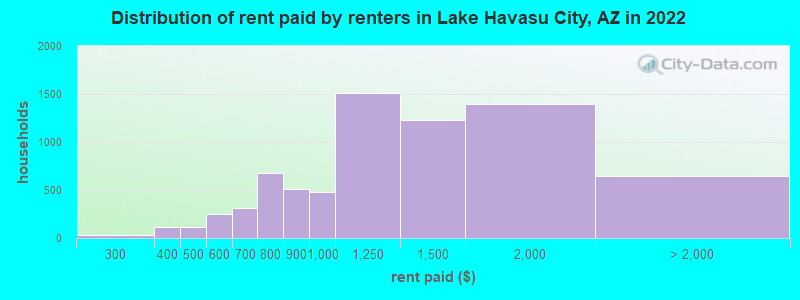
Median contract rent in 2022: $1,069 (lower quartile is $817, upper quartile is $1,487)
Median rent asked for vacant for-rent units in 2022: $2,412
Median gross rent in Lake Havasu City, AZ in 2022: $1,273
Housing units in Lake Havasu City with a mortgage: 12,374 (602 second mortgage, 54 home equity loan, 465 both second mortgage and home equity loan) Houses without a mortgage: 177
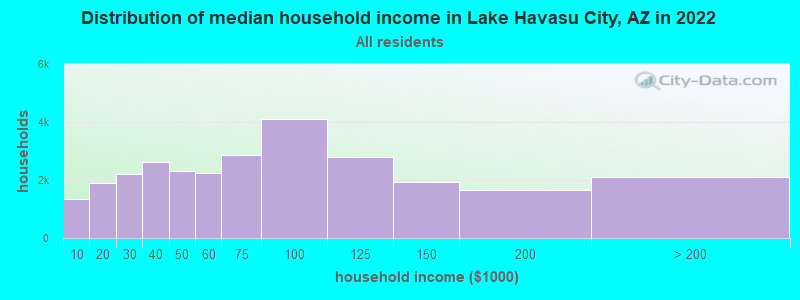
Median household income for houses/condos with a mortgage: $85,645
Median household income for apartments without a mortgage: $57,453
Median monthly housing costs: $1,125
Compare current foreclosures in Lake Havasu City, AZ:
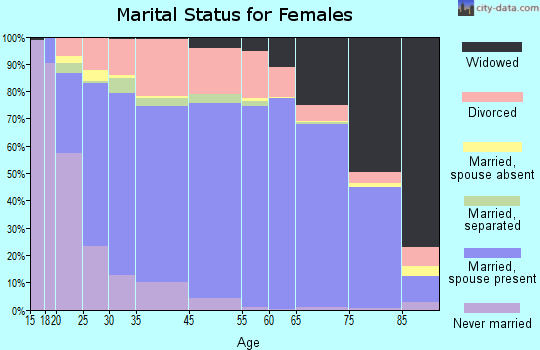
5,503 married couples with children.
2,488 single-parent households (1,088 men, 1,400 women).
91.5% of residents of Lake Havasu City speak English at home.
7.4% of residents speak Spanish at home (74% speak English very well, 12% speak English well, 10% speak English not well, 4% don't speak English at all).
1.0% of residents speak other Indo-European language at home (85% speak English very well, 11% speak English well, 4% speak English not well).
0.5% of residents speak Asian or Pacific Island language at home (42% speak English very well, 39% speak English well, 19% speak English not well).
0.4% of residents speak other language at home (70% speak English very well, 19% speak English well, 11% speak English not well).
Foreign born population: 3,358 (5.7%)
(68.9% of them are naturalized citizens)
Percentage of workers working in this county: 92.6% Number of people working at home: 2,563 (11.6% of all workers)
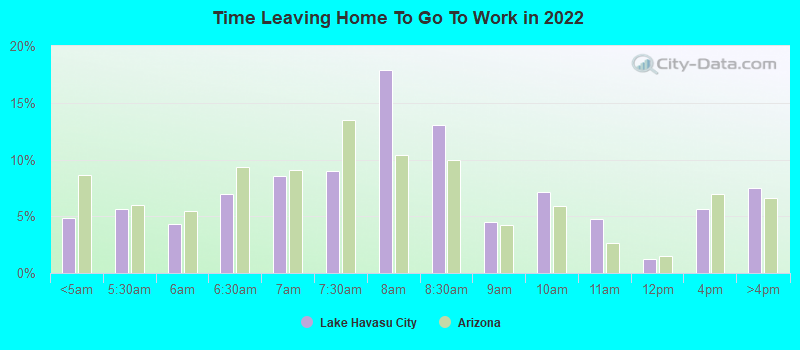
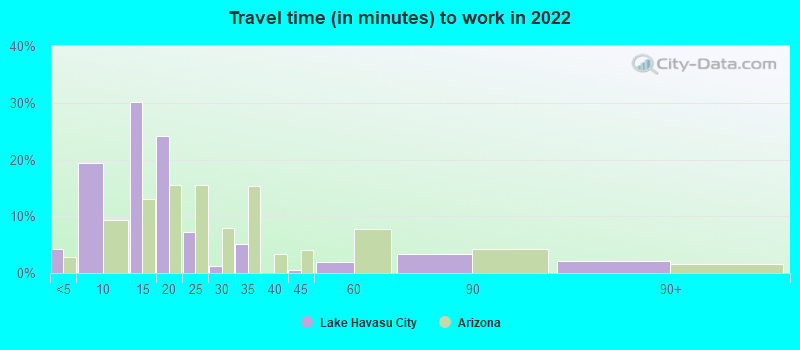
Travel time to work (commute)
Less than 5 minutes: 799
5 to 9 minutes: 3,361
10 to 14 minutes: 6,041
15 to 19 minutes: 4,389
20 to 24 minutes: 1,250
25 to 29 minutes: 330
30 to 34 minutes: 1,068
35 to 39 minutes: 84
40 to 44 minutes: 67
45 to 59 minutes: 831
60 to 89 minutes: 884
90 or more minutes: 152
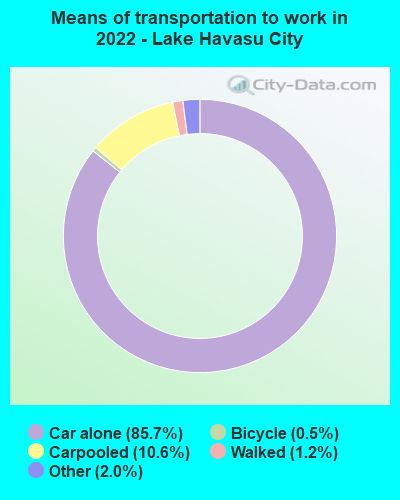
Means of transportation to work:
Drove a car alone: 14,567 (72.7%)
Carpooled: 1,888 (9.4%)
Ferryboat: 1 (0.0%)
Taxi: 390 (1.9%)
Bicycle: 79 (0.4%)
Walked: 221 (1.1%)
Worked at home: 2,563 (12.8%)
Unemployment by race in 2022
Unemployment rate for White non-Hispanic residents
8.8%Males
3.6%Females
Unemployment rate for Black residents
5.9%Females
Unemployment rate for other race residents
2.8%Males
Unemployment rate for two or more race residents
2.2%Males
16.9%Females
Unemployment rate for Hispanic or Latino residents
2.4%Males
1.5%Females
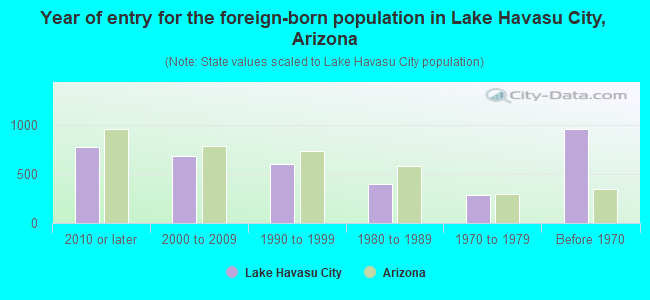
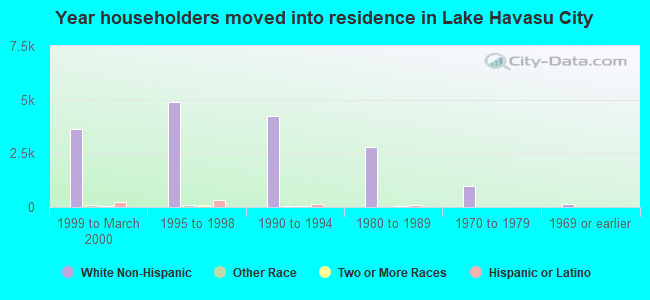
Year of entry for the foreign-born population in Lake Havasu City, Arizona
7692010 or later
6762000 to 2009
6011990 to 1999
3961980 to 1989
2821970 to 1979
954Before 1970
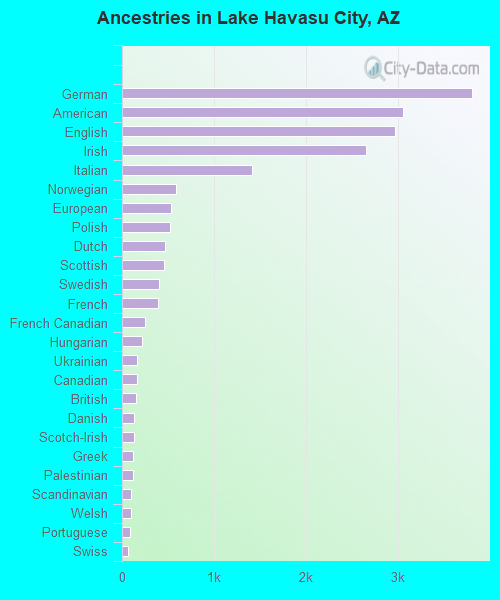
First ancestries reported:
German: 3,805 (13.6%)
American: 3,059 (10.9%)
English: 2,977 (10.7%)
Irish: 2,660 (9.5%)
Italian: 1,413 (5.1%)
Norwegian: 586 (2.1%)
European: 533 (1.9%)
Polish: 523 (1.9%)
Dutch: 471 (1.7%)
Scottish: 455 (1.6%)
Swedish: 399 (1.4%)
French: 395 (1.4%)
French Canadian: 246 (0.9%)
Hungarian: 222 (0.8%)
Ukrainian: 168 (0.6%)
Canadian: 162 (0.6%)
British: 149 (0.5%)
Danish: 134 (0.5%)
Scotch-Irish: 126 (0.5%)
Greek: 123 (0.4%)
Palestinian: 122 (0.4%)
Scandinavian: 100 (0.4%)
Welsh: 94 (0.3%)
Portuguese: 86 (0.3%)
Swiss: 70 (0.3%)
Austrian: 63 (0.2%)
Syrian: 63 (0.2%)
Croatian: 63 (0.2%)
Czech: 59 (0.2%)
Russian: 48 (0.2%)
Northern European: 45 (0.2%)
Belgian: 43 (0.2%)
Czechoslovakian: 31 (0.1%)
Finnish: 25 (0.09%)
Lebanese: 24 (0.09%)
Eastern European: 23 (0.08%)
Arab: 22 (0.08%)
Basque: 18 (0.06%)
Nigerian: 17 (0.06%)
Serbian: 15 (0.05%)
Luxembourger: 14 (0.05%)
Iranian: 14 (0.05%)
Lithuanian: 13 (0.05%)
Romanian: 9 (0.03%)
Haitian: 9 (0.03%)
Most common places of birth for foreign-born residents (%):
Mexico
Lake Havasu City:
41.2% (1,662)
Arizona:
53.4% (500,086)
Canada
Lake Havasu City:
17.0% (686)
Arizona:
4.3% (40,102)
Germany
Lake Havasu City:
4.5% (182)
Arizona:
1.5% (14,058)
Honduras
Lake Havasu City:
3.1% (125)
Arizona:
0.4% (3,511)
Argentina
Lake Havasu City:
3.0% (120)
Arizona:
0.2% (2,126)
Philippines
Lake Havasu City:
2.9% (119)
Arizona:
3.2% (30,378)
Hungary
Lake Havasu City:
2.2% (90)
Arizona:
0.2% (1,572)
Czechoslovakia (includes Czech Republic and Slovakia)
Lake Havasu City:
1.9% (77)
Arizona:
0.2% (1,678)
Netherlands
Lake Havasu City:
1.7% (67)
Arizona:
0.3% (2,465)
England
Lake Havasu City:
1.6% (65)
Arizona:
1.1% (9,889)
Peru
Lake Havasu City:
1.6% (64)
Arizona:
0.5% (4,316)
Place of birth for U.S.-born residents:
This state: 10,219
Other state: 44,695
Northeast: 3,819
Midwest: 10,604
South: 3,624
West: 26,562
84.2% of Lake Havasu City residents lived in the same house 1 years ago. Out of people who lived in different houses, 25.7% lived in this county. Out of people who lived in different counties, 14.7% lived in Arizona.
Lake Havasu City:
84.2%
State average:
86.0%
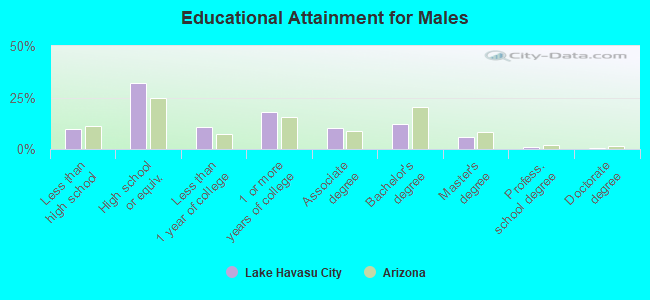
Education attainment for males 25 years and older:
No schooling: 769
Nursery to 4th grade: 17
5th and 6th grade: 106
7th and 8th grade: 72
9th grade: 271
10th grade: 270
11th grade: 197
12th grade, no diploma: 600
High school graduate (or equivalency): 7,607
Less than 1 year of college: 2,530
Some college more than 1 year, no degree: 4,317
Associate degree: 2,378
Bachelor's degree: 2,904
Master's degree: 1,367
Professional school degree: 246
Doctorate degree: 133
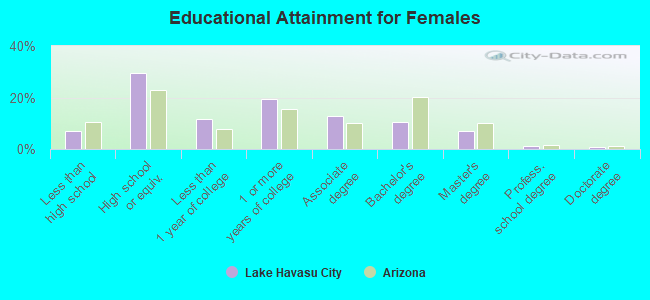
Education attainment for females 25 years and older:
No schooling: 196
Nursery to 4th grade: 32
5th and 6th grade: 74
7th and 8th grade: 13
9th grade: 260
10th grade: 343
11th grade: 225
12th grade, no diploma: 479
High school graduate (or equivalency): 6,890
Less than 1 year of college: 2,772
Some college more than 1 year, no degree: 4,544
Associate degree: 3,026
Bachelor's degree: 2,452
Master's degree: 1,651
Professional school degree: 252
Doctorate degree: 198
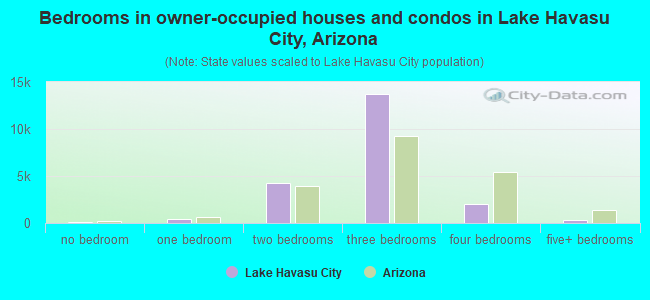
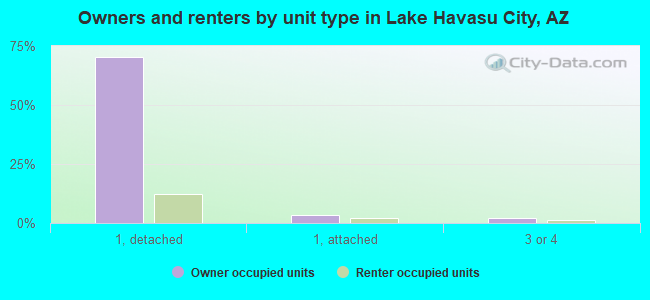
Housing units in structures:
One, detached: 27,407
One, attached: 1,331
Two: 1,022
3 or 4: 1,367
5 to 9: 913
10 to 19: 701
20 to 49: 384
50 or more: 572
Mobile homes: 1,414
Boats, RVs, vans, etc.: 44
Median worth of mobile homes: $142,387
Housing units lacking complete plumbing facilities in 2022: 0.3%
Housing units lacking complete kitchen facilities in 2022: 0.4%