Lake Forest, CA (California) Houses and Residents
| Lake Forest: | $914,300 |
| California: | $715,900 |
Mean price in 2022:
Detached houses: $1,214,568
Here: $1,214,568 State: $988,808 Townhouses or other attached units: $675,002
Here: $675,002 State: $838,546 In 2-unit structures: $488,688
Here: $488,688 State: $1,138,100 In 3-to-4-unit structures: $411,488
Here: $411,488 State: $824,253 In 5-or-more-unit structures: $565,394
Here: $565,394 State: $730,996 Mobile homes: $172,316
Here: $172,316 State: $184,506
Total population: 80,148 (Urban population: 58,806, Rural population: 0)
Houses: 32,946 (31,990 occupied: 22,312 owner occupied, 9,678 renter occupied)
| % of renters here: | 30% |
| State: | 44% |
Housing density: 2,637 houses/condos per square mile
Median price asked for vacant for-sale houses and condos in 2022: $882,667.
Median contract rent in 2022: over $2,000 (lower quartile is $1,829, upper quartile is over $2,000)
Median rent asked for vacant for-rent units in 2022: $2,700
Median gross rent in Lake Forest, CA in 2022: over $2,000
Housing units in Lake Forest with a mortgage: 16,067 (1,790 second mortgage, 101 home equity loan, 1,394 both second mortgage and home equity loan)
Houses without a mortgage: 630
Median household income for houses/condos with a mortgage: $171,546
Median household income for apartments without a mortgage: $101,762
Median monthly housing costs: $2,521
Compare current foreclosures in Lake Forest, CA:
| Photo | Address | Area | Beds / Baths | Price | Details |
|---|---|---|---|---|---|

|
#1
Carmel Dr
Lake Forest, CA 92630
|
1,549 sq. feet
|
2 baths 3 beds |
show details | |

|
#2
Twig St
Lake Forest, CA 92630
|
2,077 sq. feet
|
3 baths 5 beds |
show details | |

|
#3
Malaga Way
Lake Forest, CA 92630
|
1,022 sq. feet
|
2 baths 2 beds |
show details | |

|
#4
Fern Gln # 77
Lake Forest, CA 92630
|
1,351 sq. feet
|
2 baths 3 beds |
show details | |

|
#5
Crocker Ln
Lake Forest, CA 92630
|
1,152 sq. feet
|
2 baths 2 beds |
show details | |

|
#6
Killy St
Lake Forest, CA 92630
|
1,250 sq. feet
|
2 baths 3 beds |
show details | |

|
#7
Killy St
Lake Forest, CA 92630
|
1,250 sq. feet
|
2 baths 3 beds |
show details | |

|
#8
Silver Spur
Lake Forest, CA 92630
|
1,432 sq. feet
|
2 baths 3 beds |
show details | |

|
#9
Lake Forest Ln
Lake Forest, CA 92630
|
1,926 sq. feet
|
3 baths 4 beds |
show details | |

|
#10
Clemens Ln
Lake Forest, CA 92630
|
1,189 sq. feet
|
2 baths 2 beds |
show details |
| Photo | Address | Area | Beds / Baths | Price | Details |
|---|---|---|---|---|---|

|
#11
Cavanaugh Rd
Lake Forest, CA 92630
|
1,404 sq. feet
|
2 baths 3 beds |
show details | |

|
#12
Silver Spur
Lake Forest, CA 92630
|
1,432 sq. feet
|
2 baths 3 beds |
show details | |

|
#13
W Grove Cir
Lake Forest, CA 92630
|
1,367 sq. feet
|
3 baths 2 beds |
show details | |

|
#14
Malaga Way
Lake Forest, CA 92630
|
875 sq. feet
|
1 baths 2 beds |
show details | |

|
#15
Yountville
Lake Forest, CA 92630
|
- sq. feet
|
2 baths 3 beds |
show details | |

|
#16
Forster
Lake Forest, CA 92630
|
- sq. feet
|
- baths - beds |
show details | |

|
#17
Islamare Ln
Lake Forest, CA 92630
|
- sq. feet
|
- baths - beds |
show details | |

|
#18
Normandale Dr # 390
Lake Forest, CA 92630
|
- sq. feet
|
- baths - beds |
show details | |

|
#19
Carmel Dr
Lake Forest, CA 92630
|
- sq. feet
|
- baths - beds |
show details | |

|
#20
Escenico
Lake Forest, CA 92630
|
- sq. feet
|
- baths - beds |
show details |
| Photo | Address | Area | Beds / Baths | Price | Details |
|---|---|---|---|---|---|

|
#21
Trabuco Rd, Ste 105 Pmb 627
Lake Forest, CA 92630
|
- sq. feet
|
- baths - beds |
show details | |

|
#22
Trabuco Rd, Ste 105 Pmb 477
Lake Forest, CA 92630
|
- sq. feet
|
- baths - beds |
show details | |

|
#23
Mosswood Way
Lake Forest, CA 92630
|
- sq. feet
|
- baths - beds |
show details | |

|
#24
Indigo Pl, Unit 308
Lake Forest, CA 92630
|
- sq. feet
|
- baths - beds |
show details | |

|
#25
Arctic Ocean Dr
Lake Forest, CA 92630
|
- sq. feet
|
- baths - beds |
show details | |

|
#26
Lake Forest Dr
Lake Forest, CA 92630
|
- sq. feet
|
- baths - beds |
show details | |

|
#27
Zion Dr
Lake Forest, CA 92630
|
- sq. feet
|
- baths - beds |
show details | |

|
#28
Rockfield Blvd # 245
Lake Forest, CA 92630
|
- sq. feet
|
- baths - beds |
show details | |

|
#29
Vintage Woods Rd Apt 21j
Lake Forest, CA 92630
|
- sq. feet
|
- baths - beds |
show details | |

|
#30
Commercentre Dr # 100
Lake Forest, CA 92630
|
- sq. feet
|
- baths - beds |
show details |
| Photo | Address | Area | Beds / Baths | Price | Details |
|---|---|---|---|---|---|

|
#31
Trabuco Rd, Ste 105 Pmb 246
Lake Forest, CA 92630
|
- sq. feet
|
- baths - beds |
show details | |

|
#32
Snowberry
Lake Forest, CA 92630
|
- sq. feet
|
- baths - beds |
show details | |

|
#33
Mont Pointe
Lake Forest, CA 92630
|
957 sq. feet
|
- baths - beds |
show details | |

|
#34
Lake Forest Dr Apt E
Lake Forest, CA 92630
|
- sq. feet
|
- baths - beds |
show details | |

|
#35
Canada Rd Apt 16
Lake Forest, CA 92630
|
- sq. feet
|
- baths - beds |
show details | |

|
#36
Lupine
Lake Forest, CA 92630
|
- sq. feet
|
- baths - beds |
show details | |

|
#37
Aspan St Ste 290
Lake Forest, CA 92630
|
- sq. feet
|
- baths - beds |
show details | |

|
#38
Muirlands Blvd, Trlr 92
Lake Forest, CA 92630
|
- sq. feet
|
- baths - beds |
show details | |

|
#39
Raymond Way Spc 234
Lake Forest, CA 92630
|
- sq. feet
|
- baths - beds |
show details | |

|
Check over 1 million property listings on Foreclosure.com!
|
browse all offers | |||


Median year apartment built: 1985
Household type by relationship:
Households: 85,635- Male householders: 17,808 (2,975 living alone), Female householders: 14,182 (3,996 living alone)
18,010 spouses (17,942 opposite-sex spouses), 2,082 unmarried partners, (2,082 opposite-sex unmarried partners), 24,652 children (23,765 natural, 169 adopted, 718 stepchildren), 1,729 grandchildren, 454 brothers or sisters, 2,315 parents, 0 foster children, 700 other relatives, 3,021 non-relatives
- In group quarters: 682
Size of family households: 9,586 2-persons, 4,880 3-persons, 5,482 4-persons, 2,115 5-persons, 621 6-persons, 55 7-or-more-persons.
Size of nonfamily households: 6,971 1-person, 1,777 2-persons, 92 3-persons, 411 4-persons.
13,185 married couples with children.
2,074 single-parent households (487 men, 1,587 women).
63.9% of residents of Lake Forest speak English at home.
15.7% of residents speak Spanish at home (60% speak English very well, 21% speak English well, 15% speak English not well, 5% don't speak English at all).
7.0% of residents speak other Indo-European language at home (75% speak English very well, 14% speak English well, 10% speak English not well, 1% don't speak English at all).
11.6% of residents speak Asian or Pacific Island language at home (63% speak English very well, 25% speak English well, 10% speak English not well, 2% don't speak English at all).
1.5% of residents speak other language at home (72% speak English very well, 14% speak English well, 6% speak English not well, 7% don't speak English at all).
Foreign born population: 25,140 (29.4%)
(61.0% of them are naturalized citizens)
| Here: | 6.2 |
| State: | 6.0 |
| Here: | 4.6 |
| State: | 3.9 |

- Bedrooms in owner-occupied houses and condos in Lake Forest, California
- 49no bedroom
- 1,4121 bedroom
- 4,1522 bedrooms
- 6,6563 bedrooms
- 6,5934 bedrooms
- 3,4505+ bedrooms

- Bedrooms in renter-occupied apartments in Lake Forest, California
- 816no bedroom
- 1,7521 bedroom
- 2,4912 bedrooms
- 3,4943 bedrooms
- 1,1254 bedrooms
- 05+ bedrooms

- Cars and other vehicles available in Lake Forest in owner-occupied houses/condos
- 49no vehicle
- 4,9221 vehicle
- 11,0112 vehicles
- 3,2383 vehicles
- 2,1884 vehicles
- 9045+ vehicles

- Cars and other vehicles available in Lake Forest in renter-occupied apartments
- 425no vehicle
- 3,9971 vehicle
- 3,2372 vehicles
- 1,4813 vehicles
- 1274 vehicles
- 4115+ vehicles

- Rooms in owner-occupied houses in Lake Forest, California
- 491 room
- 8582 rooms
- 1,2143 rooms
- 2,7744 rooms
- 4,3245 rooms
- 2,6456 rooms
- 2,9087 rooms
- 4,3548 rooms
- 3,1869+ rooms

- Rooms in renter-occupied apartments in Lake Forest, California
- 8161 room
- 3702 rooms
- 1,8293 rooms
- 1,6724 rooms
- 1,6565 rooms
- 2,2156 rooms
- 4327 rooms
- 5858 rooms
- 1039+ rooms


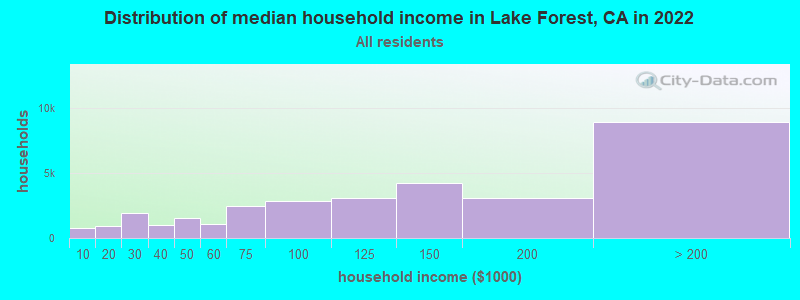
Lake Forest, CA household income distribution

- 774Less than $10,000
- 905$10,000 to $19,999
- 1,914$20,000 to $29,999
- 997$30,000 to $39,999
- 1,538$40,000 to $49,999
- 1,102$50,000 to $59,999
- 2,475$60,000 to $74,999
- 2,835$75,000 to $99,999
- 3,120$100,000 to $124,999
- 4,274$125,000 to $149,999
- 3,106$150,000 to $199,999
- 8,950$200,000 or more
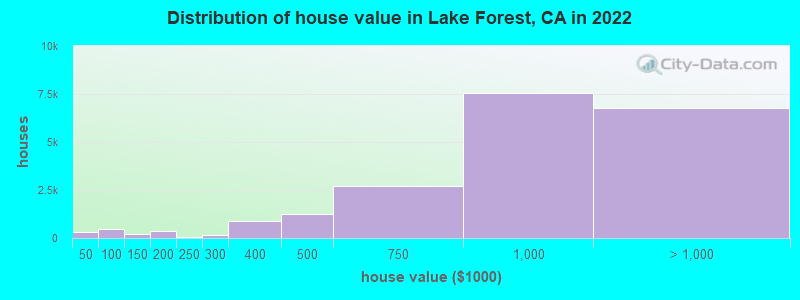
Home value of owner - occupied houses in 2022 in Lake Forest, CA
-
- 221Less than $10,000
- 12$10,000 to $14,999
- 30$20,000 to $24,999
- 10$25,000 to $29,999
- 16$35,000 to $39,999
- 30$50,000 to $59,999
- 68$60,000 to $69,999
- 95$70,000 to $79,999
- 200$80,000 to $89,999
- 67$90,000 to $99,999
- 165$100,000 to $124,999
- 62$125,000 to $149,999
- 371$150,000 to $174,999
- 11$175,000 to $199,999
- 72$200,000 to $249,999
- 174$250,000 to $299,999
- 890$300,000 to $399,999
- 1,274$400,000 to $499,999
- 2,696$500,000 to $749,999
- 7,530$750,000 to $999,999
- 5,318$1,000,000 to $1,499,999
- 669$1,500,000 to $1,999,999
- 788$2,000,000 or more
Rent paid by renters in 2022 in Lake Forest, CA
-
- 22Less than $100
- 146$100 to $149
- 82$200 to $249
- 32$250 to $299
- 16$300 to $349
- 28$700 to $749
- 84$750 to $799
- 82$900 to $999
- 145$1,000 to $1,249
- 193$1,250 to $1,499
- 2,118$1,500 to $1,999
- 2,420$2,000 to $2,499
- 1,299$2,500 to $2,999
- 1,481$3,000 to $3,499
- 1,096$3,500 or more
- 180No cash rent


Percentage of workers working in this county: 93.2%
Number of people working at home: 10,462 (22.8% of all workers)
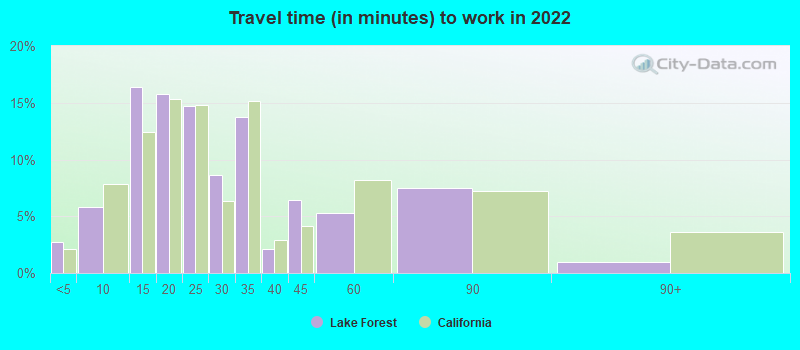
Travel time to work (commute)
- Less than 5 minutes: 695
- 5 to 9 minutes: 1,895
- 10 to 14 minutes: 5,869
- 15 to 19 minutes: 5,185
- 20 to 24 minutes: 5,309
- 25 to 29 minutes: 3,440
- 30 to 34 minutes: 6,872
- 35 to 39 minutes: 1,515
- 40 to 44 minutes: 606
- 45 to 59 minutes: 1,947
- 60 to 89 minutes: 2,281
- 90 or more minutes: 578
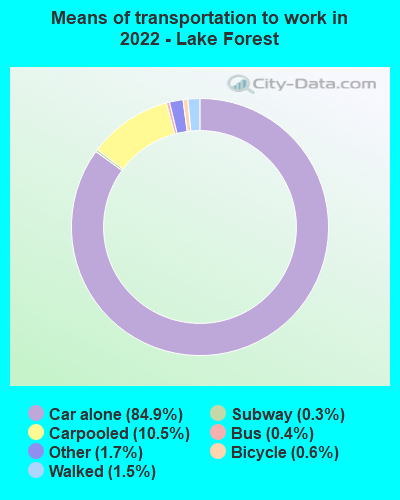
Means of transportation to work:
- Drove a car alone: 27,365 (64.7%)
- Carpooled: 3,679 (8.7%)
- Bus: 118 (0.3%)
- Subway or elevated rail: 5 (0.0%)
- Long-distance train or commuter rail: 70 (0.2%)
- Taxi: 637 (1.5%)
- Bicycle: 192 (0.5%)
- Walked: 495 (1.2%)
- Worked at home: 10,462 (24.7%)

- Unemployment by race in 2022
- Unemployment rate for White non-Hispanic residents
- 4.3%Males
- 1.8%Females
- Unemployment rate for Black residents
- 1.2%Males
- 7.5%Females
- Unemployment rate for Asian residents
- 3.8%Males
- 1.4%Females
- Unemployment rate for other race residents
- 3.7%Males
- 8.0%Females
- Unemployment rate for two or more race residents
- 4.5%Males
- 5.0%Females
- Unemployment rate for Hispanic or Latino residents
- 3.3%Males
- 5.3%Females

- Year of entry for the foreign-born population in Lake Forest, California
- 5,0522010 or later
- 5,4102000 to 2009
- 4,2311990 to 1999
- 3,5841980 to 1989
- 2,5131970 to 1979
- 1,661Before 1970

First ancestries reported:
- English: 2,300 (5.2%)
- American: 2,020 (4.6%)
- German: 1,890 (4.3%)
- Italian: 1,780 (4.0%)
- Iranian: 1,672 (3.8%)
- European: 1,373 (3.1%)
- Irish: 1,120 (2.5%)
- Egyptian: 967 (2.2%)
- Polish: 680 (1.5%)
- Scottish: 367 (0.8%)
- Dutch: 278 (0.6%)
- Eastern European: 265 (0.6%)
- Swedish: 258 (0.6%)
- Norwegian: 223 (0.5%)
- Russian: 223 (0.5%)
- Afghan: 184 (0.4%)
- Croatian: 181 (0.4%)
- Northern European: 179 (0.4%)
- French: 175 (0.4%)
- Turkish: 155 (0.4%)
- Welsh: 150 (0.3%)
- Jordanian: 133 (0.3%)
- Greek: 132 (0.3%)
- British: 118 (0.3%)
- Zimbabwean: 117 (0.3%)
- Danish: 112 (0.3%)
- Romanian: 98 (0.2%)
- Scotch-Irish: 93 (0.2%)
- Ukrainian: 81 (0.2%)
- Swiss: 77 (0.2%)
- Lebanese: 71 (0.2%)
- French Canadian: 67 (0.2%)
- Kenyan: 65 (0.1%)
- Syrian: 63 (0.1%)
- Armenian: 63 (0.1%)
- South African: 54 (0.1%)
- Finnish: 52 (0.1%)
- Portuguese: 45 (0.1%)
- Canadian: 41 (0.09%)
- Austrian: 41 (0.09%)
- Czech: 38 (0.09%)
- Lithuanian: 29 (0.07%)
- Barbadian: 29 (0.07%)
- Hungarian: 22 (0.05%)
- Serbian: 22 (0.05%)
- Scandinavian: 21 (0.05%)
- Ghanaian: 19 (0.04%)
- Bulgarian: 18 (0.04%)
- Basque: 13 (0.03%)
- Jamaican: 12 (0.03%)
- Arab: 10 (0.02%)
- Palestinian: 7 (0.02%)
- Moroccan: 7 (0.02%)
- Pennsylvania German: 6 (0.01%)
- Israeli: 6 (0.01%)
- New Zealander: 5 (0.01%)
- Luxembourger: 4 (0.01%)
- Czechoslovakian: 4 (0.01%)
- Brazilian: 4 (0.01%)
Most common places of birth for foreign-born residents (%):
| Lake Forest: | 21.4% (5,001) |
| California: | 37.2% (3,881,193) |
| Lake Forest: | 9.0% (2,107) |
| California: | 7.8% (818,297) |
| Lake Forest: | 7.2% (1,683) |
| California: | 2.0% (206,004) |
| Lake Forest: | 6.8% (1,586) |
| California: | 4.9% (512,335) |
| Lake Forest: | 6.0% (1,408) |
| California: | 6.6% (684,672) |
| Lake Forest: | 5.0% (1,166) |
| California: | 5.2% (539,184) |
| Lake Forest: | 3.6% (849) |
| California: | 3.0% (315,248) |
| Lake Forest: | 3.4% (804) |
| California: | 1.7% (176,274) |
| Lake Forest: | 3.0% (706) |
| California: | 1.0% (103,575) |
| Lake Forest: | 2.8% (646) |
| California: | 0.4% (42,718) |
| Lake Forest: | 2.3% (538) |
| California: | 2.8% (290,436) |
| Lake Forest: | 2.0% (468) |
| California: | 0.2% (20,997) |
| Lake Forest: | 2.0% (468) |
| California: | 0.7% (74,025) |
| Lake Forest: | 1.6% (368) |
| California: | 1.2% (127,477) |
Place of birth for U.S.-born residents:
- This state: 45,922
- Other state: 13,313
- Northeast: 4,335
- Midwest: 4,623
- South: 2,394
- West: 1,961
88.8% of Lake Forest residents lived in the same house 1 years ago.
Out of people who lived in different houses, 42.6% lived in this county.
Out of people who lived in different counties, 69.2% lived in California.
| Lake Forest: | 88.8% |
| State average: | 88.9% |
Education attainment for males 25 years and older:
- No schooling: 681
- Nursery to 4th grade: 161
- 5th and 6th grade: 159
- 7th and 8th grade: 0
- 9th grade: 8
- 10th grade: 0
- 11th grade: 0
- 12th grade, no diploma: 1,268
- High school graduate (or equivalency): 3,180
- Less than 1 year of college: 2,274
- Some college more than 1 year, no degree: 4,876
- Associate degree: 2,115
- Bachelor's degree: 9,314
- Master's degree: 4,127
- Professional school degree: 354
- Doctorate degree: 381

Education attainment for females 25 years and older:
- No schooling: 676
- Nursery to 4th grade: 255
- 5th and 6th grade: 404
- 7th and 8th grade: 127
- 9th grade: 0
- 10th grade: 50
- 11th grade: 53
- 12th grade, no diploma: 501
- High school graduate (or equivalency): 5,092
- Less than 1 year of college: 2,206
- Some college more than 1 year, no degree: 3,885
- Associate degree: 3,727
- Bachelor's degree: 11,673
- Master's degree: 3,814
- Professional school degree: 471
- Doctorate degree: 441


Housing units in structures:
- One, detached: 16,584
- One, attached: 6,502
- Two: 254
- 3 or 4: 1,954
- 5 to 9: 1,847
- 10 to 19: 2,027
- 20 to 49: 540
- 50 or more: 1,572
- Mobile homes: 1,666
Median worth of mobile homes: $204,354
House/condo owner moved in on average 11 years ago
Renter moved in on average 3 years ago

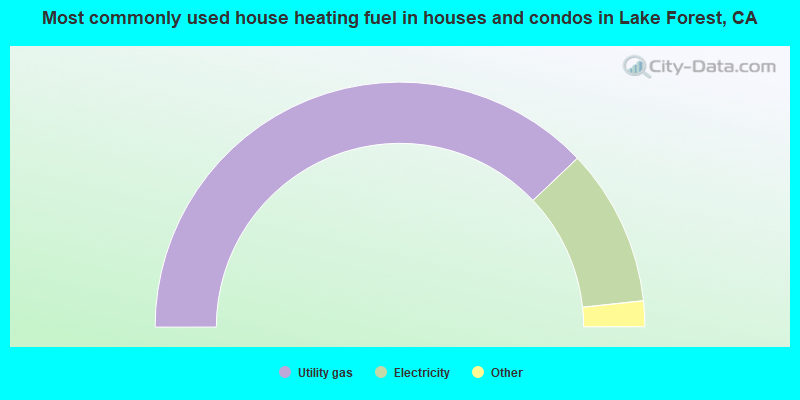
- 75.8%Utility gas
- 20.8%Electricity
- 1.1%No fuel used
- 1.1%Solar energy
- 0.7%Bottled, tank, or LP gas
- 0.3%Wood
- 0.2%Coal or coke
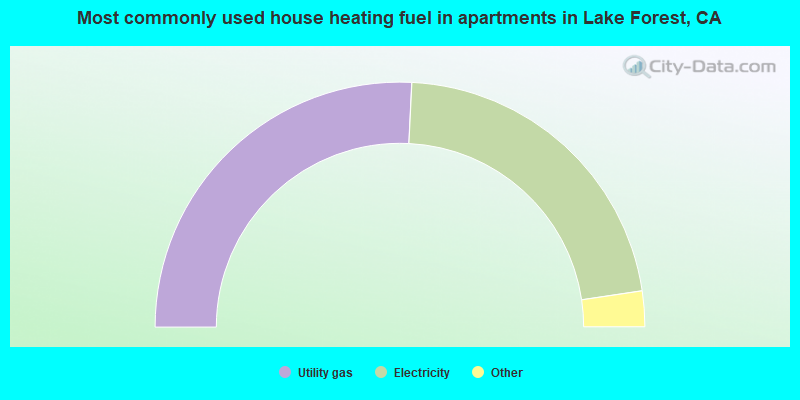
- 51.6%Utility gas
- 43.8%Electricity
- 2.4%Bottled, tank, or LP gas
- 1.5%No fuel used
- 0.6%Solar energy
- 0.2%Other fuel
Private vs. public school enrollment:
| Here: | 9.2% |
| California: | 10.5% |
| Here: | 10.4% |
| California: | 8.5% |
| Here: | 23.6% |
| California: | 15.9% |


