Lake City, PA (Pennsylvania) Houses and Residents
| Lake City: | $149,164 |
| Pennsylvania: | $245,500 |
Mean price in 2022:
Detached houses: $173,261
Here: $173,261 State: $317,202 Townhouses or other attached units: $258,601
Here: $258,601 State: $254,369 Mobile homes: $53,206
Here: $53,206 State: $92,414
Total population: 2,974 (Urban population: 2,811, Rural population: 0)
Houses: 1,188 (1,058 occupied: 940 owner occupied, 134 renter occupied)
| % of renters here: | 12% |
| State: | 31% |
Housing density: 661 houses/condos per square mile
Median price asked for vacant for-sale houses and condos in 2022: $795,426.
Median contract rent in 2022: $688 (lower quartile is $572, upper quartile is $808)
Median rent asked for vacant for-rent units in 2022: $603
Median gross rent in Lake City, PA in 2022: $791
Housing units in Lake City with a mortgage: 594 (50 second mortgage, 0 home equity loan, 42 both second mortgage and home equity loan)
Houses without a mortgage: 15
Median household income for houses/condos with a mortgage: $86,609
Median household income for apartments without a mortgage: $63,631
Median monthly housing costs: $967
Compare current foreclosures near Lake City, PA:
| Photo | Address | Area | Beds / Baths | Price | Details |
|---|---|---|---|---|---|

|
#1
Middle Rd
Lake City, PA 16423
|
2,232 sq. feet
|
1 baths 4 beds |
$74,500
|
show details |

|
#2
Lake St
Lake City, PA 16423
|
1,924 sq. feet
|
1 baths 3 beds |
show details | |

|
#3
Allegheny Ave
Lake City, PA 16423
|
1,748 sq. feet
|
2 baths 3 beds |
show details | |

|
#4
Sampson Ave
Lake City, PA 16423
|
1,357 sq. feet
|
1 baths 3 beds |
show details | |

|
#5
Cherry St
Lake City, PA 16423
|
2,160 sq. feet
|
2 baths 4 beds |
show details | |

|
#6
Dunn Ave
Lake City, PA 16423
|
- sq. feet
|
- baths - beds |
show details | |

|
#7
Main St
Conneaut, OH 44030
|
1,432 sq. feet
|
1 baths 4 beds |
show details | |

|
#8
W 37th St
Erie, PA 16508
|
2,304 sq. feet
|
2 baths 3 beds |
show details | |

|
#9
Sierra Dr
Erie, PA 16506
|
1,980 sq. feet
|
1 baths 3 beds |
show details | |

|
#10
Polk St
Erie, PA 16503
|
504 sq. feet
|
1 baths 2 beds |
show details |
| Photo | Address | Area | Beds / Baths | Price | Details |
|---|---|---|---|---|---|

|
#11
Evergreen Dr
Edinboro, PA 16412
|
1,388 sq. feet
|
3 baths 3 beds |
show details | |

|
#12
Old French Rd
Erie, PA 16509
|
1,788 sq. feet
|
3 baths 5 beds |
show details | |

|
#13
W 32nd St
Erie, PA 16508
|
1,280 sq. feet
|
2 baths 3 beds |
show details | |

|
#14
Cascade St
Erie, PA 16502
|
1,448 sq. feet
|
1 baths 4 beds |
show details | |

|
#15
Cascade St
Erie, PA 16502
|
1,320 sq. feet
|
1 baths 3 beds |
show details | |

|
#16
W 24th St
Erie, PA 16502
|
1,878 sq. feet
|
1 baths 4 beds |
show details | |

|
#17
W 29th St
Erie, PA 16508
|
1,254 sq. feet
|
1 baths 3 beds |
show details | |

|
#18
Rilling Ave
Erie, PA 16509
|
2,448 sq. feet
|
2 baths 6 beds |
show details | |

|
#19
W 31st St
Erie, PA 16508
|
1,166 sq. feet
|
1 baths 3 beds |
show details | |

|
#20
W 31st St
Erie, PA 16508
|
1,232 sq. feet
|
1 baths 3 beds |
show details |
| Photo | Address | Area | Beds / Baths | Price | Details |
|---|---|---|---|---|---|

|
#21
W Gore Rd
Erie, PA 16509
|
2,366 sq. feet
|
2 baths 3 beds |
show details | |

|
#22
Liberty St
Erie, PA 16508
|
1,400 sq. feet
|
1 baths 3 beds |
show details | |

|
#23
W 18th St
Erie, PA 16502
|
1,232 sq. feet
|
1 baths 3 beds |
show details | |

|
#24
Plum St
Erie, PA 16502
|
2,044 sq. feet
|
2 baths 4 beds |
show details | |

|
#25
Longacre Ave
Erie, PA 16509
|
2,152 sq. feet
|
2 baths 3 beds |
show details | |

|
#26
Harding Dr
Erie, PA 16509
|
1,103 sq. feet
|
1 baths 3 beds |
show details | |

|
#27
W 51st St
Erie, PA 16509
|
1,825 sq. feet
|
1 baths 3 beds |
show details | |

|
#28
Poplar St
Erie, PA 16508
|
1,416 sq. feet
|
1 baths 3 beds |
show details | |

|
#29
W 10th St
Erie, PA 16502
|
1,832 sq. feet
|
1 baths 4 beds |
show details | |

|
#30
W 22nd St
Erie, PA 16502
|
1,946 sq. feet
|
2 baths 5 beds |
show details |
| Photo | Address | Area | Beds / Baths | Price | Details |
|---|---|---|---|---|---|

|
#31
Hazel St
Erie, PA 16508
|
1,101 sq. feet
|
1 baths 3 beds |
show details | |

|
#32
Maple St
Erie, PA 16508
|
1,184 sq. feet
|
1 baths 3 beds |
show details | |

|
#33
Rilling Ave
Erie, PA 16509
|
2,448 sq. feet
|
2 baths 6 beds |
show details | |

|
#34
Raspberry St
Erie, PA 16502
|
1,288 sq. feet
|
2 baths 4 beds |
show details | |

|
#35
W 32nd St
Erie, PA 16508
|
2,678 sq. feet
|
2 baths 4 beds |
show details | |

|
#36
W 35th St
Erie, PA 16508
|
1,467 sq. feet
|
1 baths 3 beds |
show details | |

|
#37
Fifield Ave
Conneaut, OH 44030
|
1,092 sq. feet
|
1 baths 2 beds |
show details | |

|
#38
W 15th St
Erie, PA 16505
|
720 sq. feet
|
1 baths 2 beds |
show details | |

|
#39
W 14th St
Erie, PA 16505
|
1,018 sq. feet
|
1 baths 2 beds |
show details | |

|
#40
W 14th St
Erie, PA 16505
|
1,018 sq. feet
|
1 baths 2 beds |
show details |
| Photo | Address | Area | Beds / Baths | Price | Details |
|---|---|---|---|---|---|

|
#41
W 38th St
Erie, PA 16508
|
864 sq. feet
|
1 baths 3 beds |
show details | |

|
#42
Charlotte St
Erie, PA 16508
|
780 sq. feet
|
1 baths 2 beds |
show details | |

|
#43
King St
Conneaut, OH 44030
|
1,758 sq. feet
|
2 baths 3 beds |
show details | |

|
#44
Dorn Rd
Waterford, PA 16441
|
1,560 sq. feet
|
2 baths 3 beds |
show details | |

|
#45
Washington Ave
Erie, PA 16508
|
1,575 sq. feet
|
1 baths 4 beds |
show details | |

|
#46
High St
Erie, PA 16509
|
1,546 sq. feet
|
1 baths 3 beds |
show details | |

|
#47
Washington Ave
Erie, PA 16509
|
2,124 sq. feet
|
2 baths 4 beds |
show details | |

|
#48
W 27th St
Erie, PA 16508
|
1,584 sq. feet
|
1 baths 3 beds |
show details | |

|
#49
W 37th St
Erie, PA 16508
|
1,040 sq. feet
|
1 baths 3 beds |
show details | |

|
Check over 1 million property listings on Foreclosure.com!
|
browse all offers | |||


 | Residents who have switched/moved to or visited other neighborhoods (34 replies) |
| Squirrel Hill or Greensburg? (60 replies) |
| New population estimates show city/county may not post loss in 2020 census... (67 replies) |
| Philadelphia 2035 (9298 replies) |
| Philadelphia vs Pittsburgh (1514 replies) |
| Amazon is looking for a second HQ. Why not, Pittsburgh? (2091 replies) |

Median year apartment built: 1981
Household type by relationship:
Households: 2,894- Male householders: 452 (95 living alone), Female householders: 593 (124 living alone)
532 spouses (527 opposite-sex spouses), 143 unmarried partners, (140 opposite-sex unmarried partners), 893 children (843 natural, 11 adopted, 38 stepchildren), 36 grandchildren, 6 brothers or sisters, 9 parents, 36 foster children, 9 other relatives, 166 non-relatives
- In group quarters: 12
Size of family households: 310 2-persons, 161 3-persons, 145 4-persons, 54 5-persons, 35 6-persons, 22 7-or-more-persons.
Size of nonfamily households: 230 1-person, 12 2-persons, 97 3-persons.
481 married couples with children.
110 single-parent households (5 men, 105 women).
93.0% of residents of Lake City speak English at home.
5.2% of residents speak Spanish at home (100% speak English very well).
0.5% of residents speak other Indo-European language at home (67% speak English very well, 33% speak English not well).
0.2% of residents speak Asian or Pacific Island language at home (100% speak English very well).
Foreign born population: 90 (3.1%)
(31.1% of them are naturalized citizens)
| Here: | 6.2 |
| State: | 6.8 |
| Here: | 4.3 |
| State: | 4.3 |

- Bedrooms in owner-occupied houses and condos in Lake City, Pennsylvania
- 0no bedroom
- 51 bedroom
- 1282 bedrooms
- 6023 bedrooms
- 1734 bedrooms
- 335+ bedrooms

- Bedrooms in renter-occupied apartments in Lake City, Pennsylvania
- 0no bedroom
- 151 bedroom
- 832 bedrooms
- 293 bedrooms
- 64 bedrooms
- 05+ bedrooms

- Cars and other vehicles available in Lake City in owner-occupied houses/condos
- 16no vehicle
- 3141 vehicle
- 4862 vehicles
- 843 vehicles
- 244 vehicles
- 155+ vehicles

- Cars and other vehicles available in Lake City in renter-occupied apartments
- 14no vehicle
- 581 vehicle
- 462 vehicles
- 03 vehicles
- 164 vehicles
- 05+ vehicles

- Rooms in owner-occupied houses in Lake City, Pennsylvania
- 01 room
- 02 rooms
- 03 rooms
- 404 rooms
- 2125 rooms
- 3226 rooms
- 1667 rooms
- 738 rooms
- 1279+ rooms

- Rooms in renter-occupied apartments in Lake City, Pennsylvania
- 01 room
- 52 rooms
- 53 rooms
- 724 rooms
- 205 rooms
- 256 rooms
- 07 rooms
- 68 rooms
- 09+ rooms


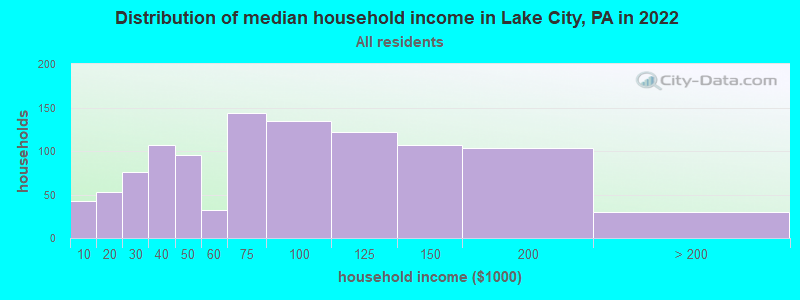
Lake City, PA household income distribution

- 42Less than $10,000
- 53$10,000 to $19,999
- 76$20,000 to $29,999
- 107$30,000 to $39,999
- 95$40,000 to $49,999
- 32$50,000 to $59,999
- 144$60,000 to $74,999
- 135$75,000 to $99,999
- 122$100,000 to $124,999
- 107$125,000 to $149,999
- 103$150,000 to $199,999
- 30$200,000 or more
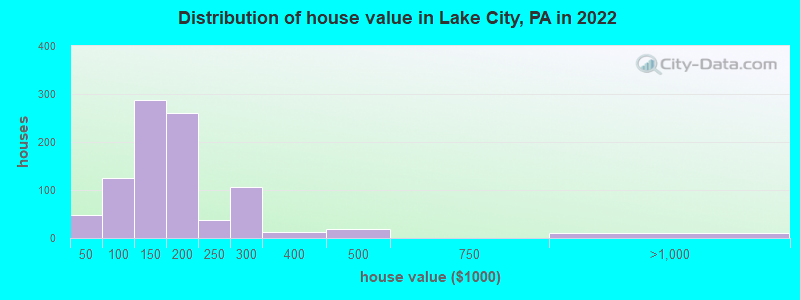
Home value of owner - occupied houses in 2022 in Lake City, PA
-
- 20Less than $10,000
- 9$10,000 to $14,999
- 2$15,000 to $19,999
- 6$25,000 to $29,999
- 9$40,000 to $49,999
- 8$50,000 to $59,999
- 6$60,000 to $69,999
- 5$70,000 to $79,999
- 41$80,000 to $89,999
- 53$90,000 to $99,999
- 164$100,000 to $124,999
- 124$125,000 to $149,999
- 144$150,000 to $174,999
- 116$175,000 to $199,999
- 37$200,000 to $249,999
- 105$250,000 to $299,999
- 12$300,000 to $399,999
- 19$400,000 to $499,999
- 8$750,000 to $999,999
- 2$1,000,000 to $1,499,999
Rent paid by renters in 2022 in Lake City, PA
-
- 3Less than $100
- 11$100 to $149
- 3$300 to $349
- 9$550 to $599
- 31$600 to $649
- 11$700 to $749
- 10$750 to $799
- 13$800 to $899
- 4$1,000 to $1,249
- 10No cash rent


Percentage of workers working in this county: 98.8%
Number of people working at home: 65 (4.5% of all workers)
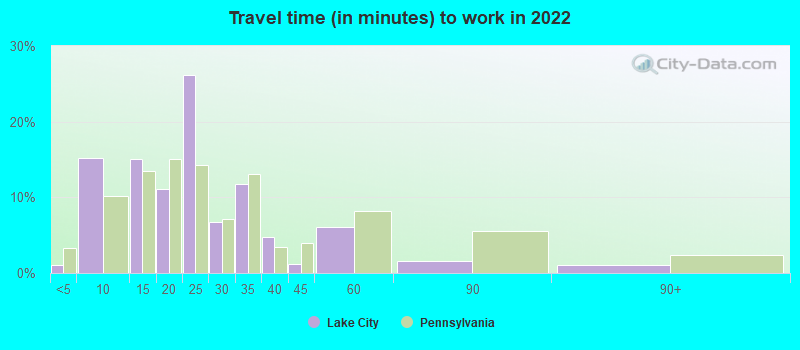
Travel time to work (commute)
- Less than 5 minutes: 30
- 5 to 9 minutes: 211
- 10 to 14 minutes: 201
- 15 to 19 minutes: 76
- 20 to 24 minutes: 277
- 25 to 29 minutes: 76
- 30 to 34 minutes: 219
- 35 to 39 minutes: 103
- 40 to 44 minutes: 34
- 45 to 59 minutes: 71
- 60 to 89 minutes: 51
- 90 or more minutes: 39
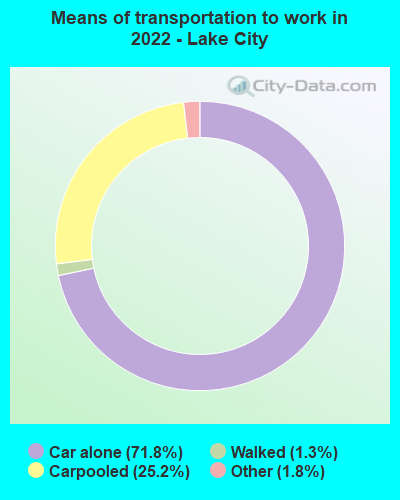
Means of transportation to work:
- Drove a car alone: 716 (66.5%)
- Carpooled: 266 (24.7%)
- Taxi: 29 (2.7%)
- Walked: 13 (1.2%)
- Worked at home: 65 (6.0%)

- Unemployment by race in 2022
- Unemployment rate for White non-Hispanic residents
- 3.9%Males
- 1.0%Females

- Year of entry for the foreign-born population in Lake City, Pennsylvania
- 72010 or later
- 542000 to 2009
- 121990 to 1999
- 01980 to 1989
- 01970 to 1979
- 10Before 1970

First ancestries reported:
- German: 201 (17.4%)
- Italian: 143 (12.4%)
- American: 138 (12.0%)
- Irish: 82 (7.1%)
- English: 80 (6.9%)
- European: 64 (5.5%)
- Slovak: 41 (3.6%)
- Polish: 24 (2.1%)
- Swedish: 22 (1.9%)
- Russian: 20 (1.7%)
- Scotch-Irish: 15 (1.3%)
- Ukrainian: 12 (1.0%)
- Norwegian: 7 (0.6%)
- Slavic: 7 (0.6%)
- Belizean: 7 (0.6%)
- French: 6 (0.5%)
- Eastern European: 4 (0.3%)
- British: 3 (0.3%)
- Scottish: 2 (0.2%)
- Czech: 1 (0.09%)
Most common places of birth for foreign-born residents (%):
| Lake City: | 60.2% (56) |
| Pennsylvania: | 0.3% (2,635) |
| Lake City: | 17.2% (16) |
| Pennsylvania: | 0.1% (579) |
| Lake City: | 12.9% (12) |
| Pennsylvania: | 2.1% (19,841) |
| Lake City: | 6.5% (6) |
| Pennsylvania: | 2.2% (21,039) |
Place of birth for U.S.-born residents:
- This state: 2,302
- Other state: 489
- Northeast: 86
- Midwest: 194
- South: 172
- West: 27
93.9% of Lake City residents lived in the same house 1 years ago.
Out of people who lived in different houses, 46.4% lived in this county.
Out of people who lived in different counties, 0.0% lived in Pennsylvania.
| Lake City: | 93.9% |
| State average: | 89.3% |
Education attainment for males 25 years and older:
- No schooling: 0
- Nursery to 4th grade: 2
- 5th and 6th grade: 0
- 7th and 8th grade: 7
- 9th grade: 5
- 10th grade: 30
- 11th grade: 1
- 12th grade, no diploma: 15
- High school graduate (or equivalency): 464
- Less than 1 year of college: 25
- Some college more than 1 year, no degree: 68
- Associate degree: 72
- Bachelor's degree: 90
- Master's degree: 69
- Professional school degree: 87
- Doctorate degree: 6

Education attainment for females 25 years and older:
- No schooling: 6
- Nursery to 4th grade: 0
- 5th and 6th grade: 0
- 7th and 8th grade: 4
- 9th grade: 0
- 10th grade: 36
- 11th grade: 11
- 12th grade, no diploma: 0
- High school graduate (or equivalency): 399
- Less than 1 year of college: 60
- Some college more than 1 year, no degree: 60
- Associate degree: 95
- Bachelor's degree: 94
- Master's degree: 198
- Professional school degree: 0
- Doctorate degree: 21


Housing units in structures:
- One, detached: 914
- One, attached: 86
- Two: 32
- 3 or 4: 109
- Mobile homes: 46
House/condo owner moved in on average 12 years ago
Renter moved in on average 5 years ago

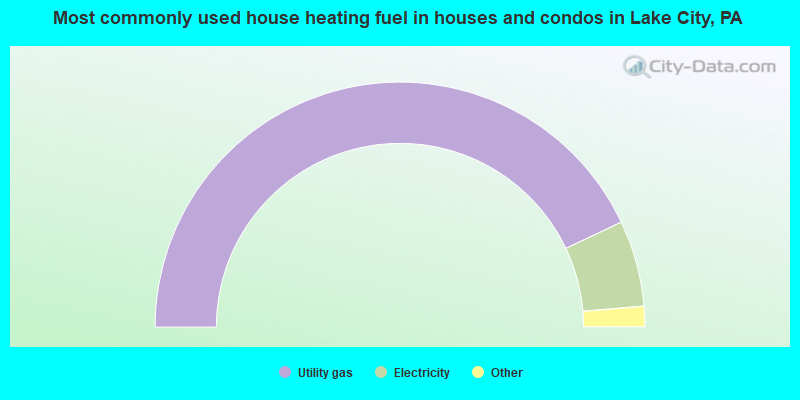
- 86.1%Utility gas
- 11.4%Electricity
- 1.6%Bottled, tank, or LP gas
- 0.5%Fuel oil, kerosene, etc.
- 0.4%No fuel used
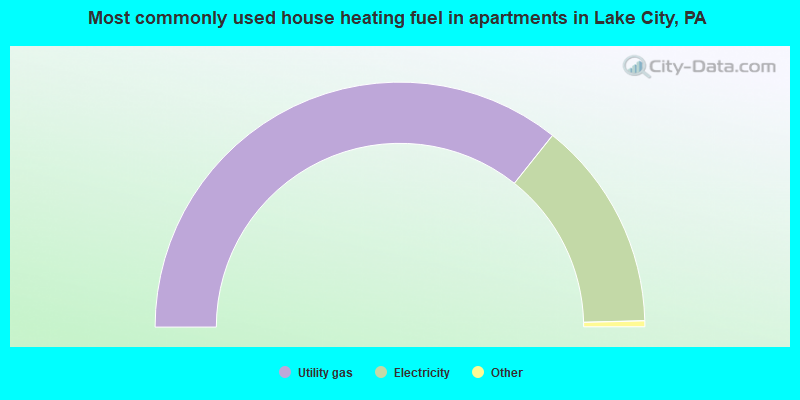
- 72.0%Utility gas
- 28.0%Electricity
Private vs. public school enrollment:
| Here: | 3.2% |
| Pennsylvania: | 15.7% |
| Here: | 19.3% |
| Pennsylvania: | 13.4% |
| Here: | 30.0% |
| Pennsylvania: | 39.8% |


