Lafayette, IN (Indiana) Houses and Residents
Estimated median house or condo value in 2022: $155,900 (it was $89,300 in 2000 )
Lafayette:
$155,900Indiana:
$208,700
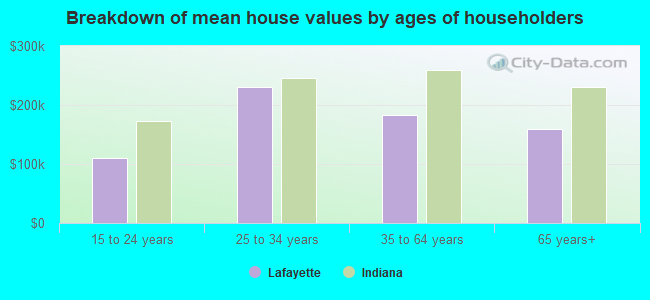
Lower value quartile - upper value quartile: $111,200 - $227,000Mean price in 2022: Detached houses: $186,099 Here:
$186,099State:
$257,916
Townhouses or other attached units: $199,406 Here:
$199,406State:
$224,114
In 2-unit structures: $111,105 Here:
$111,105State:
$175,375
In 3-to-4-unit structures: $153,711 Here:
$153,711State:
$151,116
In 5-or-more-unit structures: $212,593 Here:
$212,593State:
$200,844
Mobile homes: $32,982 Here:
$32,982State:
$67,116
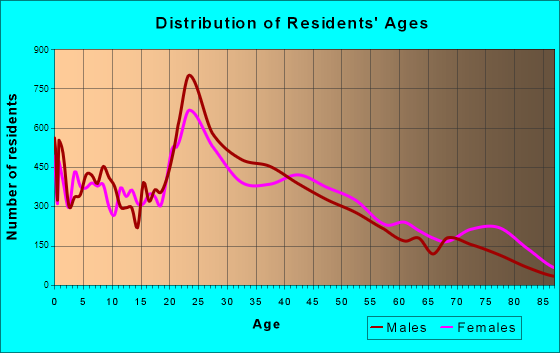
Total population: 70,654 (Urban population: 56,060, Rural population: 184 (all nonfarm) )
Houses: 34,239 (32,604 occupied: 14,750 owner occupied, 17,854 renter occupied )
% of renters here:
55%State:
29%
Housing density: 1,704 houses/condos per square mile
Median price asked for vacant for-sale houses and condos in 2022: $127,874.
Median contract rent in 2022: $830 (lower quartile is $708, upper quartile is $969)
Median rent asked for vacant for-rent units in 2022: $1,203
Median gross rent in Lafayette, IN in 2022: $1,016
Housing units in Lafayette with a mortgage: 9,469 (688 second mortgage, 0 home equity loan, 660 both second mortgage and home equity loan )Houses without a mortgage: 173
Median household income for houses/condos with a mortgage: $73,418
Median household income for apartments without a mortgage: $57,405
Median monthly housing costs: $929
Data:
Median house or condo value ($)
Median house or condo value ($ change since 2000)
Median house or condo value ($) - White
Median house or condo value ($) - Black or African American
Median house or condo value ($) - Asian
Median house or condo value ($) - Hispanic or Latino
Median house or condo value ($) - American Indian and Alaska Native
Median house or condo value ($) - Multirace
Median house or condo value ($) - Other Race
Median price asked for mobile homes ($)
Household density (households per square mile)
Mean house or condo value by units in structure - 1, detached ($)
Mean house or condo value by units in structure - 1, attached ($)
Mean house or condo value by units in structure - 2 ($)
Mean house or condo value by units in structure by units in structure - 3 or 4 ($)
Mean house or condo value by units in structure - 5 or more ($)
Mean house or condo value by units in structure - Boat, RV, van, etc. ($)
Mean house or condo value by units in structure - Mobile home ($)
Median contract rent ($)
Median contract rent - Lower quartile ($)
Median contract rent - Upper quartile ($)
Median gross rent ($)
Urban houses (%)
Rural houses (%)
Houses occupied (%)
Houses occupied (% change since 2000)
Houses owner occupied (%)
Houses owner occupied (% change since 2000)
Houses renter occupied (%)
Houses renter occupied (% change since 2000)
Vacant housing units - For rent (%)
Vacant housing units - For rent (% change since 2000)
Vacant housing units - For sale only (%)
Vacant housing units - For sale only (% change since 2000)
Vacant housing units - Rented or sold, not occupied (%)
Vacant housing units - Rented or sold, not occupied (% change since 2000)
Vacant housing units - For seasonal, recreational, or occasional use (%)
Vacant housing units - For seasonal, recreational, or occasional use (% change since 2000)
Vacant housing units - For migrant workers (%)
Vacant housing units - For migrant workers (% change since 2000)
Vacant housing units - Other vacant (%)
Vacant housing units - Other vacant (% change since 2000)
Median monthly housing costs ($)
Median household income for houses/condos with a mortgage ($)
Median household income for houses/condos without a mortgage ($)
Median household income ($)
Median household income ($) - White
Median household income ($) - Black or African American
Median household income ($) - Asian
Median household income ($) - Hispanic or Latino
Median household income ($) - American Indian and Alaska Native
Median household income ($) - Multirace
Median household income ($) - Other Race
Mortgage status - with mortgage (%)
Mortgage status - with second mortgage (%)
Mortgage status - with home equity loan (%)
Mortgage status - with both second mortgage and home equity loan (%)
Mortgage status - without a mortgage (%)
Median year house/condo built
Median year apartment built
Household type by relationship - Male householder living alone (%)
Household type by relationship - Male householder not living alone (%)
Household type by relationship - Female householder living alone (%)
Household type by relationship - Female householder not living alone (%)
Household type by relationship - Opposite-Sex spouse (%)
Household type by relationship - Same-Sex spouse (%)
Household type by relationship - Opposite-Sex unmarried partner (%)
Household type by relationship - Same-Sex unmarried partner (%)
Household type by relationship - In group quarters (%)
Size of family households - 2-person household (%)
Size of family households - 3-person household (%)
Size of family households - 4-person household (%)
Size of family households - 5-person household (%)
Size of family households - 6-person household (%)
Size of family households - 7-or-more-person household (%)
Size of nonfamily households - 1-person household (%)
Size of nonfamily households - 2-person household (%)
Size of nonfamily households - 3-person household (%)
Size of nonfamily households - 4-person household (%)
Size of nonfamily households - 5-person household (%)
Size of nonfamily households - 6-person household (%)
Size of nonfamily households - 7-or-moreperson household (%)
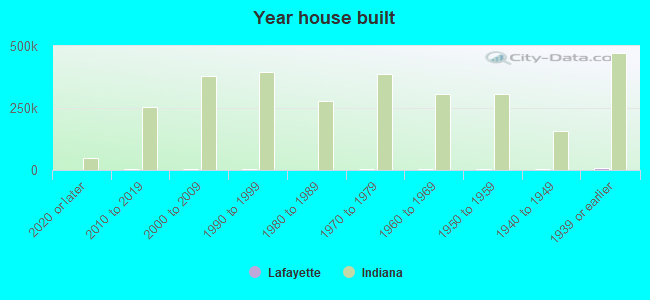
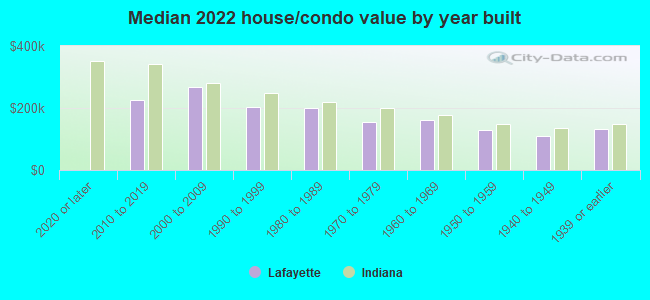
Year house built - Built 2010 or later (%)
Year house built - Built 2000 to 2009 (%)
Year house built - Built 1990 to 1999 (%)
Year house built - Built 1980 to 1989 (%)
Year house built - Built 1970 to 1979 (%)
Year house built - Built 1960 to 1969 (%)
Year house built - Built 1950 to 1959 (%)
Year house built - Built 1940 to 1949 (%)
Year house built - Built 1939 or earlier (%)
Median number of rooms in houses and condos
Median number of rooms in apartments
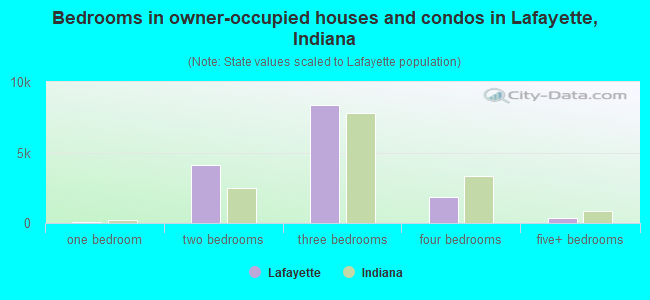
Median number of bedrooms in owner occupied houses
Mean number of bedrooms in owner occupied houses
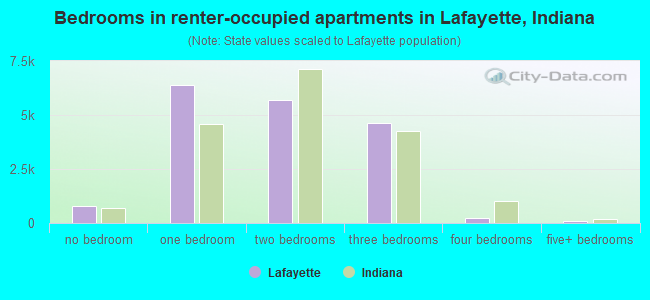
Median number of bedrooms in renter occupied houses
Mean number of bedrooms in renter occupied houses
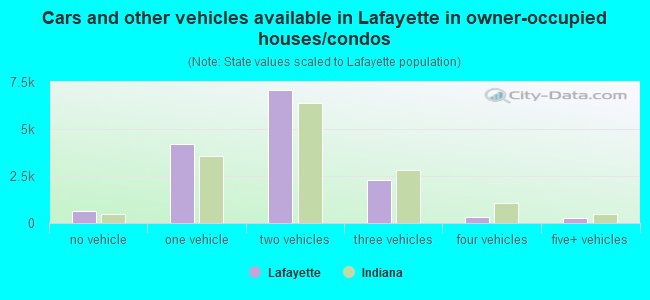
Median number of vehichles in owner occupied houses
Mean number of vehichles in owner occupied houses
Median number of vehichles in renter occupied houses
Mean number of vehichles in renter occupied houses
Rooms in owner-occupied houses - 1 room (%)
Rooms in owner-occupied houses - 2 rooms (%)
Rooms in owner-occupied houses - 3 rooms (%)
Rooms in owner-occupied houses - 4 rooms (%)
Rooms in owner-occupied houses - 5 rooms (%)
Rooms in owner-occupied houses - 6 rooms (%)
Rooms in owner-occupied houses - 7 rooms (%)
Rooms in owner-occupied houses - 8 rooms (%)
Rooms in owner-occupied houses - 9+ rooms (%)
Rooms in renter-occupied houses - 1 room (%)
Rooms in renter-occupied houses - 2 rooms (%)
Rooms in renter-occupied houses - 3 rooms (%)
Rooms in renter-occupied houses - 4 rooms (%)
Rooms in renter-occupied houses - 5 rooms (%)
Rooms in renter-occupied houses - 6 rooms (%)
Rooms in renter-occupied houses - 7 rooms (%)
Rooms in renter-occupied houses - 8 rooms (%)
Rooms in renter-occupied houses - 9+ rooms (%)
Bedrooms in owner-occupied houses - no bedrooms (%)
Bedrooms in owner-occupied houses - 1 bedroom (%)
Bedrooms in owner-occupied houses - 2 bedrooms (%)
Bedrooms in owner-occupied houses - 3 bedrooms (%)
Bedrooms in owner-occupied houses - 4 bedrooms (%)
Bedrooms in owner-occupied houses - 5+ bedrooms (%)
Bedrooms in renter-occupied houses - no bedrooms (%)
Bedrooms in renter-occupied houses - 1 bedroom (%)
Bedrooms in renter-occupied houses - 2 bedrooms (%)
Bedrooms in renter-occupied houses - 3 bedrooms (%)
Bedrooms in renter-occupied houses - 4 bedrooms (%)
Bedrooms in renter-occupied houses - 5+ bedrooms (%)
Vehicles available in owner-occupied houses - no vehicle available (%)
Vehicles available in owner-occupied houses - 1 vehicle available(%)
Vehicles available in owner-occupied houses - 2 Vehicles available (%)
Vehicles available in owner-occupied houses - 3 Vehicles available (%)
Vehicles available in owner-occupied houses - 4 Vehicles available (%)
Vehicles available in owner-occupied houses - 5+ Vehicles available (%)
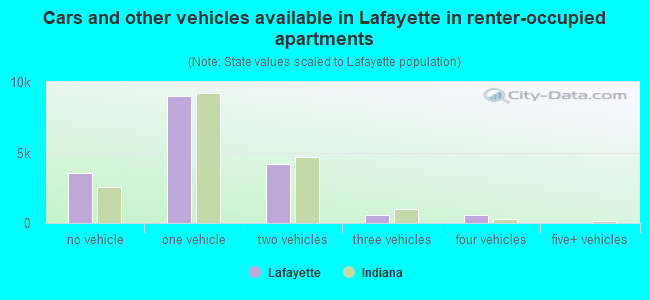
Vehicles available in renter-occupied houses - no vehicle available (%)
Vehicles available in renter-occupied houses - 1 vehicle available (%)
Vehicles available in renter-occupied houses - 2 Vehicles available (%)
Vehicles available in renter-occupied houses - 3 Vehicles available (%)
Vehicles available in renter-occupied houses - 4 Vehicles available (%)
Vehicles available in renter-occupied houses - 5+ Vehicles available (%)
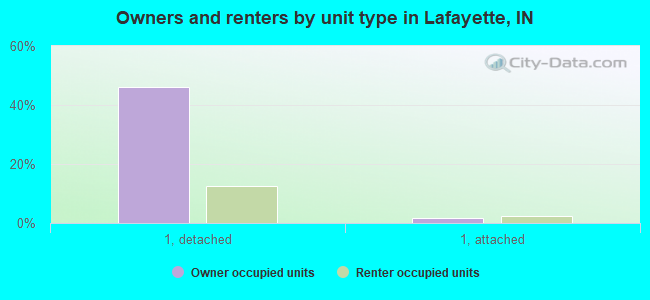
Housing units in structures - 1, detached (%)
Housing units in structures - 1, attached (%)
Housing units in structures - 2 (%)
Housing units in structures - 3 or 4 (%)
Housing units in structures - 5 to 9 (%)
Housing units in structures - 10 to 19 (%)
Housing units in structures - 20 to 49 (%)
Housing units in structures - 50 or more (%)
Housing units in structures - Mobile home (%)
Housing units in structures - Boat, RV, van, etc. (%)
Housing units in structures - Owners - 1, detached (%)
Housing units in structures - Owners - 1, attached (%)
Housing units in structures - Owners - 2 (%)
Housing units in structures - Owners - 3 or 4 (%)
Housing units in structures - Owners - 5 to 9 (%)
Housing units in structures - Owners - 10 to 19 (%)
Housing units in structures - Owners - 20 to 49 (%)
Housing units in structures - Owners - 50 or more (%)
Housing units in structures - Owners - Mobile home (%)
Housing units in structures - Owners - Boat, RV, van, etc. (%)
Housing units in structures - Renters - 1, detached (%)
Housing units in structures - Renters - 1, attached (%)
Housing units in structures - Renters - 2 (%)
Housing units in structures - Renters - 3 or 4 (%)
Housing units in structures - Renters - 5 to 9 (%)
Housing units in structures - Renters - 10 to 19 (%)
Housing units in structures - Renters - 20 to 49 (%)
Housing units in structures - Renters - 50 or more (%)
Housing units in structures - Renters - Mobile home (%)
Housing units in structures - Renters - Boat, RV, van, etc. (%)
House/condo owner moved in on average (years ago)
Renter moved in on average (years ago)
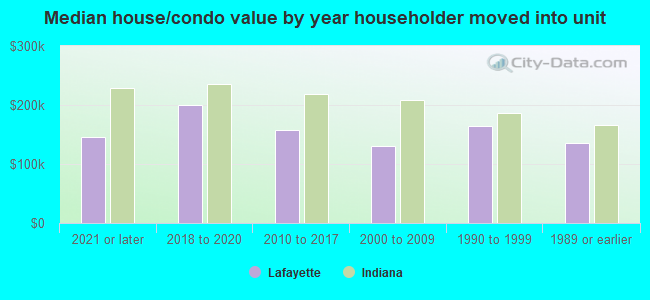
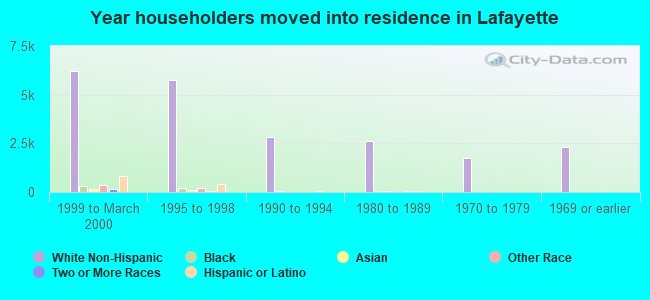
Year householder moved into unit - Moved in 1999 to March 2000 (%)
Year householder moved into unit - Moved in 1999 to March 2000 (%) - White
Year householder moved into unit - Moved in 1999 to March 2000 (%) - Black or African American
Year householder moved into unit - Moved in 1999 to March 2000 (%) - Asian
Year householder moved into unit - Moved in 1999 to March 2000 (%) - Hispanic or Latino
Year householder moved into unit - Moved in 1999 to March 2000 (%) - American Indian and Alaska Native
Year householder moved into unit - Moved in 1999 to March 2000 (%) - Multirace
Year householder moved into unit - Moved in 1999 to March 2000 (%) - Other Race
Year householder moved into unit - Moved in 1995 to 1998 (%)
Year householder moved into unit - Moved in 1995 to 1998 (%) - White
Year householder moved into unit - Moved in 1995 to 1998 (%) - Black or African American
Year householder moved into unit - Moved in 1995 to 1998 (%) - Asian
Year householder moved into unit - Moved in 1995 to 1998 (%) - Hispanic or Latino
Year householder moved into unit - Moved in 1995 to 1998 (%) - American Indian and Alaska Native
Year householder moved into unit - Moved in 1995 to 1998 (%) - Multirace
Year householder moved into unit - Moved in 1995 to 1998 (%) - Other Race
Year householder moved into unit - Moved in 1990 to 1994 (%)
Year householder moved into unit - Moved in 1990 to 1994 (%) - White
Year householder moved into unit - Moved in 1990 to 1994 (%) - Black or African American
Year householder moved into unit - Moved in 1990 to 1994 (%) - Asian
Year householder moved into unit - Moved in 1990 to 1994 (%) - Hispanic or Latino
Year householder moved into unit - Moved in 1990 to 1994 (%) - American Indian and Alaska Native
Year householder moved into unit - Moved in 1990 to 1994 (%) - Multirace
Year householder moved into unit - Moved in 1990 to 1994 (%) - Other Race
Year householder moved into unit - Moved in 1980 to 1989 (%)
Year householder moved into unit - Moved in 1980 to 1989 (%) - White
Year householder moved into unit - Moved in 1980 to 1989 (%) - Black or African American
Year householder moved into unit - Moved in 1980 to 1989 (%) - Asian
Year householder moved into unit - Moved in 1980 to 1989 (%) - Hispanic or Latino
Year householder moved into unit - Moved in 1980 to 1989 (%) - American Indian and Alaska Native
Year householder moved into unit - Moved in 1980 to 1989 (%) - Multirace
Year householder moved into unit - Moved in 1980 to 1989 (%) - Other Race
Year householder moved into unit - Moved in 1970 to 1979 (%)
Year householder moved into unit - Moved in 1970 to 1979 (%) - White
Year householder moved into unit - Moved in 1970 to 1979 (%) - Black or African American
Year householder moved into unit - Moved in 1970 to 1979 (%) - Asian
Year householder moved into unit - Moved in 1970 to 1979 (%) - Hispanic or Latino
Year householder moved into unit - Moved in 1970 to 1979 (%) - American Indian and Alaska Native
Year householder moved into unit - Moved in 1970 to 1979 (%) - Multirace
Year householder moved into unit - Moved in 1970 to 1979 (%) - Other Race
Year householder moved into unit - Moved in 1969 or earlier (%)
Year householder moved into unit - Moved in 1969 or earlier (%) - White
Year householder moved into unit - Moved in 1969 or earlier (%) - Black or African American
Year householder moved into unit - Moved in 1969 or earlier (%) - Asian
Year householder moved into unit - Moved in 1969 or earlier (%) - Hispanic or Latino
Year householder moved into unit - Moved in 1969 or earlier (%) - American Indian and Alaska Native
Year householder moved into unit - Moved in 1969 or earlier (%) - Multirace
Year householder moved into unit - Moved in 1969 or earlier (%) - Other Race
Housing units lacking complete plumbing facilities (%)
Housing units lacking complete kitchen facilities (%)
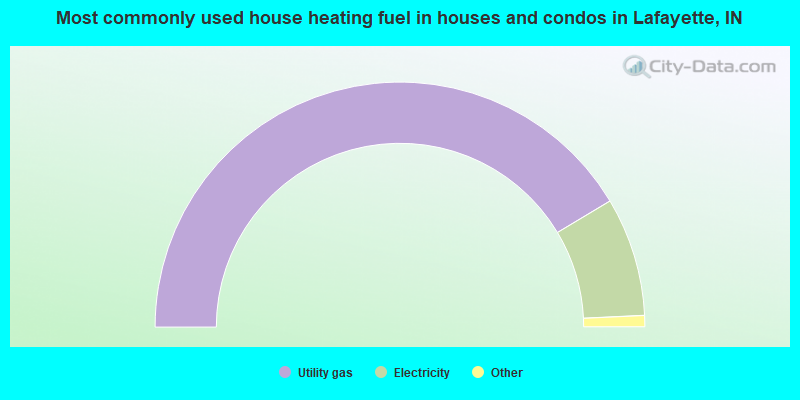
House heating fuel used in houses and condos - Utility gas (%)
House heating fuel used in houses and condos - Bottled, tank, or LP gas (%)
House heating fuel used in houses and condos - Electricity (%)
House heating fuel used in houses and condos - Fuel oil, kerosene, etc. (%)
House heating fuel used in houses and condos - Coal or coke (%)
House heating fuel used in houses and condos - Wood (%)
House heating fuel used in houses and condos - Solar energy (%)
House heating fuel used in houses and condos - Other fuel (%)
House heating fuel used in houses and condos - No fuel used (%)
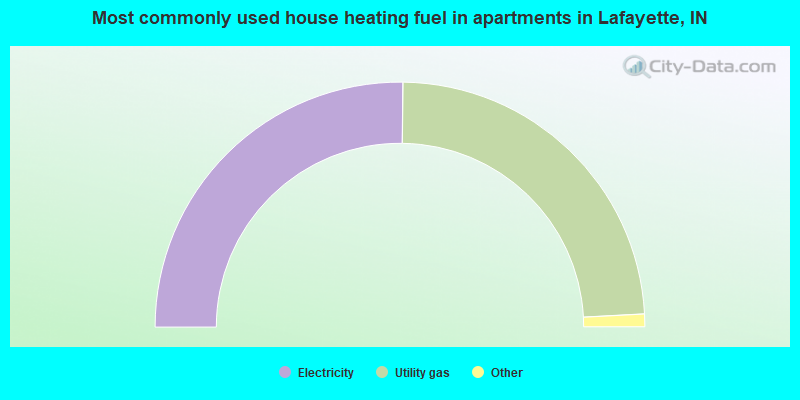
House heating fuel used in apartments - Utility gas (%)
House heating fuel used in apartments - Bottled, tank, or LP gas (%)
House heating fuel used in apartments - Electricity (%)
House heating fuel used in apartments - Fuel oil, kerosene, etc. (%)
House heating fuel used in apartments - Coal or coke (%)
House heating fuel used in apartments - Wood (%)
House heating fuel used in apartments - Solar energy (%)
House heating fuel used in apartments - Other fuel (%)
House heating fuel used in apartments - No fuel used (%)
Latest news about housing in Lafayette, IN collected exclusively by city-data.com from local newspapers, TV, and radio stations
Median year house/condo built: 1965Median year apartment built: 1979Household type by relationship:
Households: 72,326
Male householders: 14,021 (5,708 living alone ), Female householders: 18,583 (6,268 living alone )11,881 spouses (11,766 opposite-sex spouses ), 3,283 unmarried partners , (3,283 opposite-sex unmarried partners ), 19,444 children (18,253 natural , 273 adopted , 918 stepchildren ), 448 grandchildren , 184 brothers or sisters , 502 parents , 96 foster children , 546 other relatives , 1,881 non-relatives In group quarters: 1,457
Size of family households: 7,853 2-persons , 4,371 3-persons , 2,578 4-persons , 2,284 5-persons , 488 6-persons , 79 7-or-more-persons .
Size of nonfamily households: 11,976 1-person , 2,701 2-persons , 274 3-persons .
9,777 married couples with children. single-parent households (1,717 men , 5,152 women ).
88.9% of residents of Lafayette speak English at home. of residents speak Spanish at home (47% speak English very well , 27% speak English well , 24% speak English not well , 2% don't speak English at all ).of residents speak other Indo-European language at home (61% speak English very well , 16% speak English well , 23% speak English not well , 1% don't speak English at all ).of residents speak Asian or Pacific Island language at home (63% speak English very well , 10% speak English well , 25% speak English not well , 2% don't speak English at all ).of residents speak other language at home (42% speak English very well , 28% speak English well , 30% speak English not well ).
Foreign born population: 8,488 (11.7%)of them are naturalized citizens )
Median number of rooms in houses and condos:
Median number of rooms in apartments
Owner-occupied Renter-occupied
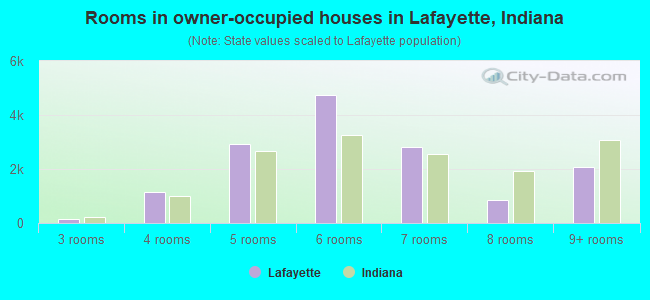
Rooms in owner-occupied houses in Lafayette, Indiana
0 1 room 0 2 rooms 166 3 rooms 1,151 4 rooms 2,928 5 rooms 4,755 6 rooms 2,829 7 rooms 852 8 rooms 2,069 9+ rooms
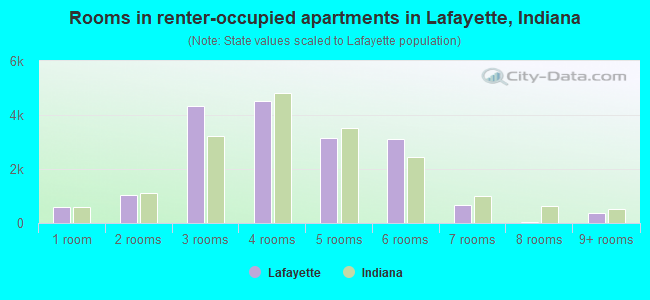
Rooms in renter-occupied apartments in Lafayette, Indiana
601 1 room 1,035 2 rooms 4,340 3 rooms 4,523 4 rooms 3,140 5 rooms 3,122 6 rooms 659 7 rooms 52 8 rooms 382 9+ rooms
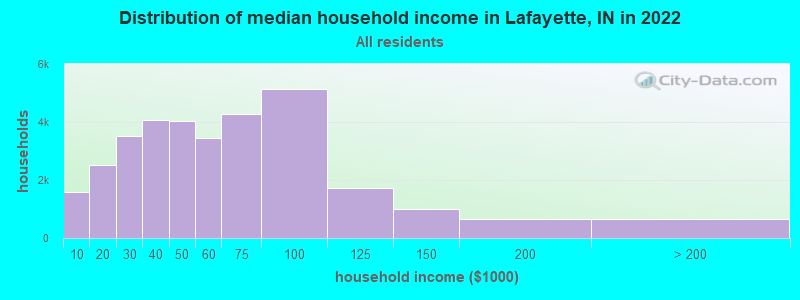
Lafayette, IN household income distribution 1,599 Less than $10,0002,518 $10,000 to $19,9993,502 $20,000 to $29,9994,054 $30,000 to $39,9994,020 $40,000 to $49,9993,451 $50,000 to $59,9994,270 $60,000 to $74,9995,136 $75,000 to $99,9991,734 $100,000 to $124,999996 $125,000 to $149,999667 $150,000 to $199,999657 $200,000 or more
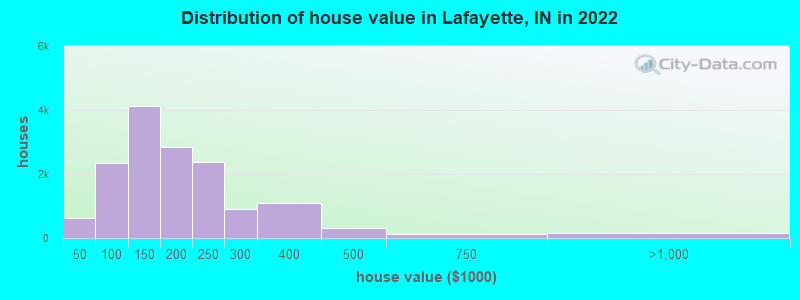
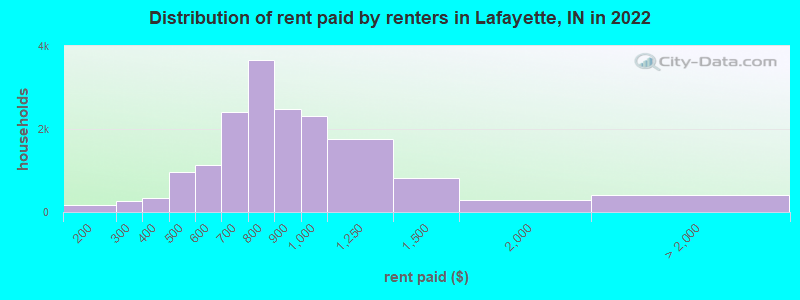
Home value of owner - occupied houses in 2022 in Lafayette, IN 68 Less than $10,000270 $10,000 to $14,99984 $15,000 to $19,99955 $20,000 to $24,999145 $40,000 to $49,99951 $50,000 to $59,999286 $60,000 to $69,999712 $70,000 to $79,999530 $80,000 to $89,999613 $90,000 to $99,9991,956 $100,000 to $124,9992,163 $125,000 to $149,9991,880 $150,000 to $174,999963 $175,000 to $199,9992,385 $200,000 to $249,999903 $250,000 to $299,9991,091 $300,000 to $399,999303 $400,000 to $499,999123 $500,000 to $749,999169 $750,000 to $999,999Rent paid by renters in 2022 in Lafayette, IN 7 Less than $10055 $100 to $149107 $150 to $19954 $200 to $249205 $250 to $29985 $300 to $349261 $350 to $399167 $400 to $449799 $450 to $499538 $500 to $549589 $550 to $5991,508 $600 to $649894 $650 to $6991,351 $700 to $7492,306 $750 to $7992,477 $800 to $8992,310 $900 to $9991,759 $1,000 to $1,249818 $1,250 to $1,499280 $1,500 to $1,99979 $2,000 to $2,4994 $2,500 to $2,999334 No cash rent
Percentage of workers working in this county: 90.5%Number of people working at home: 2,980 (8.4% of all workers )
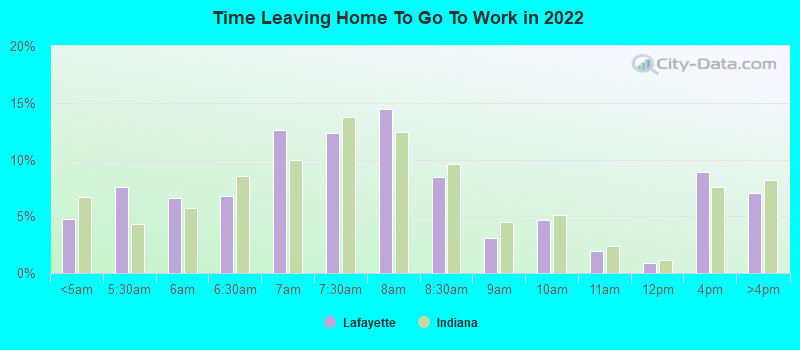
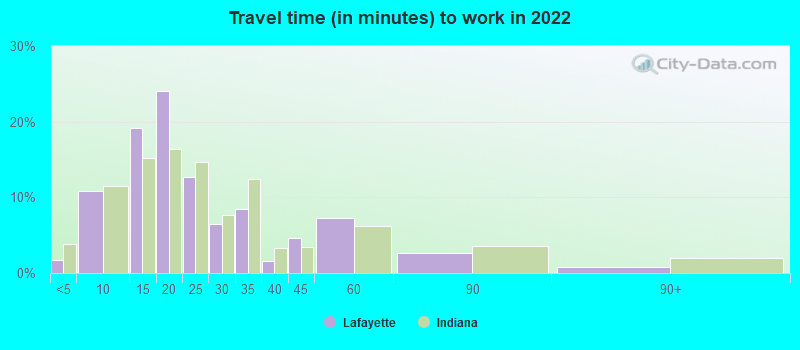
Travel time to work (commute)
Less than 5 minutes: 6275 to 9 minutes: 5,50510 to 14 minutes: 8,49415 to 19 minutes: 9,74520 to 24 minutes: 2,53325 to 29 minutes: 2,09430 to 34 minutes: 1,43535 to 39 minutes: 51940 to 44 minutes: 41645 to 59 minutes: 74660 to 89 minutes: 53790 or more minutes: 200
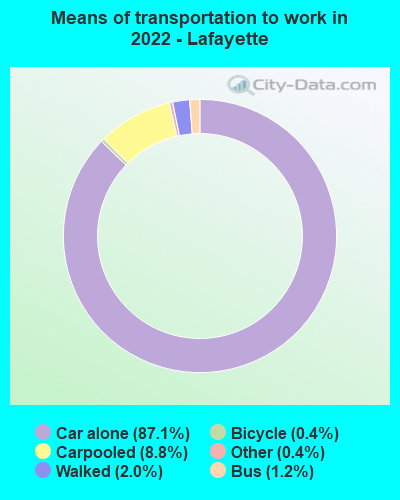
Means of transportation to work:
Drove a car alone: 47,585 (81.6%)Carpooled: 4,638 (8.0%)Bus : 637 (1.1%)Long-distance train or commuter rail : 10 (0.0%)Ferryboat: 6 (0.0%)Taxi: 285 (0.5%)Bicycle: 231 (0.4%)Walked: 1,140 (2.0%)Worked at home: 2,980 (5.1%)
Unemployment by race in 2022
Unemployment rate for White non-Hispanic residents 3.0% Males3.2% FemalesUnemployment rate for Black residents 4.0% Males14.1% FemalesUnemployment rate for American Indian and Alaska Native residents 22.1% MalesUnemployment rate for Asian residents 4.7% MalesUnemployment rate for other race residents 0.5% MalesUnemployment rate for two or more race residents 1.3% Males9.7% FemalesUnemployment rate for Hispanic or Latino residents 1.0% Males3.0% Females
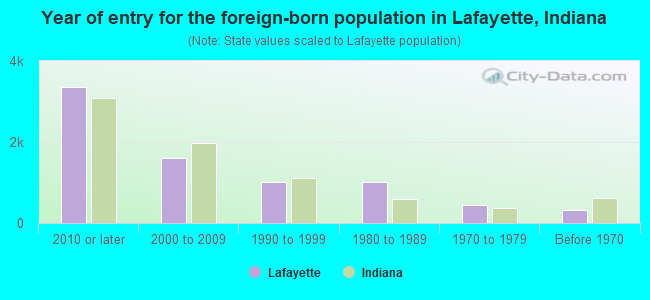
Year of entry for the foreign-born population in Lafayette, Indiana
3,349 2010 or later 1,597 2000 to 2009 1,021 1990 to 1999 1,018 1980 to 1989 455 1970 to 1979 315 Before 1970
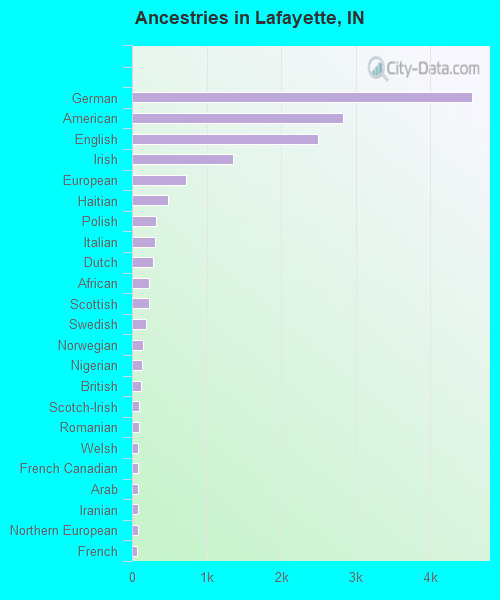
First ancestries reported:
German: 4,558 (17.0%)
American: 2,826 (10.5%)
English: 2,495 (9.3%)
Irish: 1,359 (5.1%)
European: 718 (2.7%)
Haitian: 489 (1.8%)
Polish: 327 (1.2%)
Italian: 313 (1.2%)
Dutch: 287 (1.1%)
African: 232 (0.9%)
Scottish: 225 (0.8%)
Swedish: 186 (0.7%)
Norwegian: 142 (0.5%)
Nigerian: 128 (0.5%)
British: 122 (0.5%)
Scotch-Irish: 99 (0.4%)
Romanian: 99 (0.4%)
Welsh: 85 (0.3%)
French Canadian: 82 (0.3%)
Arab: 80 (0.3%)
Iranian: 80 (0.3%)
Northern European: 80 (0.3%)
French: 66 (0.2%)
Ukrainian: 32 (0.1%)
Hungarian: 25 (0.09%)
Portuguese: 24 (0.09%)
Scandinavian: 22 (0.08%)
Lithuanian: 21 (0.08%)
Greek: 20 (0.07%)
Slovak: 19 (0.07%)
Albanian: 15 (0.06%)
Canadian: 15 (0.06%)
Czech: 13 (0.05%)
Russian: 12 (0.04%)
Sudanese: 11 (0.04%)
Jamaican: 10 (0.04%)
Lebanese: 9 (0.03%)
Slavic: 9 (0.03%)
Swiss: 8 (0.03%)
Pennsylvania German: 6 (0.02%)
Eastern European: 4 (0.01%)
Moroccan: 4 (0.01%) Most common places of birth for foreign-born residents (%): Mexico Lafayette:
38.5% (2,572)Indiana:
27.0% (101,996)
India Lafayette:
10.9% (729)Indiana:
8.5% (32,127)
Haiti Lafayette:
7.0% (468)Indiana:
1.2% (4,484)
Guatemala Lafayette:
6.4% (430)Indiana:
2.3% (8,656)
Panama Lafayette:
4.1% (274)Indiana:
0.3% (977)
Japan Lafayette:
3.9% (263)Indiana:
1.2% (4,520)
China, excluding Hong Kong and Taiwan Lafayette:
3.4% (225)Indiana:
5.3% (19,877)
United Kingdom, excluding England and Scotland Lafayette:
2.1% (137)Indiana:
0.7% (2,504)
Switzerland Lafayette:
1.8% (123)Indiana:
0.1% (336)
Canada Lafayette:
1.7% (111)Indiana:
2.1% (7,834)
Laos Lafayette:
1.6% (109)Indiana:
0.2% (921)
Nigeria Lafayette:
1.6% (105)Indiana:
3.3% (12,337)
Saudi Arabia Lafayette:
1.5% (103)Indiana:
0.4% (1,388)
Place of birth for U.S.-born residents:
This state: 45,435Other state: 18,059Northeast: 1,798Midwest: 10,595South: 4,347West: 1,319 81.9% of Lafayette residents lived in the same house 1 years ago.
Out of people who lived in different houses, 39.3% lived in this county.
Out of people who lived in different counties, 52.9% lived in Indiana.
Lafayette:
81.9%State average:
87.1%
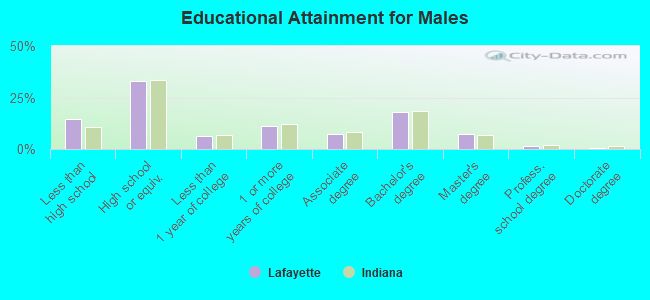
Education attainment for males 25 years and older:
No schooling: 476Nursery to 4th grade: 05th and 6th grade: 3877th and 8th grade: 7429th grade: 37910th grade: 58711th grade: 44112th grade, no diploma: 391High school graduate (or equivalency): 7,636Less than 1 year of college: 1,413Some college more than 1 year, no degree: 2,572Associate degree: 1,717Bachelor's degree: 4,177Master's degree: 1,694Professional school degree: 350Doctorate degree: 110
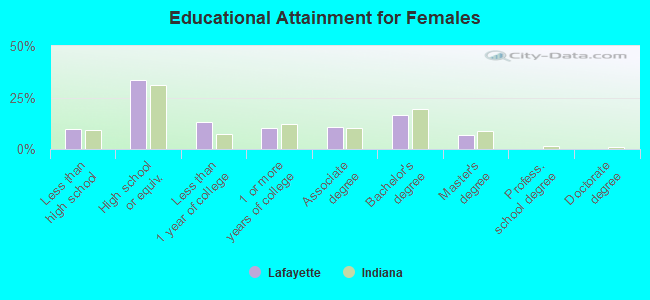
Education attainment for females 25 years and older:
No schooling: 384Nursery to 4th grade: 05th and 6th grade: 2527th and 8th grade: 7029th grade: 4210th grade: 16911th grade: 41712th grade, no diploma: 311High school graduate (or equivalency): 8,035Less than 1 year of college: 3,096Some college more than 1 year, no degree: 2,459Associate degree: 2,528Bachelor's degree: 3,916Master's degree: 1,676Professional school degree: 0Doctorate degree: 30
Housing units in structures:
One, detached: 19,612One, attached: 985Two: 2,4703 or 4: 2,8095 to 9: 4,10110 to 19: 2,06420 to 49: 60750 or more: 1,139Mobile homes: 452Median worth of mobile homes: $22,516
Housing units lacking complete plumbing facilities in 2022: 0.5%Housing units lacking complete kitchen facilities in 2022: 1.3%House/condo owner moved in on average 9 years ago
Renter moved in on average 2 years ago
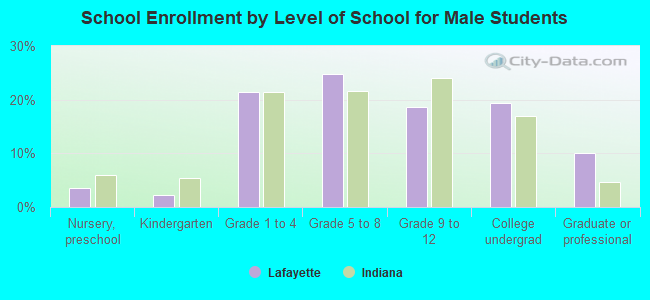
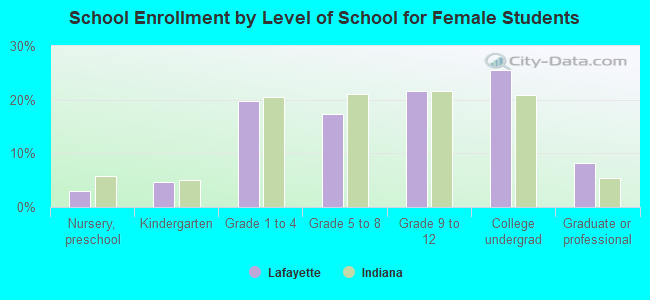
Private vs. public school enrollment:
Students in private schools in grades 1 to 8 (elementary and middle school): 734 Students in private schools in grades 9 to 12 (high school): 272 Students in private undergraduate colleges: 238