Housing density: 1,014 houses/condos per square mile
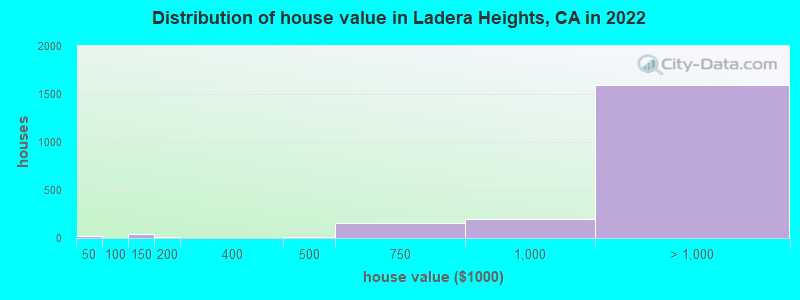
Median price asked for vacant for-sale houses and condos in 2022: $1,085,369.
Median contract rent in 2022: over $2,000 (lower quartile is $1,856, upper quartile is over $2,000)
Median rent asked for vacant for-rent units in 2022: $6,698
Median gross rent in Ladera Heights, CA in 2022: over $2,000
Housing units in Ladera Heights with a mortgage: 1,222 (185 second mortgage, 0 home equity loan, 183 both second mortgage and home equity loan) Houses without a mortgage: 0
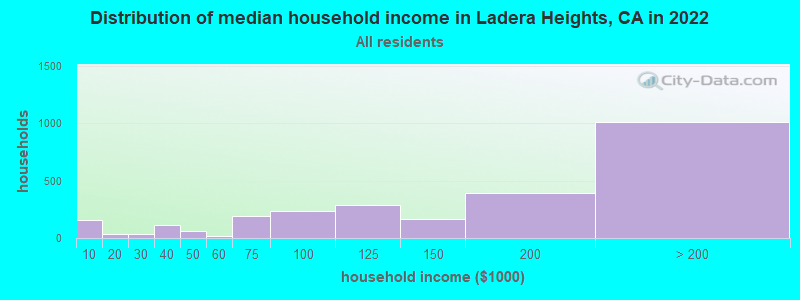
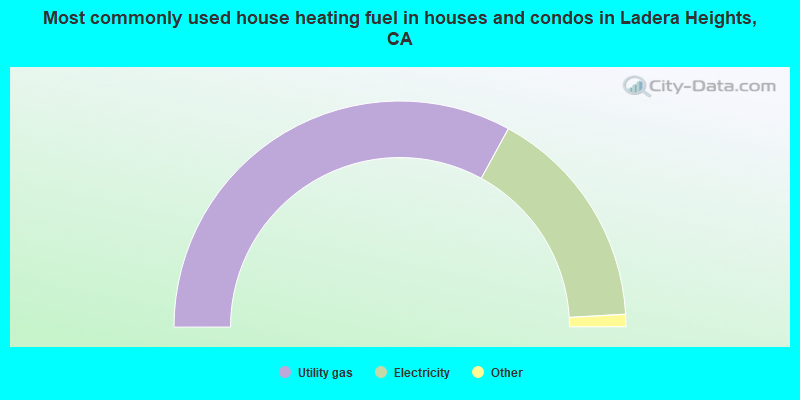
Median household income for houses/condos with a mortgage: $185,090
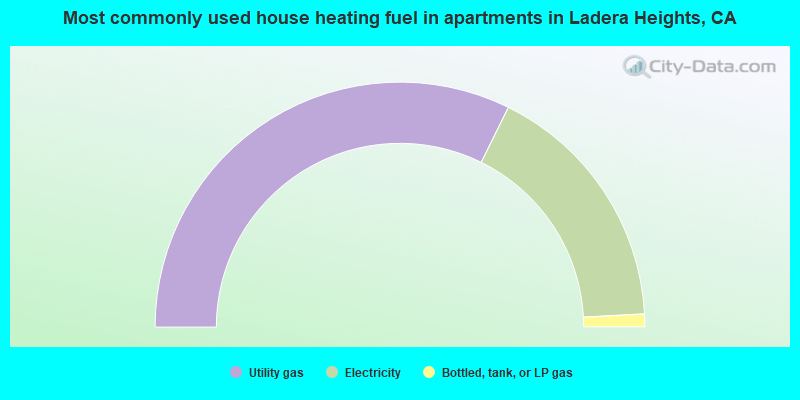
Median household income for apartments without a mortgage: $89,494
Median monthly housing costs: $2,935
Compare current foreclosures near Ladera Heights, CA:
Size of family households: 888 2-persons, 534 3-persons, 242 4-persons, 125 5-persons, 42 6-persons.
Size of nonfamily households: 644 1-person, 233 2-persons.
715 married couples with children.
248 single-parent households (73 men, 175 women).
83.9% of residents of Ladera Heights speak English at home.
6.6% of residents speak Spanish at home (99% speak English very well, 1% speak English well).
7.4% of residents speak other Indo-European language at home (96% speak English very well, 4% speak English well).
1.5% of residents speak Asian or Pacific Island language at home (100% speak English very well).
1.3% of residents speak other language at home (74% speak English very well, 26% speak English well).
Foreign born population: 674 (10.3%)
(70.6% of them are naturalized citizens)
Percentage of workers working in this county: 97.9% Number of people working at home: 915 (26.7% of all workers)
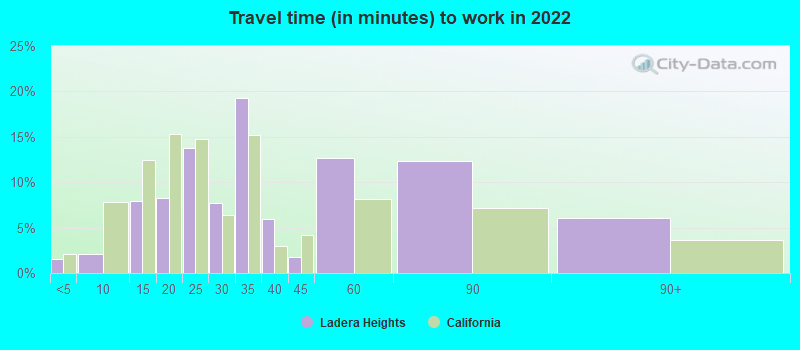
Travel time to work (commute)
Less than 5 minutes: 33
5 to 9 minutes: 72
10 to 14 minutes: 68
15 to 19 minutes: 187
20 to 24 minutes: 423
25 to 29 minutes: 207
30 to 34 minutes: 777
35 to 39 minutes: 269
40 to 44 minutes: 80
45 to 59 minutes: 375
60 to 89 minutes: 101
90 or more minutes: 33
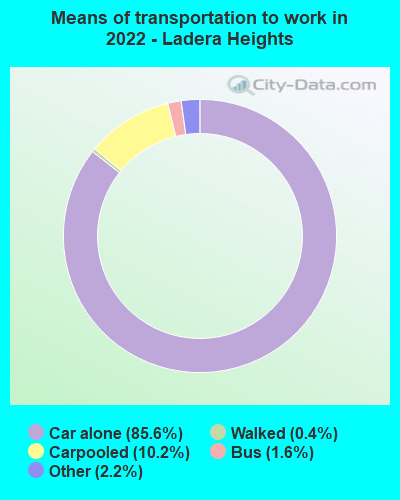
Means of transportation to work:
Drove a car alone: 1,722 (60.8%)
Carpooled: 226 (8.0%)
Bus: 29 (1.0%)
Taxi: 48 (1.7%)
Walked: 9 (0.3%)
Worked at home: 915 (32.3%)
Unemployment by race in 2022
Unemployment rate for White non-Hispanic residents
7.9%Males
Unemployment rate for Black residents
3.8%Females
Unemployment rate for Asian residents
24.8%Males
Unemployment rate for two or more race residents
4.4%Males
4.6%Females
Year of entry for the foreign-born population in Ladera Heights, California
2312010 or later
1652000 to 2009
751990 to 1999
951980 to 1989
1201970 to 1979
119Before 1970
First ancestries reported:
African: 183 (4.6%)
Iranian: 119 (3.0%)
French: 96 (2.4%)
Haitian: 89 (2.2%)
Italian: 70 (1.8%)
Ethiopian: 69 (1.7%)
Irish: 66 (1.7%)
English: 65 (1.6%)
Norwegian: 51 (1.3%)
American: 49 (1.2%)
Armenian: 46 (1.2%)
Nigerian: 29 (0.7%)
West Indian: 18 (0.5%)
British West Indian: 16 (0.4%)
Trinidadian and Tobagonian: 15 (0.4%)
Jordanian: 13 (0.3%)
Polish: 12 (0.3%)
Most common places of birth for foreign-born residents (%):
India
Ladera Heights:
15.7% (106)
California:
5.2% (539,184)
Belize
Ladera Heights:
9.1% (61)
California:
0.2% (15,693)
France
Ladera Heights:
8.3% (56)
California:
0.4% (40,224)
Jamaica
Ladera Heights:
8.0% (54)
California:
0.2% (15,939)
Korea
Ladera Heights:
7.9% (53)
California:
3.0% (315,248)
Iran
Ladera Heights:
7.4% (50)
California:
2.0% (206,004)
Other Central America
Ladera Heights:
6.7% (45)
California:
0.0% (2,486)
England
Ladera Heights:
4.6% (31)
California:
0.6% (57,953)
Haiti
Ladera Heights:
4.5% (30)
California:
0.1% (5,330)
Nigeria
Ladera Heights:
4.0% (27)
California:
0.3% (35,557)
Other Caribbean
Ladera Heights:
3.7% (25)
California:
0.0% (1,988)
Ethiopia
Ladera Heights:
3.3% (22)
California:
0.2% (24,635)
Singapore
Ladera Heights:
3.1% (21)
California:
0.1% (10,213)
Jordan
Ladera Heights:
3.0% (20)
California:
0.2% (16,384)
Mexico
Ladera Heights:
2.7% (18)
California:
37.2% (3,881,193)
Guatemala
Ladera Heights:
2.4% (16)
California:
2.8% (290,436)
Place of birth for U.S.-born residents:
This state: 3,805
Other state: 2,007
Northeast: 357
Midwest: 595
South: 810
West: 243
90.3% of Ladera Heights residents lived in the same house 1 years ago. Out of people who lived in different houses, 44.5% lived in this county. Out of people who lived in different counties, 0.0% lived in California.
Ladera Heights:
90.3%
State average:
88.9%
Education attainment for males 25 years and older:
No schooling: 0
Nursery to 4th grade: 2
5th and 6th grade: 0
7th and 8th grade: 0
9th grade: 0
10th grade: 0
11th grade: 48
12th grade, no diploma: 0
High school graduate (or equivalency): 217
Less than 1 year of college: 59
Some college more than 1 year, no degree: 428
Associate degree: 138
Bachelor's degree: 776
Master's degree: 304
Professional school degree: 131
Doctorate degree: 97
Education attainment for females 25 years and older:
No schooling: 74
Nursery to 4th grade: 0
5th and 6th grade: 0
7th and 8th grade: 0
9th grade: 0
10th grade: 0
11th grade: 113
12th grade, no diploma: 10
High school graduate (or equivalency): 135
Less than 1 year of college: 78
Some college more than 1 year, no degree: 260
Associate degree: 355
Bachelor's degree: 991
Master's degree: 739
Professional school degree: 113
Doctorate degree: 49
Housing units in structures:
One, detached: 1,868
One, attached: 291
Two: 65
3 or 4: 233
5 to 9: 146
10 to 19: 131
20 to 49: 86
50 or more: 162
House/condo owner moved in on average 21 years ago