La Salle, IL (Illinois) Houses and Residents
| La Salle: | $107,860 |
| Illinois: | $251,600 |
Total population: 9,328 (All urban)
Houses: 4,444 (4,088 occupied: 2,527 owner occupied, 1,565 renter occupied)
| % of renters here: | 38% |
| State: | 33% |
Housing density: 700 houses/condos per square mile
Median price asked for vacant for-sale houses and condos in 2022: $170,983.
Median contract rent in 2022: $731 (lower quartile is $622, upper quartile is $851)
Median rent asked for vacant for-rent units in 2022: $1,404
Median gross rent in La Salle, IL in 2022: $987
Housing units in La Salle with a mortgage: 1,310 (58 second mortgage, 0 home equity loan, 5 both second mortgage and home equity loan)
Houses without a mortgage: 12
Median household income for houses/condos with a mortgage: $79,972
Median household income for apartments without a mortgage: $39,708
Median monthly housing costs: $910
Compare current foreclosures near La Salle, IL:
| Photo | Address | Area | Beds / Baths | Price | Details |
|---|---|---|---|---|---|

|
#1
2nd St
La Salle, IL 61301
|
- sq. feet
|
2 baths 3 beds |
show details | |

|
#2
9th St
La Salle, IL 61301
|
2,771 sq. feet
|
- baths - beds |
show details | |

|
#3
3rd St Apt 4
La Salle, IL 61301
|
- sq. feet
|
- baths - beds |
show details | |

|
#4
Grant Ave Apt 114
La Salle, IL 61301
|
- sq. feet
|
- baths - beds |
show details | |

|
#5
6th St
La Salle, IL 61301
|
- sq. feet
|
- baths - beds |
show details | |

|
#6
Oak Ridge Dr
La Salle, IL 61301
|
- sq. feet
|
- baths - beds |
show details | |

|
#7
2nd St
La Salle, IL 61301
|
- sq. feet
|
- baths - beds |
show details | |

|
#8
Crosat St
La Salle, IL 61301
|
- sq. feet
|
- baths - beds |
show details | |

|
#9
Tonti St
La Salle, IL 61301
|
- sq. feet
|
- baths - beds |
show details | |

|
#10
Campbell Ave
La Salle, IL 61301
|
- sq. feet
|
- baths - beds |
show details |
| Photo | Address | Area | Beds / Baths | Price | Details |
|---|---|---|---|---|---|

|
#11
Lafayette St
La Salle, IL 61301
|
- sq. feet
|
- baths - beds |
show details | |

|
#12
Campbell Ave
La Salle, IL 61301
|
- sq. feet
|
- baths - beds |
show details | |

|
#13
Sterling St
La Salle, IL 61301
|
- sq. feet
|
- baths - beds |
show details | |

|
#14
Tonti St
La Salle, IL 61301
|
- sq. feet
|
- baths - beds |
show details | |

|
#15
Laharpe St
La Salle, IL 61301
|
- sq. feet
|
- baths - beds |
show details | |

|
#16
Malcolm Ave
La Salle, IL 61301
|
- sq. feet
|
- baths - beds |
show details | |

|
#17
Creve Coeur St
La Salle, IL 61301
|
- sq. feet
|
- baths - beds |
show details | |

|
#18
Conservation Ct
La Salle, IL 61301
|
- sq. feet
|
- baths - beds |
show details | |

|
#19
Creve Coeur St
La Salle, IL 61301
|
- sq. feet
|
- baths - beds |
show details | |

|
#20
Crosat St
La Salle, IL 61301
|
- sq. feet
|
- baths - beds |
show details |
| Photo | Address | Area | Beds / Baths | Price | Details |
|---|---|---|---|---|---|

|
#21
Oconor Ave
La Salle, IL 61301
|
- sq. feet
|
- baths - beds |
show details | |

|
#22
Palmor Dr
Ottawa, IL 61350
|
1,340 sq. feet
|
1 baths 2 beds |
show details | |

|
#23
Anita Dr
Ottawa, IL 61350
|
1,344 sq. feet
|
1 baths 3 beds |
show details | |

|
#24
Caton Rd
Ottawa, IL 61350
|
1,258 sq. feet
|
1 baths 3 beds |
show details | |

|
#25
State St
Ottawa, IL 61350
|
1,444 sq. feet
|
2 baths 3 beds |
show details | |

|
#26
Lincoln St
Seatonville, IL 61359
|
2,308 sq. feet
|
3 baths 4 beds |
show details | |

|
#27
E Main St
Granville, IL 61326
|
2,691 sq. feet
|
3 baths 5 beds |
show details | |

|
#28
E 4th St
Spring Valley, IL 61362
|
- sq. feet
|
1 baths 3 beds |
show details | |

|
#29
1st Ave
Ottawa, IL 61350
|
1,152 sq. feet
|
1 baths 2 beds |
show details | |

|
#30
2400 North Ave # -
La Moille, IL 61330
|
1,700 sq. feet
|
1 baths 4 beds |
show details |
| Photo | Address | Area | Beds / Baths | Price | Details |
|---|---|---|---|---|---|

|
#31
Pike St
Peru, IL 61354
|
672 sq. feet
|
- baths - beds |
show details | |

|
#32
E 4th St
Depue, IL 61322
|
- sq. feet
|
- baths - beds |
show details | |

|
#33
E 4th St
Depue, IL 61322
|
- sq. feet
|
- baths - beds |
show details | |

|
#34
Gary St
Leonore, IL 61332
|
- sq. feet
|
- baths - beds |
show details | |

|
#35
Fillmore St
Ottawa, IL 61350
|
- sq. feet
|
- baths - beds |
show details | |

|
#36
N 17th Rd
Tonica, IL 61370
|
- sq. feet
|
- baths - beds |
show details | |

|
#37
Pontiac St
Tonica, IL 61370
|
- sq. feet
|
- baths - beds |
show details | |

|
#38
Columbus St Apt 7
Ottawa, IL 61350
|
- sq. feet
|
- baths - beds |
show details | |

|
#39
W Fremont St
Ottawa, IL 61350
|
- sq. feet
|
- baths - beds |
show details | |

|
#40
2nd St
Mark, IL 61340
|
- sq. feet
|
- baths - beds |
show details |
| Photo | Address | Area | Beds / Baths | Price | Details |
|---|---|---|---|---|---|

|
#41
2nd Ave
Mendota, IL 61342
|
- sq. feet
|
- baths - beds |
show details | |

|
#42
Catherine St
Ottawa, IL 61350
|
- sq. feet
|
- baths - beds |
show details | |

|
#43
E High St
Hennepin, IL 61327
|
- sq. feet
|
- baths - beds |
show details | |

|
#44
E 1919th Rd
Ottawa, IL 61350
|
- sq. feet
|
- baths - beds |
show details | |

|
#45
N State Route 23
Ottawa, IL 61350
|
- sq. feet
|
- baths - beds |
show details | |

|
#46
6th Ave
Mendota, IL 61342
|
- sq. feet
|
- baths - beds |
show details | |

|
#47
Monroe St Apt B
Mendota, IL 61342
|
- sq. feet
|
- baths - beds |
show details | |

|
#48
4th Ave
Mendota, IL 61342
|
- sq. feet
|
- baths - beds |
show details | |

|
#49
4th Ave
Mendota, IL 61342
|
- sq. feet
|
- baths - beds |
show details | |

|
Check over 1 million property listings on Foreclosure.com!
|
browse all offers | |||

 | La Salle or Peru (23 replies) |
| The apartments at 1100 N LaSalle? (2 replies) |
| Moving to Chicago, looking for best place to stay, Indian Community (4 replies) |
| Looking to move to Canaryville in Chicago. (22 replies) |
| High School Admissions Hysteria -- Does Chicago Have It Too? (32 replies) |
| hidden food gems and what do transplants from Chicago miss (food wise) (56 replies) |

Median year apartment built: 1955
Household type by relationship:
Households: 9,438- Male householders: 1,946 (720 living alone), Female householders: 2,086 (627 living alone)
1,506 spouses (1,506 opposite-sex spouses), 384 unmarried partners, (384 opposite-sex unmarried partners), 2,767 children (2,642 natural, 31 adopted, 93 stepchildren), 103 grandchildren, 71 brothers or sisters, 5 parents, 0 foster children, 204 other relatives, 104 non-relatives
- In group quarters: 256
Size of family households: 1,266 2-persons, 462 3-persons, 577 4-persons, 134 5-persons, 51 6-persons.
Size of nonfamily households: 1,397 1-person, 187 2-persons, 8 3-persons.
871 married couples with children.
1,014 single-parent households (115 men, 899 women).
87.0% of residents of La Salle speak English at home.
10.5% of residents speak Spanish at home (56% speak English very well, 40% speak English well, 5% speak English not well).
2.1% of residents speak other Indo-European language at home (65% speak English very well, 26% speak English well, 9% speak English not well).
0.3% of residents speak Asian or Pacific Island language at home (100% speak English very well).
Foreign born population: 643 (6.8%)
(41.7% of them are naturalized citizens)
| Here: | 5.8 |
| State: | 6.4 |
| Here: | 4.5 |
| State: | 4.1 |

- Bedrooms in owner-occupied houses and condos in La Salle, Illinois
- 0no bedroom
- 871 bedroom
- 7572 bedrooms
- 1,3533 bedrooms
- 2134 bedrooms
- 1165+ bedrooms

- Bedrooms in renter-occupied apartments in La Salle, Illinois
- 50no bedroom
- 2231 bedroom
- 9492 bedrooms
- 2753 bedrooms
- 684 bedrooms
- 05+ bedrooms

- Cars and other vehicles available in La Salle in owner-occupied houses/condos
- 122no vehicle
- 9371 vehicle
- 9042 vehicles
- 4473 vehicles
- 924 vehicles
- 265+ vehicles

- Cars and other vehicles available in La Salle in renter-occupied apartments
- 300no vehicle
- 7441 vehicle
- 4912 vehicles
- 223 vehicles
- 94 vehicles
- 05+ vehicles

- Rooms in owner-occupied houses in La Salle, Illinois
- 01 room
- 292 rooms
- 563 rooms
- 2074 rooms
- 8205 rooms
- 5496 rooms
- 4137 rooms
- 1758 rooms
- 2779+ rooms

- Rooms in renter-occupied apartments in La Salle, Illinois
- 481 room
- 702 rooms
- 1463 rooms
- 4904 rooms
- 4045 rooms
- 2836 rooms
- 427 rooms
- 548 rooms
- 289+ rooms


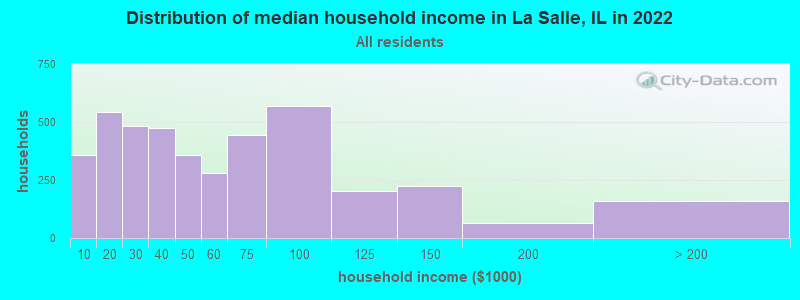
La Salle, IL household income distribution

- 359Less than $10,000
- 543$10,000 to $19,999
- 484$20,000 to $29,999
- 475$30,000 to $39,999
- 357$40,000 to $49,999
- 280$50,000 to $59,999
- 446$60,000 to $74,999
- 567$75,000 to $99,999
- 202$100,000 to $124,999
- 222$125,000 to $149,999
- 63$150,000 to $199,999
- 160$200,000 or more
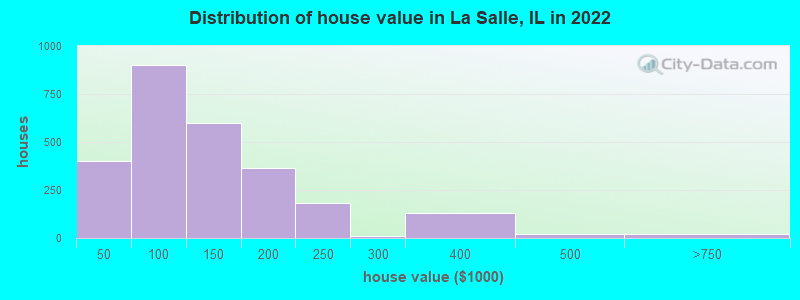
Home value of owner - occupied houses in 2022 in La Salle, IL
-
- 71Less than $10,000
- 24$10,000 to $14,999
- 7$15,000 to $19,999
- 47$25,000 to $29,999
- 35$30,000 to $34,999
- 8$35,000 to $39,999
- 203$40,000 to $49,999
- 54$50,000 to $59,999
- 228$60,000 to $69,999
- 121$70,000 to $79,999
- 128$80,000 to $89,999
- 163$90,000 to $99,999
- 345$100,000 to $124,999
- 254$125,000 to $149,999
- 238$150,000 to $174,999
- 126$175,000 to $199,999
- 183$200,000 to $249,999
- 10$250,000 to $299,999
- 129$300,000 to $399,999
- 21$400,000 to $499,999
- 9$500,000 to $749,999
- 3$1,500,000 to $1,999,999
- 6$2,000,000 or more
Rent paid by renters in 2022 in La Salle, IL
-
- 9Less than $100
- 46$150 to $199
- 23$250 to $299
- 5$350 to $399
- 42$400 to $449
- 96$450 to $499
- 51$500 to $549
- 41$550 to $599
- 188$600 to $649
- 90$650 to $699
- 194$700 to $749
- 111$750 to $799
- 160$800 to $899
- 135$900 to $999
- 101$1,000 to $1,249
- 26$1,250 to $1,499
- 6$1,500 to $1,999
- 97No cash rent


Percentage of workers working in this county: 82.0%
Number of people working at home: 124 (2.7% of all workers)
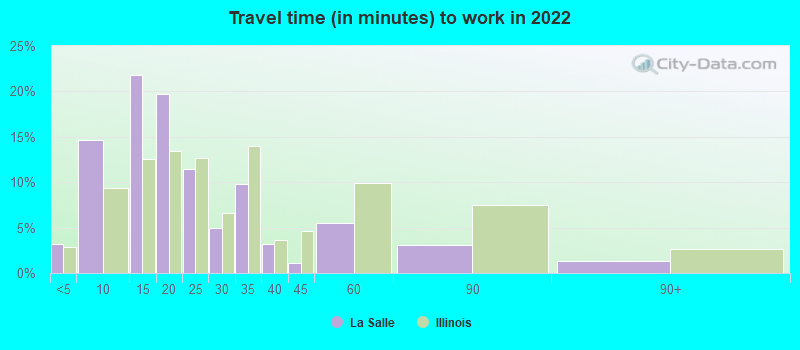
Travel time to work (commute)
- Less than 5 minutes: 116
- 5 to 9 minutes: 957
- 10 to 14 minutes: 1,092
- 15 to 19 minutes: 589
- 20 to 24 minutes: 393
- 25 to 29 minutes: 292
- 30 to 34 minutes: 361
- 35 to 39 minutes: 42
- 40 to 44 minutes: 108
- 45 to 59 minutes: 61
- 60 to 89 minutes: 240
- 90 or more minutes: 33
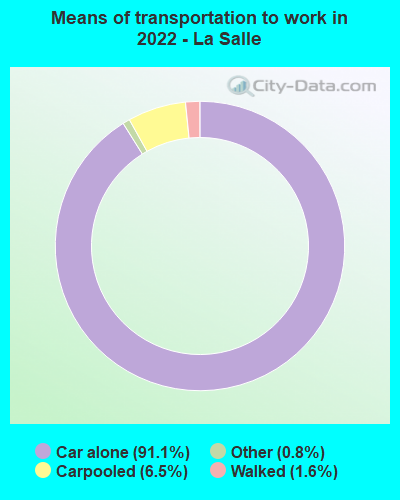
Means of transportation to work:
- Drove a car alone: 3,171 (89.3%)
- Carpooled: 204 (5.7%)
- Taxi: 64 (1.8%)
- Walked: 42 (1.2%)
- Worked at home: 76 (2.1%)

- Unemployment by race in 2022
- Unemployment rate for White non-Hispanic residents
- 4.9%Males
- 3.8%Females
- Unemployment rate for two or more race residents
- 8.8%Males
- 0.5%Females
- Unemployment rate for Hispanic or Latino residents
- 3.2%Males

- Year of entry for the foreign-born population in La Salle, Illinois
- 552010 or later
- 1112000 to 2009
- 2651990 to 1999
- 391980 to 1989
- 601970 to 1979
- 72Before 1970

First ancestries reported:
- German: 643 (15.9%)
- American: 305 (7.6%)
- Irish: 286 (7.1%)
- Welsh: 271 (6.7%)
- Italian: 230 (5.7%)
- English: 150 (3.7%)
- Polish: 114 (2.8%)
- African: 95 (2.4%)
- Slovene: 58 (1.4%)
- European: 53 (1.3%)
- Australian: 45 (1.1%)
- Russian: 44 (1.1%)
- Czech: 43 (1.1%)
- Norwegian: 42 (1.0%)
- French Canadian: 37 (0.9%)
- Belgian: 34 (0.8%)
- Greek: 25 (0.6%)
- Portuguese: 23 (0.6%)
- Slavic: 18 (0.4%)
- Lithuanian: 15 (0.4%)
- Scotch-Irish: 14 (0.3%)
- French: 13 (0.3%)
- Slovak: 12 (0.3%)
- Scottish: 11 (0.3%)
- Dutch: 10 (0.2%)
- Swedish: 8 (0.2%)
- Croatian: 1 (0.02%)
- Yugoslavian: 1 (0.02%)
Most common places of birth for foreign-born residents (%):
| La Salle: | 56.7% (299) |
| Illinois: | 34.7% (626,958) |
| La Salle: | 9.9% (52) |
| Illinois: | 0.9% (16,308) |
| La Salle: | 8.0% (42) |
| Illinois: | 5.2% (93,003) |
| La Salle: | 7.2% (38) |
| Illinois: | 1.0% (18,753) |
| La Salle: | 6.1% (32) |
| Illinois: | 0.6% (11,009) |
| La Salle: | 3.6% (19) |
| Illinois: | 1.6% (29,519) |
| La Salle: | 2.5% (13) |
| Illinois: | 6.9% (124,474) |
| La Salle: | 2.3% (12) |
| Illinois: | 0.6% (10,776) |
| La Salle: | 2.1% (11) |
| Illinois: | 0.5% (9,671) |
Place of birth for U.S.-born residents:
- This state: 7,481
- Other state: 1,257
- Northeast: 132
- Midwest: 569
- South: 286
- West: 193
92.7% of La Salle residents lived in the same house 1 years ago.
Out of people who lived in different houses, 39.3% lived in this county.
Out of people who lived in different counties, 65.3% lived in Illinois.
| La Salle: | 92.7% |
| State average: | 88.3% |
Education attainment for males 25 years and older:
- No schooling: 178
- Nursery to 4th grade: 0
- 5th and 6th grade: 0
- 7th and 8th grade: 80
- 9th grade: 48
- 10th grade: 72
- 11th grade: 68
- 12th grade, no diploma: 16
- High school graduate (or equivalency): 1,372
- Less than 1 year of college: 474
- Some college more than 1 year, no degree: 399
- Associate degree: 198
- Bachelor's degree: 256
- Master's degree: 118
- Professional school degree: 14
- Doctorate degree: 25

Education attainment for females 25 years and older:
- No schooling: 67
- Nursery to 4th grade: 79
- 5th and 6th grade: 25
- 7th and 8th grade: 16
- 9th grade: 0
- 10th grade: 54
- 11th grade: 116
- 12th grade, no diploma: 63
- High school graduate (or equivalency): 1,278
- Less than 1 year of college: 387
- Some college more than 1 year, no degree: 355
- Associate degree: 348
- Bachelor's degree: 313
- Master's degree: 114
- Professional school degree: 33
- Doctorate degree: 12


Housing units in structures:
- One, detached: 3,392
- One, attached: 154
- Two: 223
- 3 or 4: 353
- 5 to 9: 82
- 10 to 19: 82
- 20 to 49: 36
- 50 or more: 85
- Mobile homes: 36
Median worth of mobile homes: $15,051
Housing units lacking complete kitchen facilities in 2022: 1.7%
House/condo owner moved in on average 18 years ago
Renter moved in on average 1 years ago

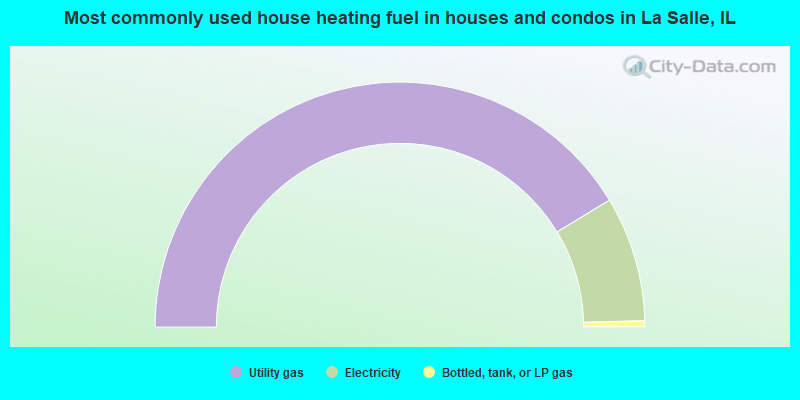
- 82.6%Utility gas
- 16.5%Electricity
- 0.8%Bottled, tank, or LP gas
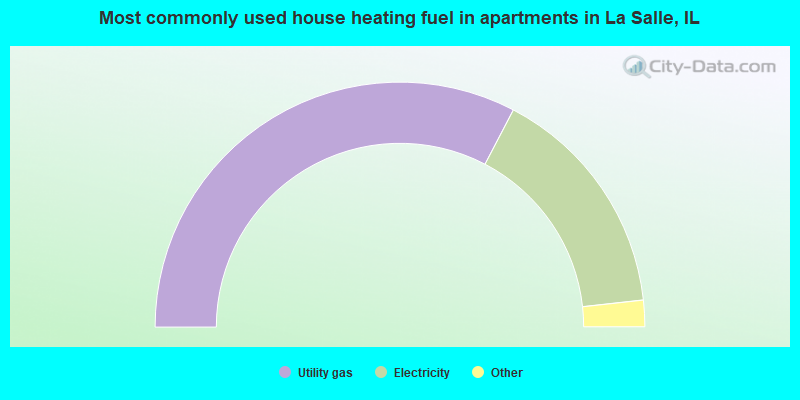
- 65.4%Utility gas
- 31.2%Electricity
- 1.9%No fuel used
- 1.5%Bottled, tank, or LP gas
Private vs. public school enrollment:
| Here: | 24.1% |
| Illinois: | 13.3% |
| Here: | 20.8% |
| Illinois: | 9.9% |
| Here: | 26.1% |
| Illinois: | 27.4% |


