La Puente, CA (California) Houses and Residents
| La Puente: | $618,118 |
| California: | $715,900 |
Mean price in 2022:
Detached houses: $563,800
Here: $563,800 State: $988,808 Townhouses or other attached units: $482,936
Here: $482,936 State: $838,546 In 3-to-4-unit structures: $319,980
Here: $319,980 State: $824,253 In 5-or-more-unit structures: $260,249
Here: $260,249 State: $730,996 Mobile homes: $241,753
Here: $241,753 State: $184,506
Total population: 40,735 (All urban)
Houses: 10,009 (9,738 occupied: 5,889 owner occupied, 3,885 renter occupied)
| % of renters here: | 40% |
| State: | 44% |
Housing density: 2,866 houses/condos per square mile
Median price asked for vacant for-sale houses and condos in 2022: $751,719.
Median contract rent in 2022: $1,591 (lower quartile is $1,242, upper quartile is $1,885)
Median rent asked for vacant for-rent units in 2022: $7,945
Median gross rent in La Puente, CA in 2022: $1,696
Housing units in La Puente with a mortgage: 3,863 (218 second mortgage, 8 home equity loan, 145 both second mortgage and home equity loan)
Houses without a mortgage: 58
Median household income for houses/condos with a mortgage: $122,624
Median household income for apartments without a mortgage: $64,645
Median monthly housing costs: $1,645
Compare current foreclosures in La Puente, CA:
| Photo | Address | Area | Beds / Baths | Price | Details |
|---|---|---|---|---|---|

|
#1
Basetdale Ave
La Puente, CA 91746
|
1,328 sq. feet
|
2 baths 4 beds |
show details | |

|
#2
Park Rock Dr
La Puente, CA 91744
|
1,450 sq. feet
|
2 baths 3 beds |
show details | |

|
#3
Neff Ave
La Puente, CA 91744
|
2,339 sq. feet
|
2 baths 4 beds |
show details | |

|
#4
Lanaca St
La Puente, CA 91744
|
1,226 sq. feet
|
2 baths 3 beds |
show details | |

|
#5
Flagstaff St
La Puente, CA 91744
|
1,544 sq. feet
|
2 baths 4 beds |
show details | |

|
#6
Lark Ellen Ave
La Puente, CA 91744
|
1,386 sq. feet
|
2 baths 3 beds |
show details | |

|
#7
E Cherry Blossom Ln
La Puente, CA 91744
|
1,849 sq. feet
|
3 baths 5 beds |
show details | |

|
#8
Homeward St
La Puente, CA 91744
|
1,092 sq. feet
|
2 baths 3 beds |
show details | |

|
#9
Broadvale Dr
La Puente, CA 91744
|
1,549 sq. feet
|
2 baths 4 beds |
show details | |

|
#10
Ivanell Ave
La Puente, CA 91744
|
1,309 sq. feet
|
3 baths 5 beds |
show details |
| Photo | Address | Area | Beds / Baths | Price | Details |
|---|---|---|---|---|---|

|
#11
Park Rock Dr
La Puente, CA 91744
|
1,450 sq. feet
|
2 baths 3 beds |
show details | |

|
#12
Altario St
La Puente, CA 91744
|
1,050 sq. feet
|
2 baths 3 beds |
show details | |

|
#13
Witzman Dr
La Puente, CA 91744
|
1,216 sq. feet
|
2 baths 4 beds |
show details | |

|
#14
N Orange Blossom Ave
La Puente, CA 91746
|
1,256 sq. feet
|
2 baths 4 beds |
show details | |

|
#15
Fairgrove Ave
La Puente, CA 91744
|
1,076 sq. feet
|
1 baths 3 beds |
show details | |

|
#16
Ahern Dr
La Puente, CA 91746
|
1,215 sq. feet
|
2 baths 4 beds |
show details | |

|
#17
E Cherry Blossom Ln
La Puente, CA 91744
|
1,226 sq. feet
|
2 baths 3 beds |
show details | |

|
#18
Ranlett Ave
La Puente, CA 91744
|
1,754 sq. feet
|
2 baths 4 beds |
show details | |

|
#19
Peggy Ave
La Puente, CA 91744
|
1,006 sq. feet
|
1 baths 3 beds |
show details | |

|
#20
Millbury Ave
La Puente, CA 91746
|
1,147 sq. feet
|
2 baths 3 beds |
show details |
| Photo | Address | Area | Beds / Baths | Price | Details |
|---|---|---|---|---|---|

|
#21
Salais St
La Puente, CA 91744
|
936 sq. feet
|
1 baths 3 beds |
show details | |

|
#22
Broadmoor Ave
La Puente, CA 91744
|
1,143 sq. feet
|
2 baths 4 beds |
show details | |

|
#23
Stichman Ave
La Puente, CA 91746
|
1,145 sq. feet
|
2 baths 3 beds |
show details | |

|
#24
Dubesor St
La Puente, CA 91744
|
1,784 sq. feet
|
2 baths 3 beds |
show details | |

|
#25
Sandy Hook Ave
La Puente, CA 91744
|
1,106 sq. feet
|
2 baths 3 beds |
show details | |

|
#26
S Azusa Ave
La Puente, CA 91744
|
1,271 sq. feet
|
2 baths 4 beds |
show details | |

|
#27
Bamboo St
La Puente, CA 91744
|
1,000 sq. feet
|
2 baths 3 beds |
show details | |

|
#28
Pocono St
La Puente, CA 91744
|
1,512 sq. feet
|
2 baths 4 beds |
show details | |

|
#29
Yorbita Rd
La Puente, CA 91744
|
1,206 sq. feet
|
2 baths 4 beds |
show details | |

|
#30
Dancer St
La Puente, CA 91744
|
1,638 sq. feet
|
3 baths 5 beds |
show details |
| Photo | Address | Area | Beds / Baths | Price | Details |
|---|---|---|---|---|---|

|
#31
Donaldale St
La Puente, CA 91746
|
1,312 sq. feet
|
2 baths 4 beds |
show details | |

|
#32
S Shipman Ave
La Puente, CA 91744
|
998 sq. feet
|
1 baths 3 beds |
show details | |

|
#33
Witzman Dr
La Puente, CA 91744
|
1,216 sq. feet
|
2 baths 4 beds |
show details | |

|
#34
Fellowship St
La Puente, CA 91744
|
798 sq. feet
|
1 baths 2 beds |
show details | |

|
#35
Glenshaw Dr
La Puente, CA 91744
|
1,202 sq. feet
|
2 baths 3 beds |
show details | |

|
#36
Willow Ave
La Puente, CA 91746
|
1,257 sq. feet
|
2 baths 4 beds |
show details | |

|
#37
Molinar Ave
La Puente, CA 91744
|
1,220 sq. feet
|
2 baths 4 beds |
show details | |

|
#38
Flynn St
La Puente, CA 91744
|
1,752 sq. feet
|
2 baths 3 beds |
show details | |

|
#39
Ahern Dr
La Puente, CA 91746
|
1,514 sq. feet
|
2 baths 4 beds |
show details | |

|
#40
Appleblossom St
La Puente, CA 91744
|
1,196 sq. feet
|
2 baths 3 beds |
show details |
| Photo | Address | Area | Beds / Baths | Price | Details |
|---|---|---|---|---|---|

|
#41
Glenshaw Dr
La Puente, CA 91744
|
1,454 sq. feet
|
2 baths 3 beds |
show details | |

|
#42
Fellowship St
La Puente, CA 91744
|
1,629 sq. feet
|
3 baths 4 beds |
show details | |

|
#43
Hutchcroft St
La Puente, CA 91744
|
1,186 sq. feet
|
1 baths 3 beds |
show details | |

|
#44
N Shipman Ave
La Puente, CA 91744
|
960 sq. feet
|
1 baths 3 beds |
show details | |

|
#45
Griffith Ave
La Puente, CA 91744
|
1,655 sq. feet
|
2 baths 4 beds |
show details | |

|
#46
Dade Ave
La Puente, CA 91744
|
1,214 sq. feet
|
1 baths 3 beds |
show details | |

|
#47
La Seda Rd
La Puente, CA 91744
|
1,488 sq. feet
|
2 baths 4 beds |
show details | |

|
#48
Alwood St
La Puente, CA 91744
|
1,308 sq. feet
|
2 baths 4 beds |
show details | |

|
#49
Lochmere Ave
La Puente, CA 91744
|
1,280 sq. feet
|
2 baths 4 beds |
show details | |

|
Check over 1 million property listings on Foreclosure.com!
|
browse all offers | |||


Median year apartment built: 1969
Household type by relationship:
Households: 37,014- Male householders: 4,932 (403 living alone), Female householders: 4,483 (589 living alone)
5,061 spouses (5,050 opposite-sex spouses), 598 unmarried partners, (598 opposite-sex unmarried partners), 12,988 children (12,424 natural, 54 adopted, 508 stepchildren), 2,089 grandchildren, 1,392 brothers or sisters, 1,988 parents, 41 foster children, 2,196 other relatives, 1,140 non-relatives
- In group quarters: 100
Size of family households: 1,677 2-persons, 1,726 3-persons, 1,806 4-persons, 1,744 5-persons, 743 6-persons, 543 7-or-more-persons.
Size of nonfamily households: 1,065 1-person, 241 2-persons, 9 3-persons, 49 5-persons.
3,492 married couples with children.
2,314 single-parent households (650 men, 1,664 women).
24.1% of residents of La Puente speak English at home.
63.4% of residents speak Spanish at home (60% speak English very well, 17% speak English well, 17% speak English not well, 7% don't speak English at all).
0.2% of residents speak other Indo-European language at home (76% speak English very well, 24% speak English well).
11.3% of residents speak Asian or Pacific Island language at home (40% speak English very well, 25% speak English well, 24% speak English not well, 11% don't speak English at all).
Foreign born population: 14,865 (40.2%)
(54.2% of them are naturalized citizens)
| Here: | 5.6 |
| State: | 6.0 |
| Here: | 4.2 |
| State: | 3.9 |

- Bedrooms in owner-occupied houses and condos in La Puente, California
- 111no bedroom
- 1591 bedroom
- 5082 bedrooms
- 3,0943 bedrooms
- 1,9334 bedrooms
- 855+ bedrooms

- Bedrooms in renter-occupied apartments in La Puente, California
- 181no bedroom
- 9111 bedroom
- 1,2812 bedrooms
- 1,2163 bedrooms
- 2594 bedrooms
- 395+ bedrooms

- Cars and other vehicles available in La Puente in owner-occupied houses/condos
- 257no vehicle
- 8941 vehicle
- 1,7412 vehicles
- 1,2803 vehicles
- 1,0344 vehicles
- 6855+ vehicles

- Cars and other vehicles available in La Puente in renter-occupied apartments
- 145no vehicle
- 1,3211 vehicle
- 1,4302 vehicles
- 7363 vehicles
- 2354 vehicles
- 185+ vehicles

- Rooms in owner-occupied houses in La Puente, California
- 331 room
- 872 rooms
- 2763 rooms
- 6324 rooms
- 1,5135 rooms
- 1,6176 rooms
- 8677 rooms
- 6328 rooms
- 2339+ rooms

- Rooms in renter-occupied apartments in La Puente, California
- 1811 room
- 1452 rooms
- 8573 rooms
- 1,1124 rooms
- 6845 rooms
- 5806 rooms
- 1707 rooms
- 1408 rooms
- 179+ rooms


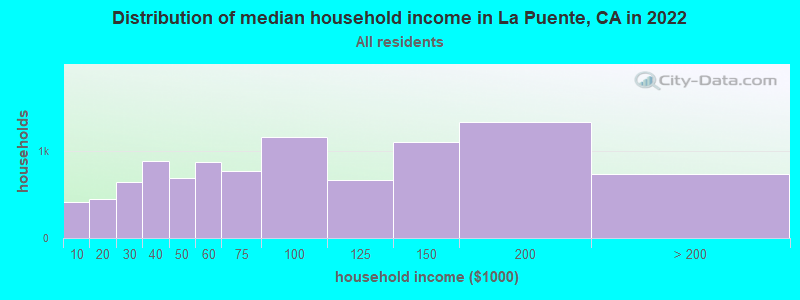
La Puente, CA household income distribution

- 413Less than $10,000
- 448$10,000 to $19,999
- 645$20,000 to $29,999
- 888$30,000 to $39,999
- 686$40,000 to $49,999
- 873$50,000 to $59,999
- 773$60,000 to $74,999
- 1,163$75,000 to $99,999
- 669$100,000 to $124,999
- 1,096$125,000 to $149,999
- 1,331$150,000 to $199,999
- 734$200,000 or more
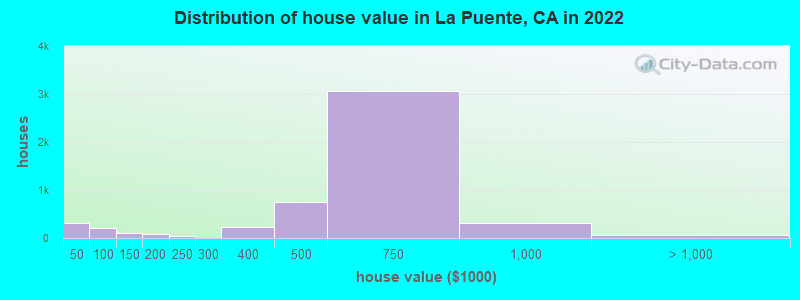
Home value of owner - occupied houses in 2022 in La Puente, CA
-
- 216Less than $10,000
- 8$25,000 to $29,999
- 1$30,000 to $34,999
- 13$35,000 to $39,999
- 77$40,000 to $49,999
- 56$50,000 to $59,999
- 50$60,000 to $69,999
- 26$70,000 to $79,999
- 103$100,000 to $124,999
- 88$150,000 to $174,999
- 40$200,000 to $249,999
- 9$250,000 to $299,999
- 238$300,000 to $399,999
- 759$400,000 to $499,999
- 3,070$500,000 to $749,999
- 314$750,000 to $999,999
- 66$1,000,000 to $1,499,999
Rent paid by renters in 2022 in La Puente, CA
-
- 32Less than $100
- 58$250 to $299
- 28$300 to $349
- 69$400 to $449
- 77$500 to $549
- 16$550 to $599
- 23$600 to $649
- 36$650 to $699
- 14$700 to $749
- 33$750 to $799
- 76$800 to $899
- 143$900 to $999
- 316$1,000 to $1,249
- 625$1,250 to $1,499
- 1,639$1,500 to $1,999
- 433$2,000 to $2,499
- 78$2,500 to $2,999
- 37$3,000 to $3,499
- 185No cash rent


Percentage of workers working in this county: 89.5%
Number of people working at home: 959 (5.5% of all workers)
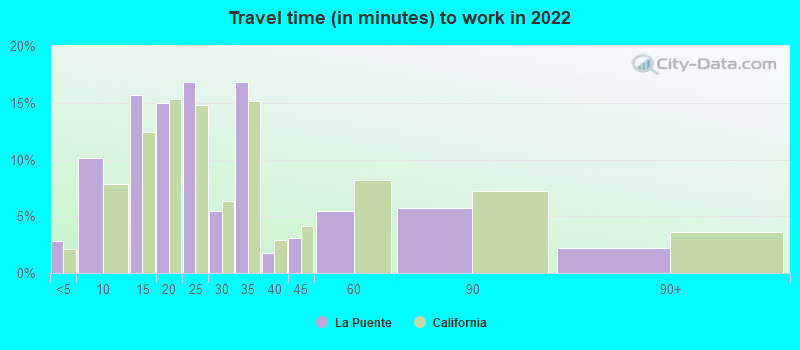
Travel time to work (commute)
- Less than 5 minutes: 333
- 5 to 9 minutes: 1,007
- 10 to 14 minutes: 1,687
- 15 to 19 minutes: 2,150
- 20 to 24 minutes: 2,070
- 25 to 29 minutes: 907
- 30 to 34 minutes: 3,053
- 35 to 39 minutes: 571
- 40 to 44 minutes: 757
- 45 to 59 minutes: 1,547
- 60 to 89 minutes: 1,445
- 90 or more minutes: 487
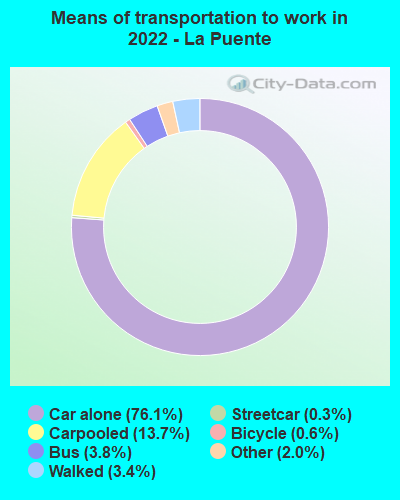
Means of transportation to work:
- Drove a car alone: 7,002 (67.1%)
- Carpooled: 1,391 (13.3%)
- Bus: 319 (3.1%)
- Subway or elevated rail: 21 (0.2%)
- Taxi: 199 (1.9%)
- Bicycle: 60 (0.6%)
- Walked: 340 (3.3%)
- Worked at home: 959 (9.2%)

- Unemployment by race in 2022
- Unemployment rate for White non-Hispanic residents
- 16.3%Females
- Unemployment rate for Black residents
- 5.2%Males
- 7.2%Females
- Unemployment rate for American Indian and Alaska Native residents
- 2.5%Males
- 4.9%Females
- Unemployment rate for Asian residents
- 5.8%Males
- 2.3%Females
- Unemployment rate for other race residents
- 5.1%Males
- 6.0%Females
- Unemployment rate for two or more race residents
- 7.6%Males
- 4.6%Females
- Unemployment rate for Hispanic or Latino residents
- 4.3%Males
- 6.0%Females

- Year of entry for the foreign-born population in La Puente, California
- 1,9452010 or later
- 2,6822000 to 2009
- 3,1121990 to 1999
- 6,1731980 to 1989
- 4,1251970 to 1979
- 2,022Before 1970
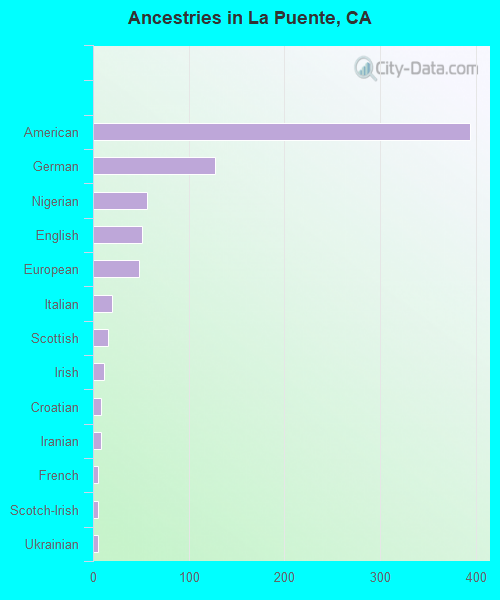
First ancestries reported:
- American: 394 (1.4%)
- German: 127 (0.5%)
- Nigerian: 56 (0.2%)
- English: 51 (0.2%)
- European: 48 (0.2%)
- Italian: 20 (0.07%)
- Scottish: 16 (0.06%)
- Irish: 11 (0.04%)
- Croatian: 8 (0.03%)
- Iranian: 8 (0.03%)
- French: 5 (0.02%)
- Scotch-Irish: 5 (0.02%)
- Ukrainian: 5 (0.02%)
- Barbadian: 2 (0.01%)
Most common places of birth for foreign-born residents (%):
| La Puente: | 57.4% (8,532) |
| California: | 37.2% (3,881,193) |
| La Puente: | 8.3% (1,238) |
| California: | 4.2% (440,287) |
| La Puente: | 7.6% (1,135) |
| California: | 7.8% (818,297) |
| La Puente: | 7.2% (1,074) |
| California: | 6.6% (684,672) |
| La Puente: | 7.1% (1,052) |
| California: | 4.9% (512,335) |
| La Puente: | 4.2% (618) |
| California: | 2.8% (290,436) |
Place of birth for U.S.-born residents:
- This state: 20,618
- Other state: 1,204
- Northeast: 148
- Midwest: 186
- South: 374
- West: 467
93.1% of La Puente residents lived in the same house 1 years ago.
Out of people who lived in different houses, 46.0% lived in this county.
Out of people who lived in different counties, 100.0% lived in California.
| La Puente: | 93.1% |
| State average: | 88.9% |
Education attainment for males 25 years and older:
- No schooling: 1,041
- Nursery to 4th grade: 368
- 5th and 6th grade: 695
- 7th and 8th grade: 487
- 9th grade: 426
- 10th grade: 244
- 11th grade: 292
- 12th grade, no diploma: 803
- High school graduate (or equivalency): 3,920
- Less than 1 year of college: 799
- Some college more than 1 year, no degree: 1,453
- Associate degree: 803
- Bachelor's degree: 1,007
- Master's degree: 193
- Professional school degree: 39
- Doctorate degree: 53

Education attainment for females 25 years and older:
- No schooling: 1,027
- Nursery to 4th grade: 368
- 5th and 6th grade: 821
- 7th and 8th grade: 411
- 9th grade: 410
- 10th grade: 172
- 11th grade: 247
- 12th grade, no diploma: 629
- High school graduate (or equivalency): 3,859
- Less than 1 year of college: 758
- Some college more than 1 year, no degree: 1,444
- Associate degree: 578
- Bachelor's degree: 1,332
- Master's degree: 247
- Professional school degree: 34
- Doctorate degree: 61


Housing units in structures:
- One, detached: 6,656
- One, attached: 809
- Two: 55
- 3 or 4: 294
- 5 to 9: 309
- 10 to 19: 433
- 20 to 49: 389
- 50 or more: 937
- Mobile homes: 123
Median worth of mobile homes: $98,326
Housing units lacking complete kitchen facilities in 2022: 1.8%
House/condo owner moved in on average 20 years ago
Renter moved in on average 7 years ago

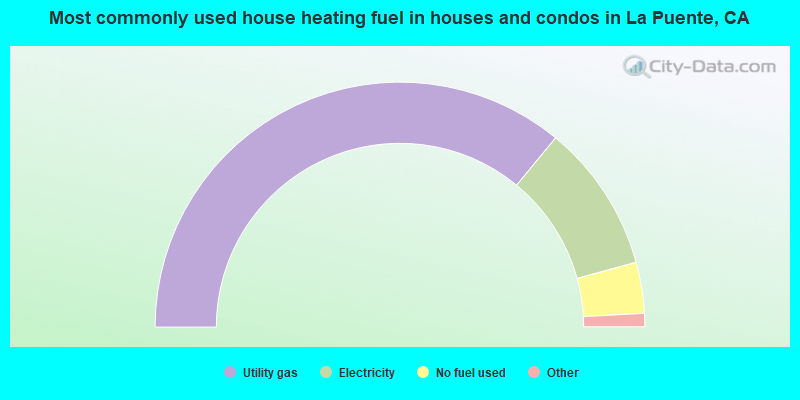
- 72.0%Utility gas
- 19.6%Electricity
- 6.7%No fuel used
- 1.0%Bottled, tank, or LP gas
- 0.5%Solar energy
- 0.3%Other fuel
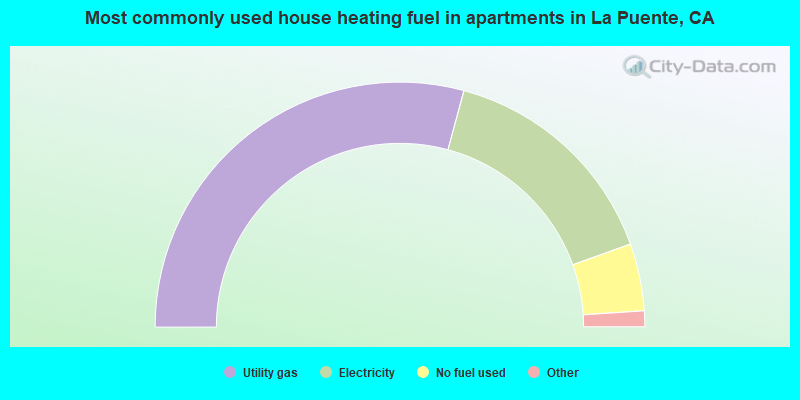
- 58.5%Utility gas
- 30.6%Electricity
- 8.9%No fuel used
- 1.8%Bottled, tank, or LP gas
- 0.3%Fuel oil, kerosene, etc.
Private vs. public school enrollment:
| Here: | 5.3% |
| California: | 10.5% |
| Here: | 6.8% |
| California: | 8.5% |
| Here: | 17.7% |
| California: | 15.9% |


