Housing density: 2,907 houses/condos per square mile
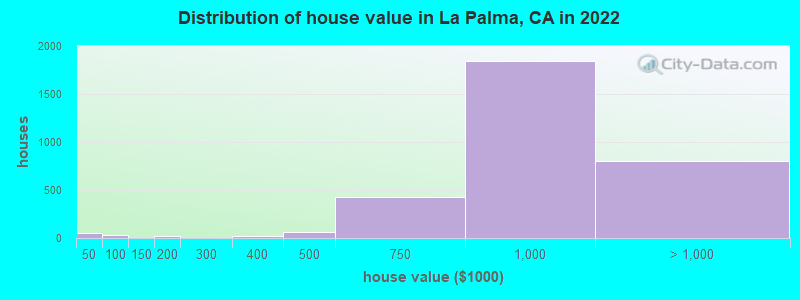
Median price asked for vacant for-sale houses and condos in 2022 in this county: $1,279,555.
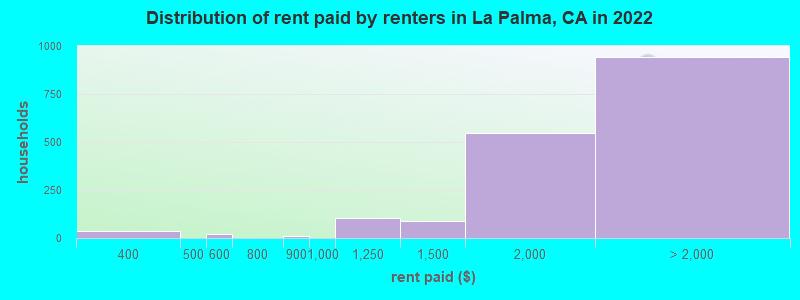
Median contract rent in 2022: over $2,000 (lower quartile is $1,656, upper quartile is over $2,000)
Median rent asked for vacant for-rent units in 2022: $2,249
Median gross rent in La Palma, CA in 2022: over $2,000
Housing units in La Palma with a mortgage: 2,085 (219 second mortgage, 15 home equity loan, 163 both second mortgage and home equity loan) Houses without a mortgage: 16
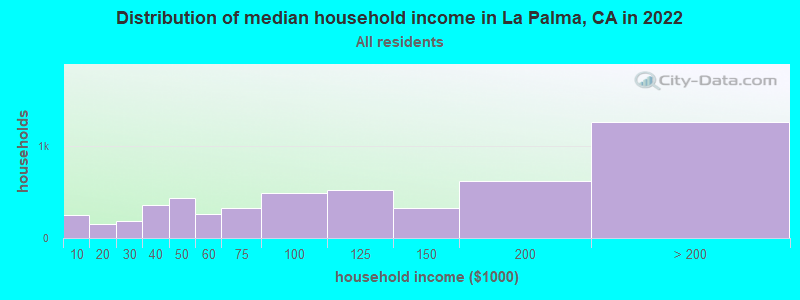
Median household income for houses/condos with a mortgage: $165,304
Median household income for apartments without a mortgage: $119,507
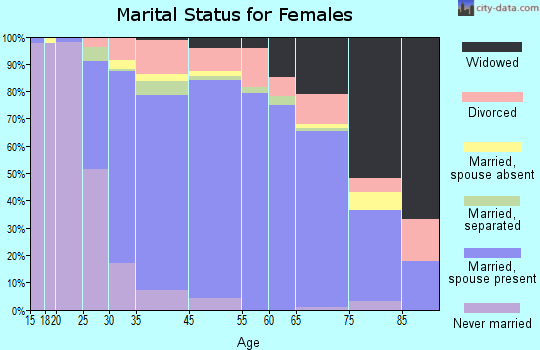
2,116 married couples with children.
331 single-parent households (169 men, 162 women).
48.8% of residents of La Palma speak English at home.
11.6% of residents speak Spanish at home (81% speak English very well, 13% speak English well, 6% speak English not well).
6.2% of residents speak other Indo-European language at home (74% speak English very well, 26% speak English well).
32.9% of residents speak Asian or Pacific Island language at home (62% speak English very well, 23% speak English well, 12% speak English not well, 3% don't speak English at all).
1.1% of residents speak other language at home (76% speak English very well, 24% speak English well).
Foreign born population: 5,624 (36.5%)
(76.0% of them are naturalized citizens)
Percentage of workers working in this county: 56.2% Number of people working at home: 1,035 (13.6% of all workers)
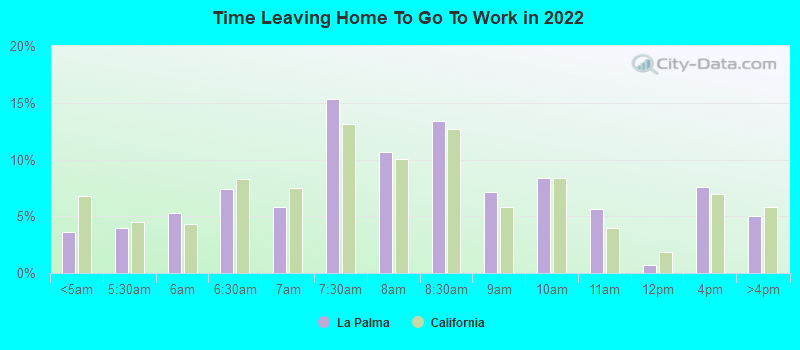
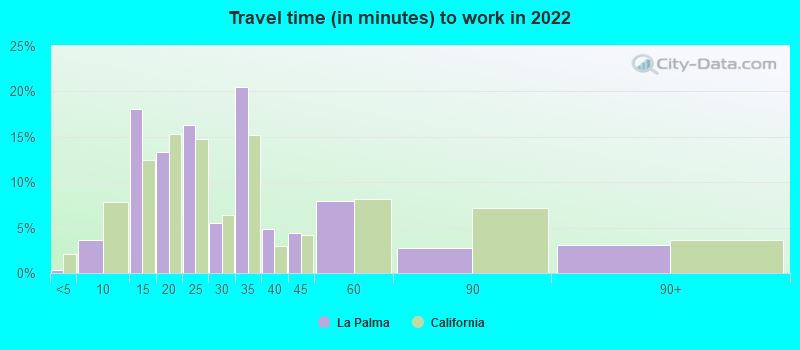
Travel time to work (commute)
Less than 5 minutes: 22
5 to 9 minutes: 292
10 to 14 minutes: 607
15 to 19 minutes: 825
20 to 24 minutes: 939
25 to 29 minutes: 321
30 to 34 minutes: 1,012
35 to 39 minutes: 194
40 to 44 minutes: 449
45 to 59 minutes: 652
60 to 89 minutes: 855
90 or more minutes: 269
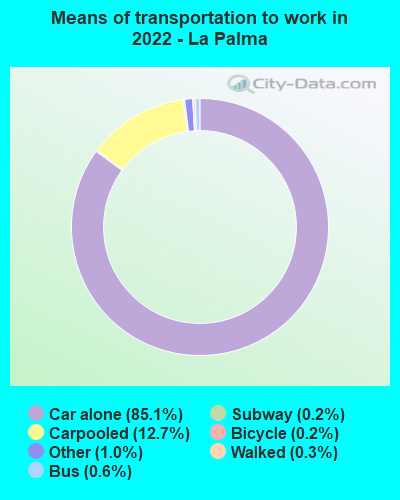
Means of transportation to work:
Drove a car alone: 3,786 (68.7%)
Carpooled: 613 (11.1%)
Bus: 22 (0.4%)
Long-distance train or commuter rail: 7 (0.1%)
Taxi: 49 (0.9%)
Bicycle: 9 (0.2%)
Walked: 13 (0.2%)
Worked at home: 1,035 (18.8%)
Unemployment by race in 2022
Unemployment rate for White non-Hispanic residents
2.5%Males
2.1%Females
Unemployment rate for Black residents
9.2%Males
5.4%Females
Unemployment rate for Asian residents
1.8%Males
2.5%Females
Unemployment rate for other race residents
23.6%Females
Unemployment rate for two or more race residents
5.1%Males
4.4%Females
Unemployment rate for Hispanic or Latino residents
6.7%Males
9.0%Females
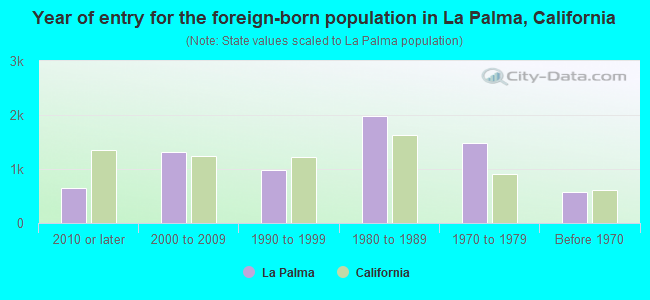
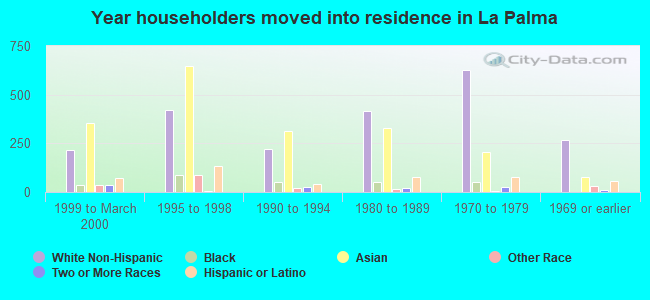
Year of entry for the foreign-born population in La Palma, California
6532010 or later
1,3242000 to 2009
9771990 to 1999
1,9781980 to 1989
1,4831970 to 1979
578Before 1970
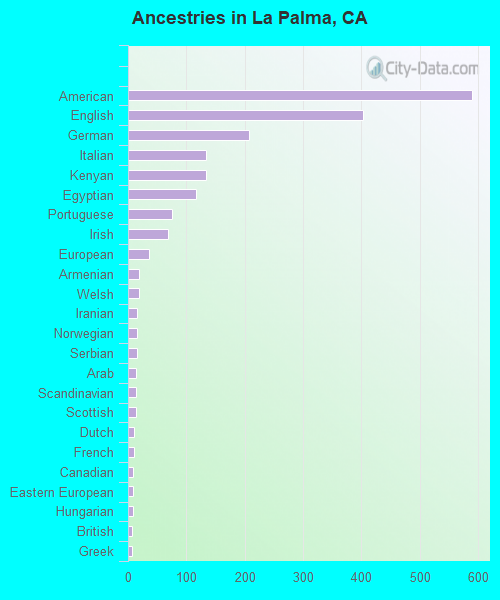
First ancestries reported:
American: 589 (6.0%)
English: 402 (4.1%)
German: 208 (2.1%)
Italian: 134 (1.4%)
Kenyan: 133 (1.4%)
Egyptian: 117 (1.2%)
Portuguese: 76 (0.8%)
Irish: 69 (0.7%)
European: 36 (0.4%)
Armenian: 18 (0.2%)
Welsh: 18 (0.2%)
Iranian: 16 (0.2%)
Norwegian: 15 (0.2%)
Serbian: 15 (0.2%)
Arab: 14 (0.1%)
Scandinavian: 14 (0.1%)
Scottish: 14 (0.1%)
Dutch: 11 (0.1%)
French: 10 (0.1%)
Canadian: 8 (0.08%)
Eastern European: 8 (0.08%)
Hungarian: 8 (0.08%)
British: 6 (0.06%)
Greek: 6 (0.06%)
Lebanese: 4 (0.04%)
Polish: 4 (0.04%)
Most common places of birth for foreign-born residents (%):
Philippines
La Palma:
30.0% (1,687)
California:
7.8% (818,297)
Korea
La Palma:
20.4% (1,148)
California:
3.0% (315,248)
India
La Palma:
9.9% (554)
California:
5.2% (539,184)
Taiwan
La Palma:
7.2% (406)
California:
1.7% (176,274)
Mexico
La Palma:
5.4% (306)
California:
37.2% (3,881,193)
China, excluding Hong Kong and Taiwan
La Palma:
3.6% (201)
California:
6.6% (684,672)
Colombia
La Palma:
2.6% (144)
California:
0.5% (55,249)
Vietnam
La Palma:
2.5% (139)
California:
4.9% (512,335)
Pakistan
La Palma:
2.0% (113)
California:
0.5% (49,399)
Canada
La Palma:
1.9% (106)
California:
1.2% (127,477)
Thailand
La Palma:
1.6% (91)
California:
0.6% (65,335)
Place of birth for U.S.-born residents:
This state: 7,856
Other state: 1,729
Northeast: 316
Midwest: 621
South: 239
West: 542
90.5% of La Palma residents lived in the same house 1 years ago. Out of people who lived in different houses, 21.2% lived in this county. Out of people who lived in different counties, 91.9% lived in California.
La Palma:
90.5%
State average:
88.9%
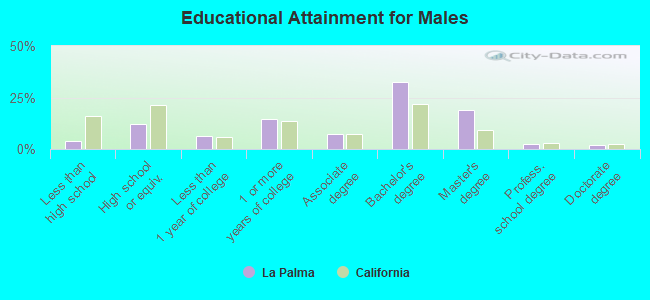
Education attainment for males 25 years and older:
No schooling: 0
Nursery to 4th grade: 44
5th and 6th grade: 38
7th and 8th grade: 66
9th grade: 0
10th grade: 0
11th grade: 27
12th grade, no diploma: 24
High school graduate (or equivalency): 643
Less than 1 year of college: 319
Some college more than 1 year, no degree: 769
Associate degree: 388
Bachelor's degree: 1,683
Master's degree: 981
Professional school degree: 118
Doctorate degree: 97
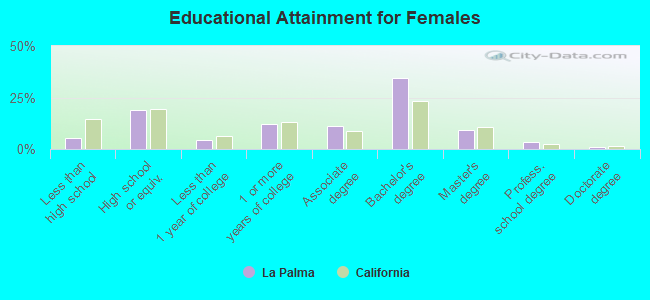
Education attainment for females 25 years and older:
No schooling: 76
Nursery to 4th grade: 0
5th and 6th grade: 77
7th and 8th grade: 14
9th grade: 6
10th grade: 13
11th grade: 36
12th grade, no diploma: 114
High school graduate (or equivalency): 1,171
Less than 1 year of college: 261
Some college more than 1 year, no degree: 737
Associate degree: 674
Bachelor's degree: 2,134
Master's degree: 572
Professional school degree: 216
Doctorate degree: 59
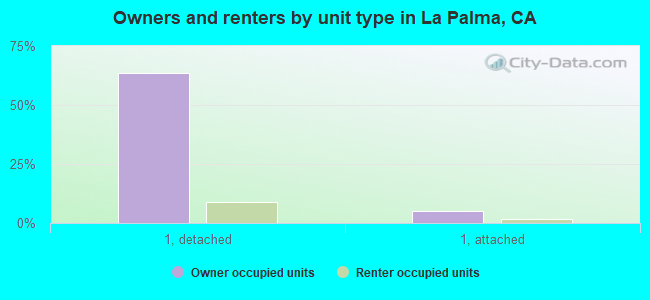
Housing units in structures:
One, detached: 3,564
One, attached: 449
Two: 8
3 or 4: 49
5 to 9: 197
10 to 19: 190
20 to 49: 176
50 or more: 588
Mobile homes: 45
Housing units lacking complete plumbing facilities in 2022: 0.1%
Housing units lacking complete kitchen facilities in 2022: 4.9%
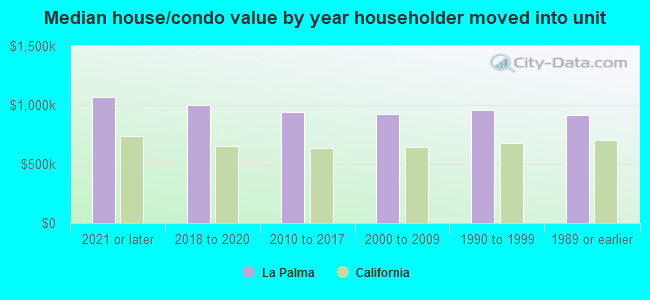
House/condo owner moved in on average 19 years ago