La Habra, CA (California) Houses and Residents
| La Habra: | $741,576 |
| California: | $715,900 |
Mean price in 2022:
Detached houses: $886,937
Here: $886,937 State: $988,808 Townhouses or other attached units: $555,035
Here: $555,035 State: $838,546 In 2-unit structures: $620,237
Here: $620,237 State: $1,138,100 In 3-to-4-unit structures: $379,826
Here: $379,826 State: $824,253 In 5-or-more-unit structures: $395,767
Here: $395,767 State: $730,996 Mobile homes: $100,772
Here: $100,772 State: $184,506
Total population: 62,066 (Urban population: 59,191, Rural population: 0)
Houses: 21,054 (20,468 occupied: 11,704 owner occupied, 8,842 renter occupied)
| % of renters here: | 43% |
| State: | 44% |
Housing density: 2,872 houses/condos per square mile
Median price asked for vacant for-sale houses and condos in 2022: $709,163.
Median contract rent in 2022: $1,757 (lower quartile is $1,429, upper quartile is over $2,000)
Median rent asked for vacant for-rent units in 2022: $2,036
Median gross rent in La Habra, CA in 2022: $1,878
Housing units in La Habra with a mortgage: 7,750 (794 second mortgage, 28 home equity loan, 614 both second mortgage and home equity loan)
Houses without a mortgage: 22
Median household income for houses/condos with a mortgage: $124,334
Median household income for apartments without a mortgage: $80,361
Median monthly housing costs: $1,931
Compare current foreclosures in La Habra, CA:
| Photo | Address | Area | Beds / Baths | Price | Details |
|---|---|---|---|---|---|

|
#1
Coachwood St
La Habra, CA 90631
|
2,121 sq. feet
|
2 baths 4 beds |
show details | |

|
#2
E Pinehurst Ave
La Habra, CA 90631
|
1,125 sq. feet
|
1 baths 3 beds |
show details | |

|
#3
Pamela Ln
La Habra, CA 90631
|
2,848 sq. feet
|
3 baths 5 beds |
show details | |

|
#4
Popenoe Rd
La Habra, CA 90631
|
3,199 sq. feet
|
5 baths 5 beds |
show details | |

|
#5
Topaz Ave
La Habra, CA 90631
|
2,481 sq. feet
|
3 baths 5 beds |
show details | |

|
#6
Buena Vista Ave
La Habra, CA 90631
|
1,314 sq. feet
|
2 baths 3 beds |
show details | |

|
#7
Gerry St
La Habra, CA 90631
|
1,292 sq. feet
|
2 baths 3 beds |
show details | |

|
#8
Church Hill Rd
La Habra, CA 90631
|
1,877 sq. feet
|
2 baths 4 beds |
show details | |

|
#9
Kirby Dr
La Habra, CA 90631
|
1,517 sq. feet
|
2 baths 2 beds |
show details | |

|
#10
Candia Cir
La Habra, CA 90631
|
1,280 sq. feet
|
2 baths 4 beds |
show details |
| Photo | Address | Area | Beds / Baths | Price | Details |
|---|---|---|---|---|---|

|
#11
W Florence Ave
La Habra, CA 90631
|
1,221 sq. feet
|
1 baths 2 beds |
show details | |

|
#12
Passiflora Dr
La Habra, CA 90631
|
2,457 sq. feet
|
3 baths 4 beds |
show details | |

|
#13
W Greenwood Ave Apt 25
La Habra, CA 90631
|
968 sq. feet
|
2 baths 2 beds |
show details | |

|
#14
Reposado Dr
La Habra, CA 90631
|
2,578 sq. feet
|
2 baths 4 beds |
show details | |

|
#15
W Lambert Rd
La Habra, CA 90631
|
1,200 sq. feet
|
2 baths 3 beds |
show details | |

|
#16
Reposado Dr
La Habra, CA 90631
|
4,326 sq. feet
|
4 baths 3 beds |
show details | |

|
#17
Hillside St
La Habra, CA 90631
|
1,077 sq. feet
|
1 baths 2 beds |
show details | |

|
#18
W Greenwood Ave
La Habra, CA 90631
|
1,337 sq. feet
|
2 baths 3 beds |
show details | |

|
#19
Reposado Dr
La Habra, CA 90631
|
2,578 sq. feet
|
2 baths 4 beds |
show details | |

|
#20
Pamela Ln
La Habra, CA 90631
|
2,857 sq. feet
|
3 baths 5 beds |
show details |
| Photo | Address | Area | Beds / Baths | Price | Details |
|---|---|---|---|---|---|

|
#21
Stone Harbor Cir
La Habra, CA 90631
|
972 sq. feet
|
2 baths 2 beds |
show details | |

|
#22
Monterey St
La Habra, CA 90631
|
1,040 sq. feet
|
1 baths 3 beds |
show details | |

|
#23
W Imperial Hwy Ste 410
La Habra, CA 90631
|
- sq. feet
|
- baths - beds |
show details | |

|
#24
Mateo Ave
La Habra, CA 90631
|
- sq. feet
|
- baths - beds |
show details | |

|
#25
N Walnut St
La Habra, CA 90631
|
- sq. feet
|
- baths - beds |
show details | |

|
#26
Las Lomas Dr Apt D
La Habra, CA 90631
|
- sq. feet
|
- baths - beds |
show details | |

|
#27
Vista Del Llano Dr
La Habra, CA 90631
|
- sq. feet
|
- baths - beds |
show details | |

|
#28
Warne St Apt 1
La Habra, CA 90631
|
- sq. feet
|
- baths - beds |
show details | |

|
#29
S Harbor Blvd Apt 13g
La Habra, CA 90631
|
- sq. feet
|
- baths - beds |
show details | |

|
#30
S Beach Blvd, Apt N
La Habra, CA 90631
|
- sq. feet
|
- baths - beds |
show details |
| Photo | Address | Area | Beds / Baths | Price | Details |
|---|---|---|---|---|---|

|
#31
N College St
La Habra, CA 90631
|
- sq. feet
|
- baths - beds |
show details | |

|
#32
W Lambert Rd Unit C
La Habra, CA 90631
|
- sq. feet
|
- baths - beds |
show details | |

|
#33
N Colfax St
La Habra, CA 90631
|
- sq. feet
|
- baths - beds |
show details | |

|
#34
S Cadiz Ct
La Habra, CA 90631
|
- sq. feet
|
- baths - beds |
show details | |

|
#35
W La Habra Blvd Apt 5
La Habra, CA 90631
|
- sq. feet
|
- baths - beds |
show details | |

|
#36
N Walnut St Apt D
La Habra, CA 90631
|
- sq. feet
|
- baths - beds |
show details | |

|
#37
El Travesia Dr
La Habra, CA 90631
|
- sq. feet
|
- baths - beds |
show details | |

|
Check over 1 million property listings on Foreclosure.com!
|
browse all offers | |||


Median year apartment built: 1974
Household type by relationship:
Households: 62,427- Male householders: 10,299 (1,589 living alone), Female householders: 9,735 (2,199 living alone)
10,730 spouses (10,603 opposite-sex spouses), 1,619 unmarried partners, (1,602 opposite-sex unmarried partners), 20,171 children (18,901 natural, 216 adopted, 1,052 stepchildren), 2,558 grandchildren, 947 brothers or sisters, 1,676 parents, 63 foster children, 1,850 other relatives, 2,015 non-relatives
- In group quarters: 759
Size of family households: 4,864 2-persons, 4,150 3-persons, 3,226 4-persons, 1,999 5-persons, 477 6-persons, 600 7-or-more-persons.
Size of nonfamily households: 3,946 1-person, 1,003 2-persons, 119 3-persons, 81 4-persons, 51 5-persons.
7,190 married couples with children.
3,255 single-parent households (1,107 men, 2,148 women).
50.4% of residents of La Habra speak English at home.
38.7% of residents speak Spanish at home (64% speak English very well, 18% speak English well, 13% speak English not well, 5% don't speak English at all).
1.6% of residents speak other Indo-European language at home (80% speak English very well, 17% speak English well, 2% speak English not well, 2% don't speak English at all).
8.2% of residents speak Asian or Pacific Island language at home (47% speak English very well, 29% speak English well, 22% speak English not well, 2% don't speak English at all).
0.6% of residents speak other language at home (66% speak English very well, 16% speak English well, 18% speak English not well).
Foreign born population: 15,764 (25.3%)
(53.9% of them are naturalized citizens)
| Here: | 5.9 |
| State: | 6.0 |
| Here: | 3.9 |
| State: | 3.9 |

- Bedrooms in owner-occupied houses and condos in La Habra, California
- 111no bedroom
- 2691 bedroom
- 2,2622 bedrooms
- 5,5183 bedrooms
- 2,8714 bedrooms
- 6735+ bedrooms

- Bedrooms in renter-occupied apartments in La Habra, California
- 443no bedroom
- 2,3811 bedroom
- 4,3312 bedrooms
- 1,3673 bedrooms
- 2604 bedrooms
- 625+ bedrooms

- Cars and other vehicles available in La Habra in owner-occupied houses/condos
- 518no vehicle
- 2,2301 vehicle
- 4,3712 vehicles
- 2,6743 vehicles
- 1,1684 vehicles
- 7435+ vehicles

- Cars and other vehicles available in La Habra in renter-occupied apartments
- 829no vehicle
- 2,2681 vehicle
- 3,8962 vehicles
- 1,2443 vehicles
- 3984 vehicles
- 2085+ vehicles

- Rooms in owner-occupied houses in La Habra, California
- 981 room
- 252 rooms
- 6063 rooms
- 1,5544 rooms
- 2,5735 rooms
- 2,7576 rooms
- 1,8657 rooms
- 1,2618 rooms
- 9669+ rooms

- Rooms in renter-occupied apartments in La Habra, California
- 3341 room
- 8942 rooms
- 1,9213 rooms
- 3,6194 rooms
- 1,0215 rooms
- 6286 rooms
- 1197 rooms
- 2638 rooms
- 459+ rooms


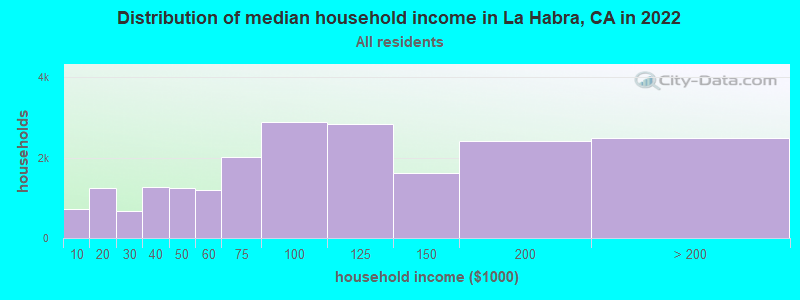
La Habra, CA household income distribution

- 725Less than $10,000
- 1,231$10,000 to $19,999
- 677$20,000 to $29,999
- 1,274$30,000 to $39,999
- 1,247$40,000 to $49,999
- 1,194$50,000 to $59,999
- 2,006$60,000 to $74,999
- 2,882$75,000 to $99,999
- 2,825$100,000 to $124,999
- 1,620$125,000 to $149,999
- 2,398$150,000 to $199,999
- 2,483$200,000 or more
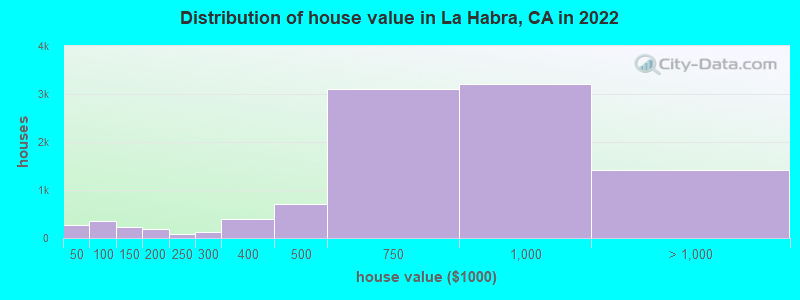
Home value of owner - occupied houses in 2022 in La Habra, CA
-
- 112Less than $10,000
- 46$10,000 to $14,999
- 9$15,000 to $19,999
- 19$25,000 to $29,999
- 37$30,000 to $34,999
- 16$35,000 to $39,999
- 25$40,000 to $49,999
- 62$50,000 to $59,999
- 39$70,000 to $79,999
- 188$80,000 to $89,999
- 28$90,000 to $99,999
- 102$100,000 to $124,999
- 117$125,000 to $149,999
- 133$150,000 to $174,999
- 60$175,000 to $199,999
- 90$200,000 to $249,999
- 133$250,000 to $299,999
- 400$300,000 to $399,999
- 705$400,000 to $499,999
- 3,110$500,000 to $749,999
- 3,207$750,000 to $999,999
- 1,085$1,000,000 to $1,499,999
- 229$1,500,000 to $1,999,999
- 100$2,000,000 or more
Rent paid by renters in 2022 in La Habra, CA
-
- 15$150 to $199
- 33$200 to $249
- 62$250 to $299
- 82$300 to $349
- 36$400 to $449
- 9$450 to $499
- 14$500 to $549
- 4$550 to $599
- 21$650 to $699
- 53$700 to $749
- 123$800 to $899
- 127$900 to $999
- 768$1,000 to $1,249
- 1,110$1,250 to $1,499
- 3,692$1,500 to $1,999
- 1,695$2,000 to $2,499
- 336$2,500 to $2,999
- 337$3,000 to $3,499
- 47$3,500 or more
- 289No cash rent


Percentage of workers working in this county: 66.3%
Number of people working at home: 3,802 (12.0% of all workers)
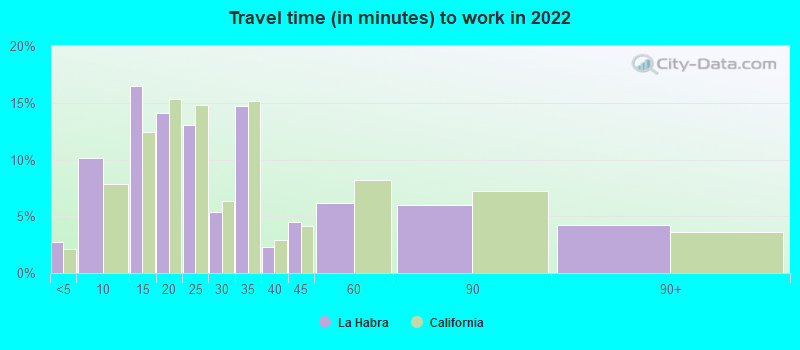
Travel time to work (commute)
- Less than 5 minutes: 654
- 5 to 9 minutes: 2,051
- 10 to 14 minutes: 3,353
- 15 to 19 minutes: 3,764
- 20 to 24 minutes: 3,708
- 25 to 29 minutes: 1,222
- 30 to 34 minutes: 3,931
- 35 to 39 minutes: 1,022
- 40 to 44 minutes: 1,500
- 45 to 59 minutes: 2,814
- 60 to 89 minutes: 2,513
- 90 or more minutes: 642
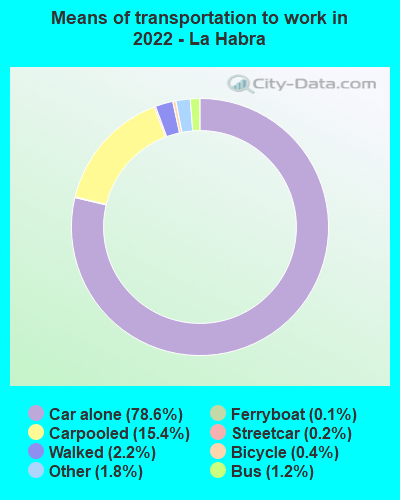
Means of transportation to work:
- Drove a car alone: 11,582 (62.5%)
- Carpooled: 2,462 (13.3%)
- Bus: 153 (0.8%)
- Subway or elevated rail: 13 (0.1%)
- Ferryboat: 15 (0.1%)
- Taxi: 315 (1.7%)
- Bicycle: 62 (0.3%)
- Walked: 326 (1.8%)
- Worked at home: 3,802 (20.5%)

- Unemployment by race in 2022
- Unemployment rate for White non-Hispanic residents
- 4.9%Males
- 6.5%Females
- Unemployment rate for Black residents
- 5.9%Males
- 4.0%Females
- Unemployment rate for Asian residents
- 6.4%Males
- 0.8%Females
- Unemployment rate for other race residents
- 4.6%Males
- 4.7%Females
- Unemployment rate for two or more race residents
- 8.8%Males
- 8.8%Females
- Unemployment rate for Hispanic or Latino residents
- 5.2%Males
- 7.1%Females

- Year of entry for the foreign-born population in La Habra, California
- 2,0402010 or later
- 3,4012000 to 2009
- 3,5961990 to 1999
- 4,8351980 to 1989
- 2,9571970 to 1979
- 2,135Before 1970

First ancestries reported:
- American: 1,609 (4.0%)
- English: 1,070 (2.7%)
- German: 907 (2.3%)
- Italian: 670 (1.7%)
- Irish: 580 (1.4%)
- European: 576 (1.4%)
- Swedish: 242 (0.6%)
- Canadian: 177 (0.4%)
- French: 145 (0.4%)
- Russian: 141 (0.4%)
- Dutch: 137 (0.3%)
- Norwegian: 132 (0.3%)
- Iranian: 118 (0.3%)
- Egyptian: 112 (0.3%)
- Polish: 81 (0.2%)
- Scottish: 70 (0.2%)
- Scotch-Irish: 69 (0.2%)
- Hungarian: 62 (0.2%)
- Portuguese: 49 (0.1%)
- Ukrainian: 47 (0.1%)
- Eastern European: 40 (0.10%)
- Scandinavian: 39 (0.10%)
- Danish: 37 (0.09%)
- Haitian: 34 (0.08%)
- Serbian: 32 (0.08%)
- Northern European: 29 (0.07%)
- African: 29 (0.07%)
- Lebanese: 27 (0.07%)
- British: 27 (0.07%)
- French Canadian: 26 (0.06%)
- Armenian: 25 (0.06%)
- Romanian: 24 (0.06%)
- Yugoslavian: 17 (0.04%)
- Austrian: 14 (0.03%)
- Greek: 14 (0.03%)
- Belgian: 13 (0.03%)
- Slovak: 10 (0.02%)
- Arab: 9 (0.02%)
- Israeli: 9 (0.02%)
- Welsh: 9 (0.02%)
- Luxembourger: 6 (0.01%)
- Turkish: 4 (0.01%)
Most common places of birth for foreign-born residents (%):
| La Habra: | 51.5% (8,119) |
| California: | 37.2% (3,881,193) |
| La Habra: | 12.6% (1,990) |
| California: | 3.0% (315,248) |
| La Habra: | 6.9% (1,085) |
| California: | 7.8% (818,297) |
| La Habra: | 4.4% (695) |
| California: | 2.8% (290,436) |
| La Habra: | 2.9% (457) |
| California: | 6.6% (684,672) |
| La Habra: | 2.3% (368) |
| California: | 4.2% (440,287) |
Place of birth for U.S.-born residents:
- This state: 40,465
- Other state: 5,898
- Northeast: 1,367
- Midwest: 1,702
- South: 1,474
- West: 1,359
90.2% of La Habra residents lived in the same house 1 years ago.
Out of people who lived in different houses, 29.5% lived in this county.
Out of people who lived in different counties, 94.3% lived in California.
| La Habra: | 90.2% |
| State average: | 88.9% |
Education attainment for males 25 years and older:
- No schooling: 628
- Nursery to 4th grade: 208
- 5th and 6th grade: 832
- 7th and 8th grade: 215
- 9th grade: 149
- 10th grade: 221
- 11th grade: 183
- 12th grade, no diploma: 539
- High school graduate (or equivalency): 5,186
- Less than 1 year of college: 1,639
- Some college more than 1 year, no degree: 3,481
- Associate degree: 2,070
- Bachelor's degree: 3,630
- Master's degree: 1,215
- Professional school degree: 520
- Doctorate degree: 171

Education attainment for females 25 years and older:
- No schooling: 828
- Nursery to 4th grade: 412
- 5th and 6th grade: 694
- 7th and 8th grade: 186
- 9th grade: 133
- 10th grade: 295
- 11th grade: 285
- 12th grade, no diploma: 593
- High school graduate (or equivalency): 5,156
- Less than 1 year of college: 1,235
- Some college more than 1 year, no degree: 3,237
- Associate degree: 1,893
- Bachelor's degree: 4,745
- Master's degree: 1,795
- Professional school degree: 326
- Doctorate degree: 299


Housing units in structures:
- One, detached: 10,957
- One, attached: 1,896
- Two: 121
- 3 or 4: 1,413
- 5 to 9: 982
- 10 to 19: 1,496
- 20 to 49: 1,715
- 50 or more: 1,757
- Mobile homes: 714
Median worth of mobile homes: $178,281
Housing units lacking complete kitchen facilities in 2022: 3.4%
House/condo owner moved in on average 15 years ago
Renter moved in on average 5 years ago

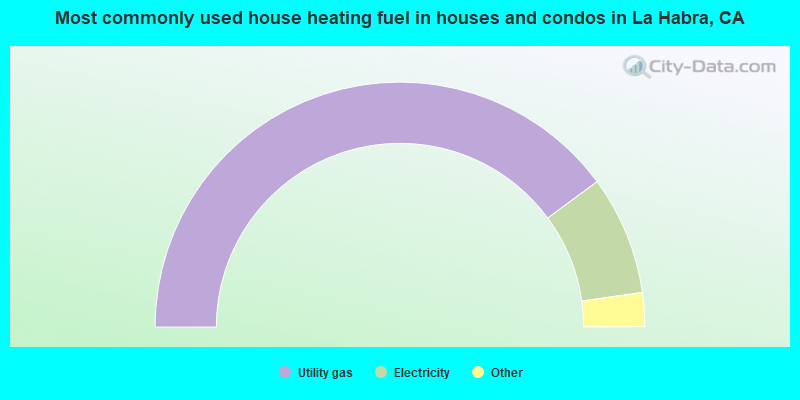
- 79.8%Utility gas
- 15.7%Electricity
- 2.3%No fuel used
- 1.1%Solar energy
- 1.1%Bottled, tank, or LP gas
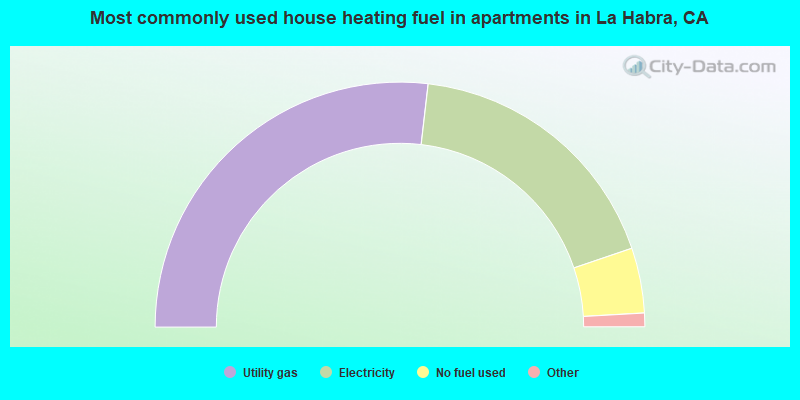
- 53.7%Utility gas
- 35.9%Electricity
- 8.6%No fuel used
- 1.6%Bottled, tank, or LP gas
- 0.1%Solar energy
Private vs. public school enrollment:
| Here: | 13.1% |
| California: | 10.5% |
| Here: | 6.0% |
| California: | 8.5% |
| Here: | 15.2% |
| California: | 15.9% |


