Knoxville, TN (Tennessee) Houses and Residents
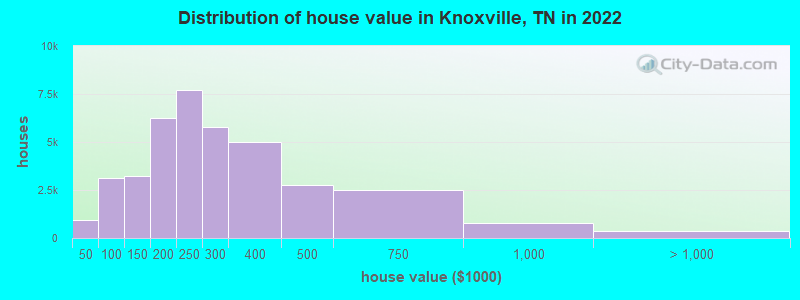
Estimated median house or condo value in 2022: $237,300 (it was $77,800 in 2000 )
Knoxville:
$237,300Tennessee:
$284,800
Lower value quartile - upper value quartile: $164,600 - $336,800Mean price in 2022: Detached houses: $262,637 Here:
$262,637State:
$374,382
Townhouses or other attached units: $262,460 Here:
$262,460State:
$354,101
In 2-unit structures: $137,642 Here:
$137,642State:
$247,693
In 3-to-4-unit structures: $357,078 Here:
$357,078State:
$239,060
In 5-or-more-unit structures: $290,710 Here:
$290,710State:
$317,434
Mobile homes: $52,230 Here:
$52,230State:
$101,421
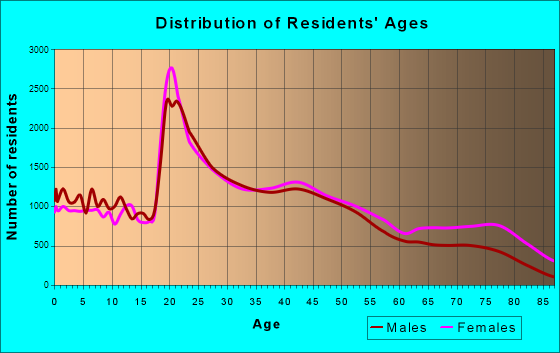
Total population: 184,281 (Urban population: 173,485, Rural population: 195 (22 farm, 173 nonfarm ))
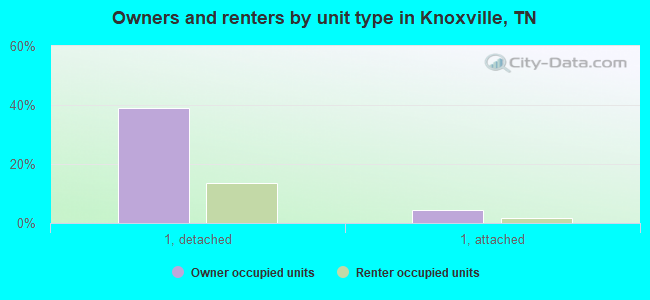
Houses: 95,106 (85,304 occupied: 38,224 owner occupied, 47,080 renter occupied )
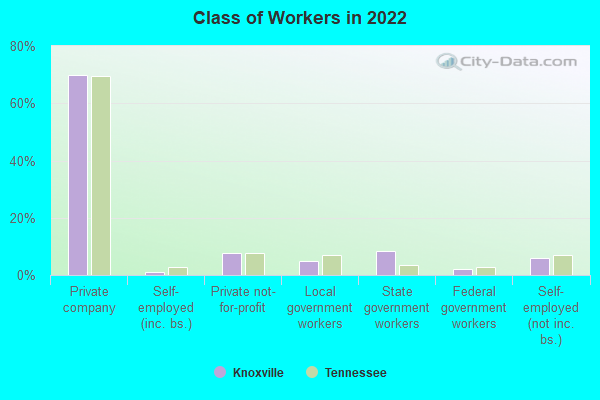
% of renters here:
55%State:
33%
Housing density: 1,026 houses/condos per square mile
Median price asked for vacant for-sale houses and condos in 2022: $312,644.
Median contract rent in 2022: $889 (lower quartile is $690, upper quartile is $1,201)
Median rent asked for vacant for-rent units in 2022: $1,451
Median gross rent in Knoxville, TN in 2022: $1,076
Housing units in Knoxville with a mortgage: 22,168 (1,732 second mortgage, 47 home equity loan, 1,324 both second mortgage and home equity loan )Houses without a mortgage: 465
Median household income for houses/condos with a mortgage: $96,165
Median household income for apartments without a mortgage: $58,739
Median monthly housing costs: $1,031
Data:
Median house or condo value ($)
Median house or condo value ($ change since 2000)
Median house or condo value ($) - White
Median house or condo value ($) - Black or African American
Median house or condo value ($) - Asian
Median house or condo value ($) - Hispanic or Latino
Median house or condo value ($) - American Indian and Alaska Native
Median house or condo value ($) - Multirace
Median house or condo value ($) - Other Race
Median price asked for mobile homes ($)
Household density (households per square mile)
Mean house or condo value by units in structure - 1, detached ($)
Mean house or condo value by units in structure - 1, attached ($)
Mean house or condo value by units in structure - 2 ($)
Mean house or condo value by units in structure by units in structure - 3 or 4 ($)
Mean house or condo value by units in structure - 5 or more ($)
Mean house or condo value by units in structure - Boat, RV, van, etc. ($)
Mean house or condo value by units in structure - Mobile home ($)
Median contract rent ($)
Median contract rent - Lower quartile ($)
Median contract rent - Upper quartile ($)
Median gross rent ($)
Urban houses (%)
Rural houses (%)
Houses occupied (%)
Houses occupied (% change since 2000)
Houses owner occupied (%)
Houses owner occupied (% change since 2000)
Houses renter occupied (%)
Houses renter occupied (% change since 2000)
Vacant housing units - For rent (%)
Vacant housing units - For rent (% change since 2000)
Vacant housing units - For sale only (%)
Vacant housing units - For sale only (% change since 2000)
Vacant housing units - Rented or sold, not occupied (%)
Vacant housing units - Rented or sold, not occupied (% change since 2000)
Vacant housing units - For seasonal, recreational, or occasional use (%)
Vacant housing units - For seasonal, recreational, or occasional use (% change since 2000)
Vacant housing units - For migrant workers (%)
Vacant housing units - For migrant workers (% change since 2000)
Vacant housing units - Other vacant (%)
Vacant housing units - Other vacant (% change since 2000)
Median monthly housing costs ($)
Median household income for houses/condos with a mortgage ($)
Median household income for houses/condos without a mortgage ($)
Median household income ($)
Median household income ($) - White
Median household income ($) - Black or African American
Median household income ($) - Asian
Median household income ($) - Hispanic or Latino
Median household income ($) - American Indian and Alaska Native
Median household income ($) - Multirace
Median household income ($) - Other Race
Mortgage status - with mortgage (%)
Mortgage status - with second mortgage (%)
Mortgage status - with home equity loan (%)
Mortgage status - with both second mortgage and home equity loan (%)
Mortgage status - without a mortgage (%)
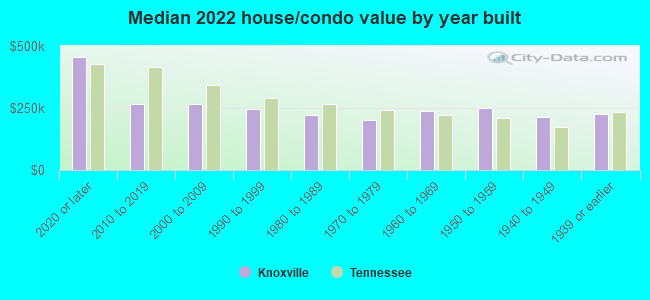
Median year house/condo built
Median year apartment built
Household type by relationship - Male householder living alone (%)
Household type by relationship - Male householder not living alone (%)
Household type by relationship - Female householder living alone (%)
Household type by relationship - Female householder not living alone (%)
Household type by relationship - Opposite-Sex spouse (%)
Household type by relationship - Same-Sex spouse (%)
Household type by relationship - Opposite-Sex unmarried partner (%)
Household type by relationship - Same-Sex unmarried partner (%)
Household type by relationship - In group quarters (%)
Size of family households - 2-person household (%)
Size of family households - 3-person household (%)
Size of family households - 4-person household (%)
Size of family households - 5-person household (%)
Size of family households - 6-person household (%)
Size of family households - 7-or-more-person household (%)
Size of nonfamily households - 1-person household (%)
Size of nonfamily households - 2-person household (%)
Size of nonfamily households - 3-person household (%)
Size of nonfamily households - 4-person household (%)
Size of nonfamily households - 5-person household (%)
Size of nonfamily households - 6-person household (%)
Size of nonfamily households - 7-or-moreperson household (%)
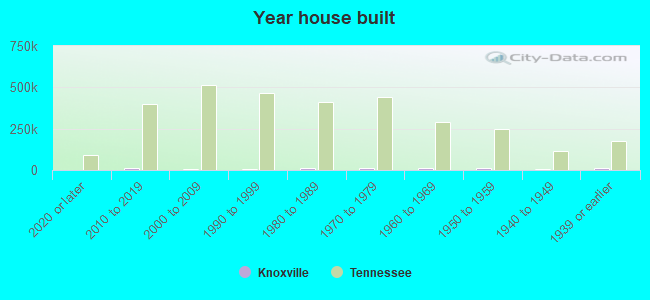
Year house built - Built 2010 or later (%)
Year house built - Built 2000 to 2009 (%)
Year house built - Built 1990 to 1999 (%)
Year house built - Built 1980 to 1989 (%)
Year house built - Built 1970 to 1979 (%)
Year house built - Built 1960 to 1969 (%)
Year house built - Built 1950 to 1959 (%)
Year house built - Built 1940 to 1949 (%)
Year house built - Built 1939 or earlier (%)
Median number of rooms in houses and condos
Median number of rooms in apartments
Median number of bedrooms in owner occupied houses
Mean number of bedrooms in owner occupied houses
Median number of bedrooms in renter occupied houses
Mean number of bedrooms in renter occupied houses
Median number of vehichles in owner occupied houses
Mean number of vehichles in owner occupied houses
Median number of vehichles in renter occupied houses
Mean number of vehichles in renter occupied houses
Rooms in owner-occupied houses - 1 room (%)
Rooms in owner-occupied houses - 2 rooms (%)
Rooms in owner-occupied houses - 3 rooms (%)
Rooms in owner-occupied houses - 4 rooms (%)
Rooms in owner-occupied houses - 5 rooms (%)
Rooms in owner-occupied houses - 6 rooms (%)
Rooms in owner-occupied houses - 7 rooms (%)
Rooms in owner-occupied houses - 8 rooms (%)
Rooms in owner-occupied houses - 9+ rooms (%)
Rooms in renter-occupied houses - 1 room (%)
Rooms in renter-occupied houses - 2 rooms (%)
Rooms in renter-occupied houses - 3 rooms (%)
Rooms in renter-occupied houses - 4 rooms (%)
Rooms in renter-occupied houses - 5 rooms (%)
Rooms in renter-occupied houses - 6 rooms (%)
Rooms in renter-occupied houses - 7 rooms (%)
Rooms in renter-occupied houses - 8 rooms (%)
Rooms in renter-occupied houses - 9+ rooms (%)
Bedrooms in owner-occupied houses - no bedrooms (%)
Bedrooms in owner-occupied houses - 1 bedroom (%)
Bedrooms in owner-occupied houses - 2 bedrooms (%)
Bedrooms in owner-occupied houses - 3 bedrooms (%)
Bedrooms in owner-occupied houses - 4 bedrooms (%)
Bedrooms in owner-occupied houses - 5+ bedrooms (%)
Bedrooms in renter-occupied houses - no bedrooms (%)
Bedrooms in renter-occupied houses - 1 bedroom (%)
Bedrooms in renter-occupied houses - 2 bedrooms (%)
Bedrooms in renter-occupied houses - 3 bedrooms (%)
Bedrooms in renter-occupied houses - 4 bedrooms (%)
Bedrooms in renter-occupied houses - 5+ bedrooms (%)
Vehicles available in owner-occupied houses - no vehicle available (%)
Vehicles available in owner-occupied houses - 1 vehicle available(%)
Vehicles available in owner-occupied houses - 2 Vehicles available (%)
Vehicles available in owner-occupied houses - 3 Vehicles available (%)
Vehicles available in owner-occupied houses - 4 Vehicles available (%)
Vehicles available in owner-occupied houses - 5+ Vehicles available (%)
Vehicles available in renter-occupied houses - no vehicle available (%)
Vehicles available in renter-occupied houses - 1 vehicle available (%)
Vehicles available in renter-occupied houses - 2 Vehicles available (%)
Vehicles available in renter-occupied houses - 3 Vehicles available (%)
Vehicles available in renter-occupied houses - 4 Vehicles available (%)
Vehicles available in renter-occupied houses - 5+ Vehicles available (%)
Housing units in structures - 1, detached (%)
Housing units in structures - 1, attached (%)
Housing units in structures - 2 (%)
Housing units in structures - 3 or 4 (%)
Housing units in structures - 5 to 9 (%)
Housing units in structures - 10 to 19 (%)
Housing units in structures - 20 to 49 (%)
Housing units in structures - 50 or more (%)
Housing units in structures - Mobile home (%)
Housing units in structures - Boat, RV, van, etc. (%)
Housing units in structures - Owners - 1, detached (%)
Housing units in structures - Owners - 1, attached (%)
Housing units in structures - Owners - 2 (%)
Housing units in structures - Owners - 3 or 4 (%)
Housing units in structures - Owners - 5 to 9 (%)
Housing units in structures - Owners - 10 to 19 (%)
Housing units in structures - Owners - 20 to 49 (%)
Housing units in structures - Owners - 50 or more (%)
Housing units in structures - Owners - Mobile home (%)
Housing units in structures - Owners - Boat, RV, van, etc. (%)
Housing units in structures - Renters - 1, detached (%)
Housing units in structures - Renters - 1, attached (%)
Housing units in structures - Renters - 2 (%)
Housing units in structures - Renters - 3 or 4 (%)
Housing units in structures - Renters - 5 to 9 (%)
Housing units in structures - Renters - 10 to 19 (%)
Housing units in structures - Renters - 20 to 49 (%)
Housing units in structures - Renters - 50 or more (%)
Housing units in structures - Renters - Mobile home (%)
Housing units in structures - Renters - Boat, RV, van, etc. (%)
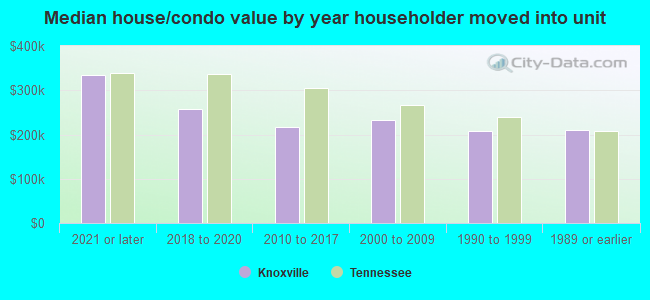
House/condo owner moved in on average (years ago)
Renter moved in on average (years ago)
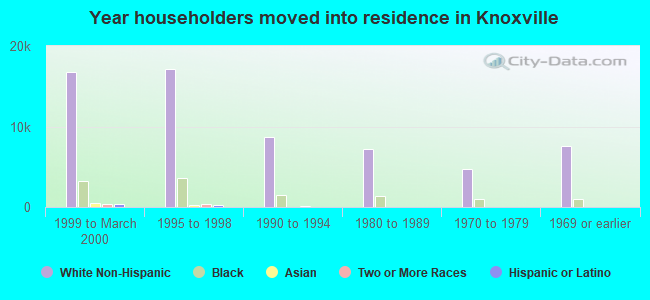
Year householder moved into unit - Moved in 1999 to March 2000 (%)
Year householder moved into unit - Moved in 1999 to March 2000 (%) - White
Year householder moved into unit - Moved in 1999 to March 2000 (%) - Black or African American
Year householder moved into unit - Moved in 1999 to March 2000 (%) - Asian
Year householder moved into unit - Moved in 1999 to March 2000 (%) - Hispanic or Latino
Year householder moved into unit - Moved in 1999 to March 2000 (%) - American Indian and Alaska Native
Year householder moved into unit - Moved in 1999 to March 2000 (%) - Multirace
Year householder moved into unit - Moved in 1999 to March 2000 (%) - Other Race
Year householder moved into unit - Moved in 1995 to 1998 (%)
Year householder moved into unit - Moved in 1995 to 1998 (%) - White
Year householder moved into unit - Moved in 1995 to 1998 (%) - Black or African American
Year householder moved into unit - Moved in 1995 to 1998 (%) - Asian
Year householder moved into unit - Moved in 1995 to 1998 (%) - Hispanic or Latino
Year householder moved into unit - Moved in 1995 to 1998 (%) - American Indian and Alaska Native
Year householder moved into unit - Moved in 1995 to 1998 (%) - Multirace
Year householder moved into unit - Moved in 1995 to 1998 (%) - Other Race
Year householder moved into unit - Moved in 1990 to 1994 (%)
Year householder moved into unit - Moved in 1990 to 1994 (%) - White
Year householder moved into unit - Moved in 1990 to 1994 (%) - Black or African American
Year householder moved into unit - Moved in 1990 to 1994 (%) - Asian
Year householder moved into unit - Moved in 1990 to 1994 (%) - Hispanic or Latino
Year householder moved into unit - Moved in 1990 to 1994 (%) - American Indian and Alaska Native
Year householder moved into unit - Moved in 1990 to 1994 (%) - Multirace
Year householder moved into unit - Moved in 1990 to 1994 (%) - Other Race
Year householder moved into unit - Moved in 1980 to 1989 (%)
Year householder moved into unit - Moved in 1980 to 1989 (%) - White
Year householder moved into unit - Moved in 1980 to 1989 (%) - Black or African American
Year householder moved into unit - Moved in 1980 to 1989 (%) - Asian
Year householder moved into unit - Moved in 1980 to 1989 (%) - Hispanic or Latino
Year householder moved into unit - Moved in 1980 to 1989 (%) - American Indian and Alaska Native
Year householder moved into unit - Moved in 1980 to 1989 (%) - Multirace
Year householder moved into unit - Moved in 1980 to 1989 (%) - Other Race
Year householder moved into unit - Moved in 1970 to 1979 (%)
Year householder moved into unit - Moved in 1970 to 1979 (%) - White
Year householder moved into unit - Moved in 1970 to 1979 (%) - Black or African American
Year householder moved into unit - Moved in 1970 to 1979 (%) - Asian
Year householder moved into unit - Moved in 1970 to 1979 (%) - Hispanic or Latino
Year householder moved into unit - Moved in 1970 to 1979 (%) - American Indian and Alaska Native
Year householder moved into unit - Moved in 1970 to 1979 (%) - Multirace
Year householder moved into unit - Moved in 1970 to 1979 (%) - Other Race
Year householder moved into unit - Moved in 1969 or earlier (%)
Year householder moved into unit - Moved in 1969 or earlier (%) - White
Year householder moved into unit - Moved in 1969 or earlier (%) - Black or African American
Year householder moved into unit - Moved in 1969 or earlier (%) - Asian
Year householder moved into unit - Moved in 1969 or earlier (%) - Hispanic or Latino
Year householder moved into unit - Moved in 1969 or earlier (%) - American Indian and Alaska Native
Year householder moved into unit - Moved in 1969 or earlier (%) - Multirace
Year householder moved into unit - Moved in 1969 or earlier (%) - Other Race
Housing units lacking complete plumbing facilities (%)
Housing units lacking complete kitchen facilities (%)
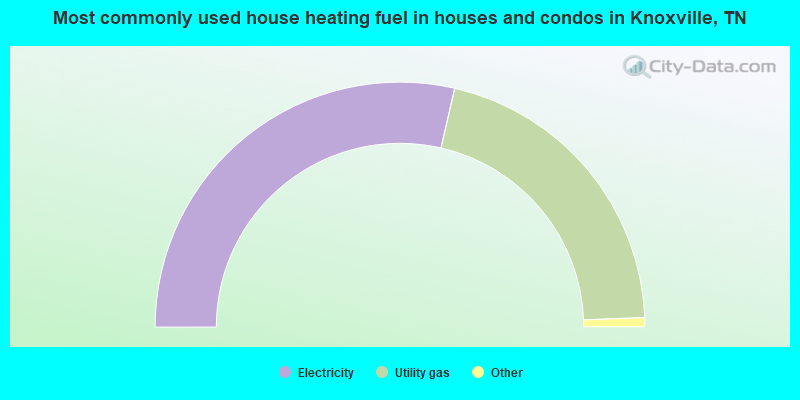
House heating fuel used in houses and condos - Utility gas (%)
House heating fuel used in houses and condos - Bottled, tank, or LP gas (%)
House heating fuel used in houses and condos - Electricity (%)
House heating fuel used in houses and condos - Fuel oil, kerosene, etc. (%)
House heating fuel used in houses and condos - Coal or coke (%)
House heating fuel used in houses and condos - Wood (%)
House heating fuel used in houses and condos - Solar energy (%)
House heating fuel used in houses and condos - Other fuel (%)
House heating fuel used in houses and condos - No fuel used (%)
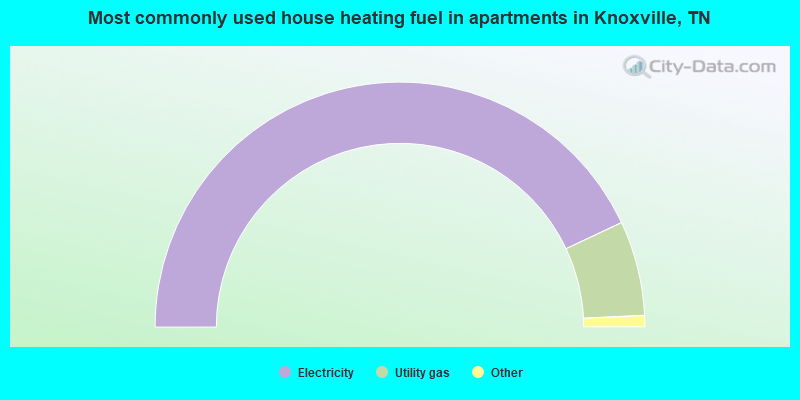
House heating fuel used in apartments - Utility gas (%)
House heating fuel used in apartments - Bottled, tank, or LP gas (%)
House heating fuel used in apartments - Electricity (%)
House heating fuel used in apartments - Fuel oil, kerosene, etc. (%)
House heating fuel used in apartments - Coal or coke (%)
House heating fuel used in apartments - Wood (%)
House heating fuel used in apartments - Solar energy (%)
House heating fuel used in apartments - Other fuel (%)
House heating fuel used in apartments - No fuel used (%)
Latest news about housing in Knoxville, TN collected exclusively by city-data.com from local newspapers, TV, and radio stations
Median year house/condo built: 1967Median year apartment built: 1980Household type by relationship:
Households: 195,871
Male householders: 40,502 (16,367 living alone ), Female householders: 44,802 (18,425 living alone )25,437 spouses (24,928 opposite-sex spouses ), 8,173 unmarried partners , (7,556 opposite-sex unmarried partners ), 38,755 children (36,327 natural , 901 adopted , 1,527 stepchildren ), 5,597 grandchildren , 2,356 brothers or sisters , 2,055 parents , 509 foster children , 2,127 other relatives , 13,981 non-relatives In group quarters: 11,577
Size of family households: 20,777 2-persons , 8,946 3-persons , 6,261 4-persons , 2,549 5-persons , 626 6-persons , 1,166 7-or-more-persons .
Size of nonfamily households: 34,792 1-person , 7,534 2-persons , 1,313 3-persons , 962 4-persons , 153 5-persons , 42 6-persons , 183 7-or-more-persons .
14,736 married couples with children. single-parent households (2,987 men , 9,322 women ).
90.6% of residents of Knoxville speak English at home. of residents speak Spanish at home (52% speak English very well , 22% speak English well , 26% speak English not well , 1% don't speak English at all ).of residents speak other Indo-European language at home (71% speak English very well , 18% speak English well , 6% speak English not well , 5% don't speak English at all ).of residents speak Asian or Pacific Island language at home (58% speak English very well , 31% speak English well , 9% speak English not well , 1% don't speak English at all ).of residents speak other language at home (55% speak English very well , 24% speak English well , 20% speak English not well , 1% don't speak English at all ).
Foreign born population: 10,631 (5.4%)of them are naturalized citizens )
Median number of rooms in houses and condos:
Median number of rooms in apartments
Owner-occupied Renter-occupied
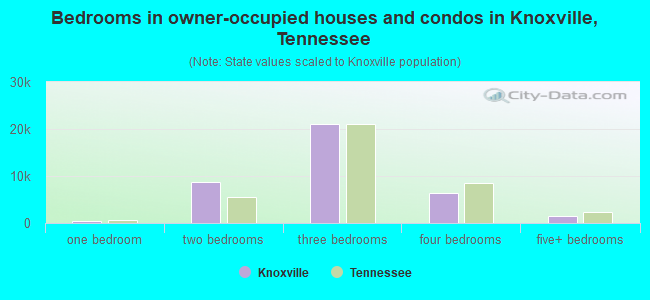
Bedrooms in owner-occupied houses and condos in Knoxville, Tennessee
32 no bedroom 509 1 bedroom 8,673 2 bedrooms 21,130 3 bedrooms 6,467 4 bedrooms 1,413 5+ bedrooms
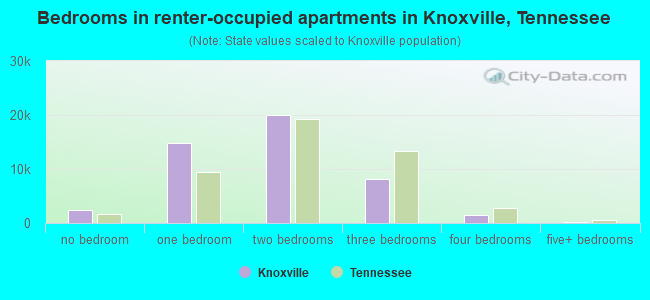
Bedrooms in renter-occupied apartments in Knoxville, Tennessee
2,374 no bedroom 14,762 1 bedroom 20,070 2 bedrooms 8,086 3 bedrooms 1,542 4 bedrooms 246 5+ bedrooms
Owner-occupied Renter-occupied
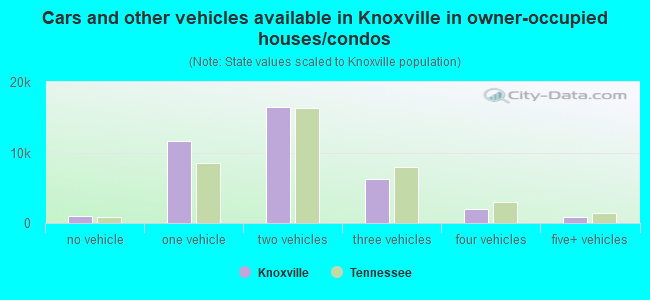
Cars and other vehicles available in Knoxville in owner-occupied houses/condos
983 no vehicle 11,561 1 vehicle 16,492 2 vehicles 6,299 3 vehicles 1,983 4 vehicles 906 5+ vehicles
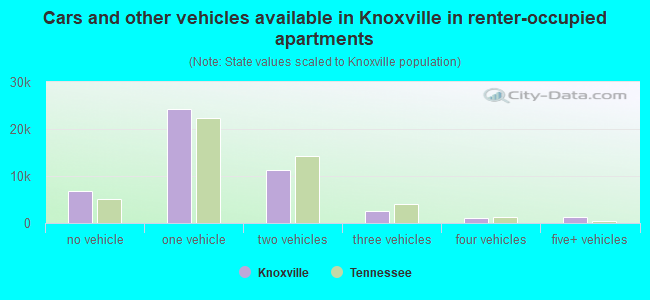
Cars and other vehicles available in Knoxville in renter-occupied apartments
6,771 no vehicle 24,290 1 vehicle 11,249 2 vehicles 2,460 3 vehicles 1,095 4 vehicles 1,215 5+ vehicles
Owner-occupied Renter-occupied
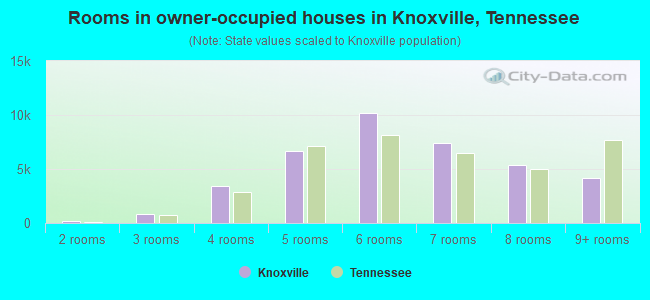
Rooms in owner-occupied houses in Knoxville, Tennessee
32 1 room 170 2 rooms 814 3 rooms 3,466 4 rooms 6,655 5 rooms 10,182 6 rooms 7,373 7 rooms 5,360 8 rooms 4,172 9+ rooms
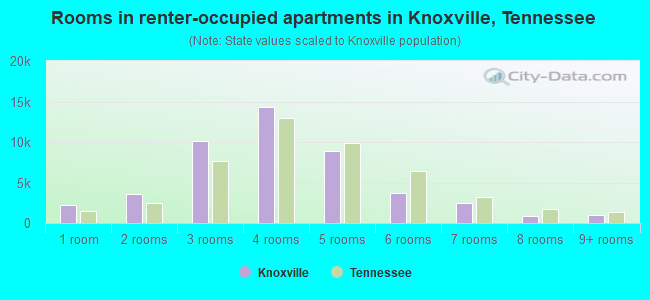
Rooms in renter-occupied apartments in Knoxville, Tennessee
2,197 1 room 3,563 2 rooms 10,111 3 rooms 14,378 4 rooms 8,945 5 rooms 3,672 6 rooms 2,455 7 rooms 812 8 rooms 947 9+ rooms
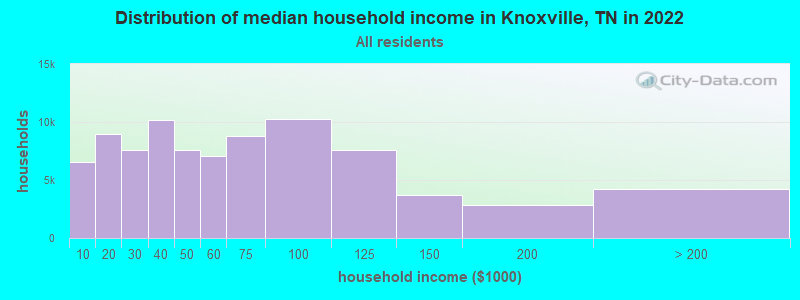
Knoxville, TN household income distribution 6,515 Less than $10,0008,987 $10,000 to $19,9997,587 $20,000 to $29,99910,209 $30,000 to $39,9997,606 $40,000 to $49,9997,075 $50,000 to $59,9998,768 $60,000 to $74,99910,251 $75,000 to $99,9997,562 $100,000 to $124,9993,671 $125,000 to $149,9992,840 $150,000 to $199,9994,233 $200,000 or more
Home value of owner - occupied houses in 2022 in Knoxville, TN 505 Less than $10,000144 $15,000 to $19,99959 $20,000 to $24,99974 $35,000 to $39,999175 $40,000 to $49,999165 $50,000 to $59,999880 $60,000 to $69,999431 $70,000 to $79,999600 $80,000 to $89,999891 $90,000 to $99,9991,808 $100,000 to $124,9991,403 $125,000 to $149,9994,135 $150,000 to $174,9992,089 $175,000 to $199,9997,717 $200,000 to $249,9995,761 $250,000 to $299,9994,977 $300,000 to $399,9992,769 $400,000 to $499,9992,492 $500,000 to $749,999773 $750,000 to $999,999142 $1,000,000 to $1,499,99938 $1,500,000 to $1,999,999196 $2,000,000 or moreRent paid by renters in 2022 in Knoxville, TN 192 Less than $100736 $100 to $149954 $150 to $199591 $200 to $249756 $250 to $299451 $300 to $349241 $350 to $399754 $400 to $4491,254 $450 to $4991,029 $500 to $549692 $550 to $5992,234 $600 to $6491,870 $650 to $6992,387 $700 to $7492,674 $750 to $7996,708 $800 to $8994,967 $900 to $9997,016 $1,000 to $1,2493,438 $1,250 to $1,4994,859 $1,500 to $1,9991,427 $2,000 to $2,499196 $3,000 to $3,49989 $3,500 or more1,565 No cash rent
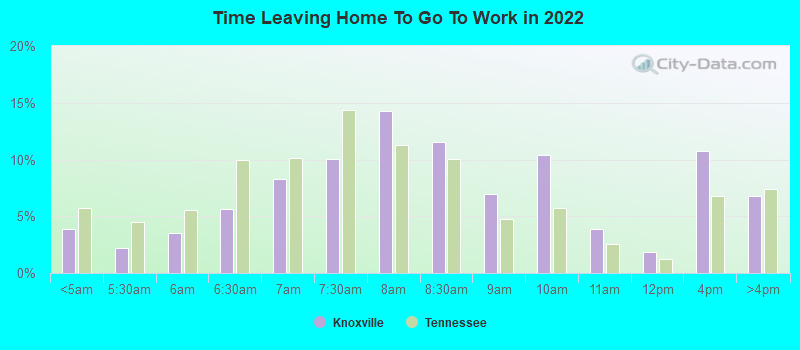
Percentage of workers working in this county: 89.1%Number of people working at home: 13,081 (12.7% of all workers )
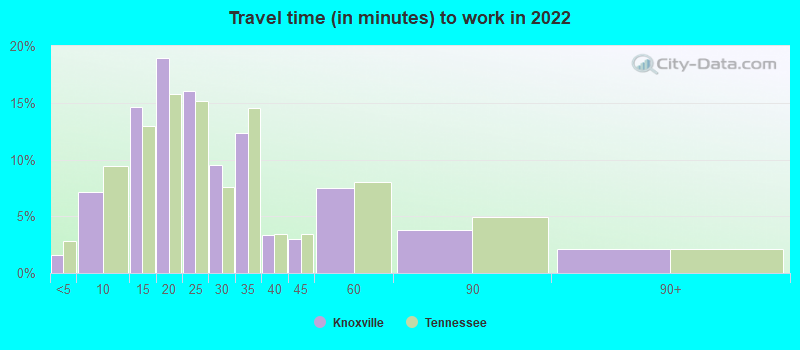
Travel time to work (commute)
Less than 5 minutes: 2,3015 to 9 minutes: 9,21210 to 14 minutes: 18,61215 to 19 minutes: 21,40120 to 24 minutes: 13,91125 to 29 minutes: 7,49630 to 34 minutes: 7,99935 to 39 minutes: 1,40040 to 44 minutes: 1,78145 to 59 minutes: 3,55560 to 89 minutes: 1,59190 or more minutes: 1,025
Means of transportation to work:
Drove a car alone: 160,951 (81.5%)Carpooled: 17,133 (8.7%)Bus : 515 (0.3%)Taxi: 1,691 (0.9%)Bicycle: 397 (0.2%)Walked: 3,795 (1.9%)Worked at home: 13,081 (6.6%)
Unemployment by race in 2022
Unemployment rate for White non-Hispanic residents 2.4% Males2.8% FemalesUnemployment rate for Black residents 2.1% Males1.6% FemalesUnemployment rate for American Indian and Alaska Native residents 11.6% MalesUnemployment rate for Asian residents 0.8% Males2.6% FemalesUnemployment rate for other race residents 1.0% Males5.2% FemalesUnemployment rate for two or more race residents 2.6% Males6.3% FemalesUnemployment rate for Hispanic or Latino residents 1.1% Males5.2% Females
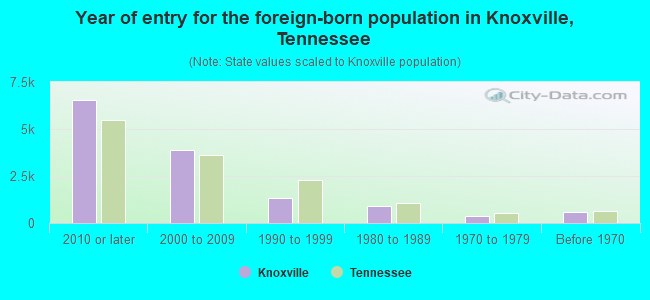
Year of entry for the foreign-born population in Knoxville, Tennessee
6,555 2010 or later 3,865 2000 to 2009 1,308 1990 to 1999 907 1980 to 1989 374 1970 to 1979 611 Before 1970
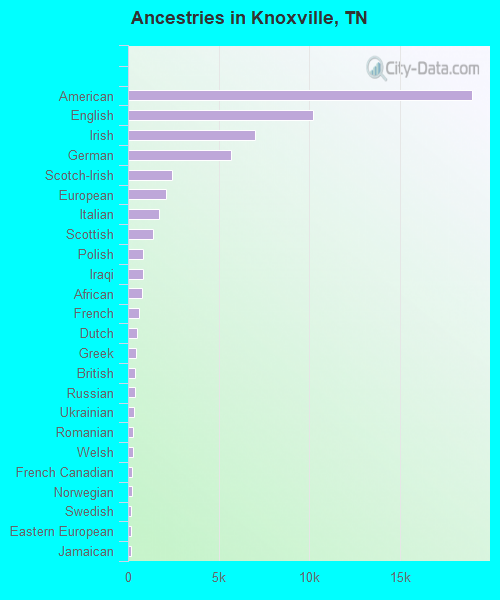
First ancestries reported:
American: 18,987 (18.4%)
English: 10,236 (9.9%)
Irish: 7,020 (6.8%)
German: 5,670 (5.5%)
Scotch-Irish: 2,438 (2.4%)
European: 2,112 (2.0%)
Italian: 1,718 (1.7%)
Scottish: 1,389 (1.3%)
Polish: 827 (0.8%)
Iraqi: 807 (0.8%)
African: 770 (0.7%)
French: 605 (0.6%)
Dutch: 501 (0.5%)
Greek: 454 (0.4%)
British: 399 (0.4%)
Russian: 394 (0.4%)
Ukrainian: 333 (0.3%)
Romanian: 282 (0.3%)
Welsh: 249 (0.2%)
French Canadian: 226 (0.2%)
Norwegian: 222 (0.2%)
Swedish: 190 (0.2%)
Eastern European: 181 (0.2%)
Jamaican: 174 (0.2%)
Swiss: 151 (0.1%)
Guyanese: 139 (0.1%)
Northern European: 132 (0.1%)
Sudanese: 123 (0.1%)
Nigerian: 116 (0.1%)
Ethiopian: 102 (0.10%)
Canadian: 95 (0.09%)
Palestinian: 95 (0.09%)
Czech: 95 (0.09%)
Egyptian: 92 (0.09%)
Hungarian: 85 (0.08%)
Danish: 82 (0.08%)
Scandinavian: 79 (0.08%)
Lebanese: 72 (0.07%)
Iranian: 70 (0.07%)
Turkish: 65 (0.06%)
Haitian: 61 (0.06%)
British West Indian: 59 (0.06%)
Jordanian: 49 (0.05%)
Arab: 47 (0.05%)
Afghan: 46 (0.04%)
Kenyan: 39 (0.04%)
South African: 38 (0.04%)
Yugoslavian: 38 (0.04%)
Pennsylvania German: 38 (0.04%)
Finnish: 37 (0.04%)
Portuguese: 37 (0.04%)
Ghanaian: 36 (0.03%)
Estonian: 35 (0.03%)
Bahamian: 34 (0.03%)
Cape Verdean: 33 (0.03%)
Syrian: 33 (0.03%)
Austrian: 31 (0.03%)
Celtic: 26 (0.03%)
Brazilian: 26 (0.03%)
Slovak: 26 (0.03%)
Albanian: 24 (0.02%)
Slovene: 21 (0.02%)
Somali: 21 (0.02%)
Armenian: 20 (0.02%)
Belgian: 19 (0.02%)
Bulgarian: 17 (0.02%)
Serbian: 14 (0.01%)
Luxembourger: 11 (0.01%)
Dutch West Indian: 11 (0.01%)
Macedonian: 8 (0.01%)
Croatian: 8 (0.01%)
Lithuanian: 7 (0.01%)
Australian: 6 (0.01%)
Most common places of birth for foreign-born residents (%): Mexico Knoxville:
15.5% (1,950)Tennessee:
23.0% (86,435)
Guatemala Knoxville:
10.5% (1,319)Tennessee:
5.7% (21,286)
Iraq Knoxville:
5.1% (640)Tennessee:
2.0% (7,701)
China, excluding Hong Kong and Taiwan Knoxville:
4.3% (536)Tennessee:
3.3% (12,582)
Honduras Knoxville:
4.0% (497)Tennessee:
4.6% (17,433)
India Knoxville:
2.5% (309)Tennessee:
6.1% (23,079)
Canada Knoxville:
2.2% (278)Tennessee:
2.7% (10,295)
Germany Knoxville:
2.1% (260)Tennessee:
2.2% (8,261)
Philippines Knoxville:
2.0% (257)Tennessee:
3.1% (11,640)
Other Northern Africa Knoxville:
1.9% (234)Tennessee:
0.1% (276)
Colombia Knoxville:
1.8% (229)Tennessee:
1.0% (3,879)
Cuba Knoxville:
1.8% (225)Tennessee:
1.3% (4,841)
Place of birth for U.S.-born residents:
This state: 120,787Other state: 62,893Northeast: 8,657Midwest: 14,842South: 33,734West: 5,660 80.3% of Knoxville residents lived in the same house 1 years ago.
Out of people who lived in different houses, 34.3% lived in this county.
Out of people who lived in different counties, 60.0% lived in Tennessee.
Knoxville:
80.3%State average:
87.0%
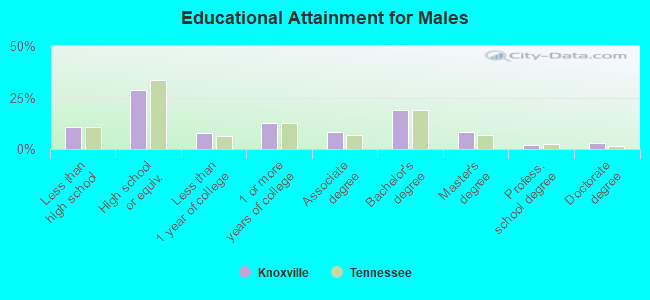
Education attainment for males 25 years and older:
No schooling: 416Nursery to 4th grade: 2225th and 6th grade: 5167th and 8th grade: 4229th grade: 1,07910th grade: 1,03111th grade: 1,83412th grade, no diploma: 746High school graduate (or equivalency): 17,121Less than 1 year of college: 4,736Some college more than 1 year, no degree: 7,501Associate degree: 5,022Bachelor's degree: 11,464Master's degree: 4,810Professional school degree: 1,261Doctorate degree: 1,816
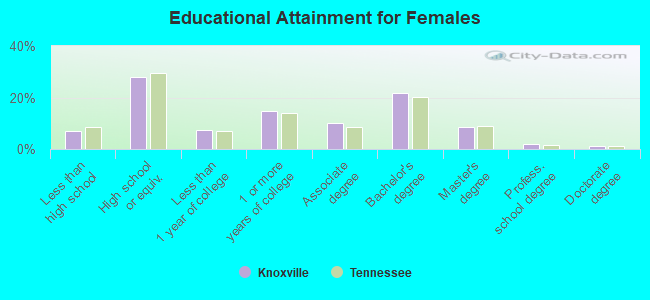
Education attainment for females 25 years and older:
No schooling: 315Nursery to 4th grade: 1495th and 6th grade: 5637th and 8th grade: 9159th grade: 24510th grade: 96811th grade: 69512th grade, no diploma: 796High school graduate (or equivalency): 18,103Less than 1 year of college: 4,707Some college more than 1 year, no degree: 9,621Associate degree: 6,488Bachelor's degree: 14,116Master's degree: 5,482Professional school degree: 1,192Doctorate degree: 689
Housing units in structures:
One, detached: 47,861One, attached: 5,602Two: 2,7523 or 4: 4,3985 to 9: 8,47210 to 19: 11,20820 to 49: 6,28450 or more: 6,767Mobile homes: 1,675Boats, RVs, vans, etc.: 87Median worth of mobile homes: $47,500
Housing units lacking complete plumbing facilities in 2022: 0.9%Housing units lacking complete kitchen facilities in 2022: 2.3%House/condo owner moved in on average 11 years ago
Renter moved in on average 2 years ago
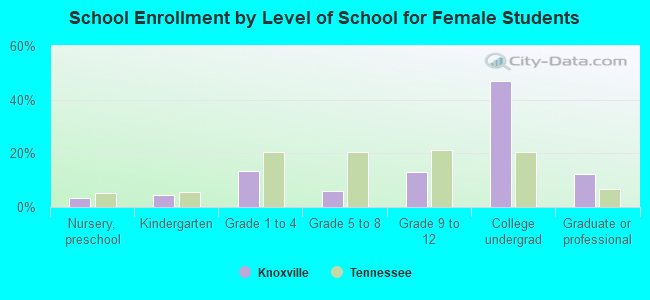
Private vs. public school enrollment:
Students in private schools in grades 1 to 8 (elementary and middle school): 1,490 Here:
11.5%Tennessee:
15.0%
Students in private schools in grades 9 to 12 (high school): 360 Students in private undergraduate colleges: 1,252