Kittrell, TN (Tennessee) Houses and Residents
| Kittrell: | $353,454 |
| Tennessee: | $284,800 |
Total population: 5,511 (Urban population: 0, Rural population: 4,198 (284 farm, 3,914 nonfarm))
Houses: 1,647 (1,555 occupied: 1,279 owner occupied, 276 renter occupied)
| % of renters here: | 18% |
| State: | 33% |
Housing density: 19 houses/condos per square mile
Median price asked for vacant for-sale houses and condos in 2022 in this county: $253,303.
Median contract rent in 2022: $1,014 (lower quartile is $764, upper quartile is $1,469)
Median gross rent in Kittrell, TN in 2022: $1,218
Housing units in Kittrell with a mortgage: 463 (39 second mortgage, 31 home equity loan, 0 both second mortgage and home equity loan)
Houses without a mortgage: 260


Household type by relationship:
Households: 257,495- In family households: 216,123 (47,244 male householders, 19,566 female householders)
49,665 spouses, 78,593 children (71,674 natural, 1,885 adopted, 5,034 stepchildren), 5,358 grandchildren, 2,494 brothers or sisters, 2,094 parents, foster children, 3,197 other relatives, 6,366 non-relatives
- In nonfamily households: 41,372 (14,507 male householders (9,879 living alone)), 14,915 female householders (11,391 living alone)), 11,950 nonrelatives
- In group quarters: 5,109 (1,988 institutionalized population)
34,150 married couples with children.
9,873 single-parent households (2,144 men, 7,729 women).
98.2% of residents of Kittrell speak English at home.
0.8% of residents speak Spanish at home (77% speak English very well, 23% speak English not well).
0.2% of residents speak other Indo-European language at home (100% speak English very well).
0.5% of residents speak Asian or Pacific Island language at home (55% speak English very well, 45% speak English well).
0.3% of residents speak other language at home (100% speak English very well).
Foreign born population: 228 (2.7%)
(0.0% of them are naturalized citizens)
| Here: | 6.5 |
| State: | 6.5 |
| Here: | 4.4 |
| State: | 4.4 |

- Bedrooms in owner-occupied houses and condos in Kittrell, Tennessee
- 7no bedroom
- 301 bedroom
- 2682 bedrooms
- 8043 bedrooms
- 1484 bedrooms
- 225+ bedrooms

- Bedrooms in renter-occupied apartments in Kittrell, Tennessee
- 0no bedroom
- 71 bedroom
- 1802 bedrooms
- 823 bedrooms
- 74 bedrooms
- 05+ bedrooms

- Cars and other vehicles available in Kittrell in owner-occupied houses/condos
- 14no vehicle
- 3371 vehicle
- 4622 vehicles
- 3013 vehicles
- 1314 vehicles
- 345+ vehicles

- Cars and other vehicles available in Kittrell in renter-occupied apartments
- 28no vehicle
- 1031 vehicle
- 752 vehicles
- 403 vehicles
- 304 vehicles
- 05+ vehicles

- Rooms in owner-occupied houses in Kittrell, Tennessee
- 71 room
- 62 rooms
- 373 rooms
- 1334 rooms
- 3025 rooms
- 3116 rooms
- 2707 rooms
- 1388 rooms
- 759+ rooms

- Rooms in renter-occupied apartments in Kittrell, Tennessee
- 01 room
- 02 rooms
- 73 rooms
- 884 rooms
- 1295 rooms
- 336 rooms
- 197 rooms
- 08 rooms
- 09+ rooms


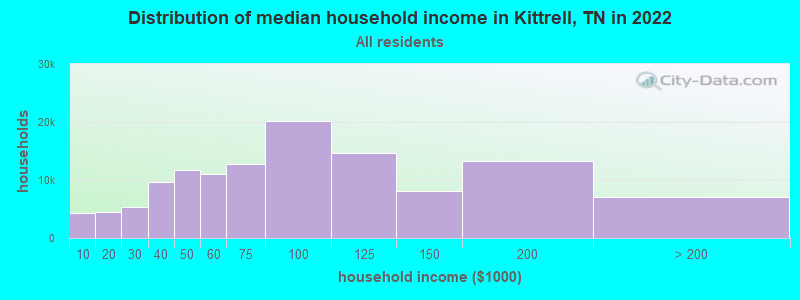
Kittrell, TN household income distribution

- 4,296Less than $10,000
- 4,565$10,000 to $19,999
- 5,423$20,000 to $29,999
- 9,574$30,000 to $39,999
- 11,734$40,000 to $49,999
- 10,987$50,000 to $59,999
- 12,816$60,000 to $74,999
- 20,108$75,000 to $99,999
- 14,720$100,000 to $124,999
- 8,039$125,000 to $149,999
- 13,290$150,000 to $199,999
- 7,096$200,000 or more
Percentage of workers working in this county: 94.2%
Number of people working at home: 618 (14.2% of all workers)
Travel time to work (commute)
- Less than 5 minutes: 69
- 5 to 9 minutes: 54
- 10 to 14 minutes: 119
- 15 to 19 minutes: 324
- 20 to 24 minutes: 417
- 25 to 29 minutes: 168
- 30 to 34 minutes: 281
- 35 to 39 minutes: 115
- 40 to 44 minutes: 84
- 45 to 59 minutes: 232
- 60 to 89 minutes: 146
- 90 or more minutes: 45
Means of transportation to work:
- Drove a car alone: 1,691 (80.7%)
- Carpooled: 350 (16.7%)
- Other means: 13 (0.6%)
- Worked at home: 41 (2.0%)


- Year of entry for the foreign-born population in Kittrell, Tennessee
- 51995 to March 2000
- 51990 to 1994
- 271985 to 1989
- 01980 to 1984
- 01975 to 1979
- 01970 to 1974
- 01965 to 1969
- 0Before 1965
Most common places of birth for foreign-born residents (%):
| Kittrell: | 54.1% (20) |
| Tennessee: | 2.6% (4,078) |
| Kittrell: | 18.9% (7) |
| Tennessee: | 4.8% (7,701) |
| Kittrell: | 13.5% (5) |
| Tennessee: | 0.2% (366) |
| Kittrell: | 13.5% (5) |
| Tennessee: | 2.7% (4,288) |
Place of birth for U.S.-born residents:
- This state: 3,026
- Other state: 1,123
- Northeast: 98
- Midwest: 442
- South: 509
- West: 74
67% of Kittrell residents lived in the same house 5 years ago.
Out of people who lived in different houses, 64% lived in this county.
Out of people who lived in different counties, 47% lived in Tennessee.
Education attainment for males 25 years and older:
- No schooling: 8
- Nursery to 4th grade: 0
- 5th and 6th grade: 28
- 7th and 8th grade: 108
- 9th grade: 33
- 10th grade: 32
- 11th grade: 138
- 12th grade, no diploma: 31
- High school graduate (or equivalency): 574
- Less than 1 year of college: 72
- Some college more than 1 year, no degree: 148
- Associate degree: 28
- Bachelor's degree: 97
- Master's degree: 44
- Professional school degree: 13
- Doctorate degree: 10

Education attainment for females 25 years and older:
- No schooling: 26
- Nursery to 4th grade: 0
- 5th and 6th grade: 7
- 7th and 8th grade: 31
- 9th grade: 67
- 10th grade: 38
- 11th grade: 75
- 12th grade, no diploma: 66
- High school graduate (or equivalency): 599
- Less than 1 year of college: 64
- Some college more than 1 year, no degree: 148
- Associate degree: 29
- Bachelor's degree: 168
- Master's degree: 43
- Professional school degree: 14
- Doctorate degree: 16


Housing units in structures:
- One, detached: 1,264
- One, attached: 20
- Mobile homes: 356
- Boats, RVs, vans, etc.: 7
Median worth of mobile homes: $162,100
Housing units lacking complete kitchen facilities: 0.8%

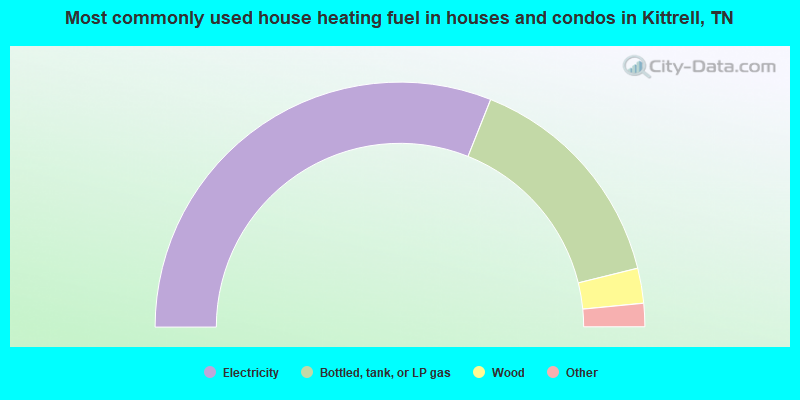
- 62.1%Electricity
- 30.2%Bottled, tank, or LP gas
- 4.6%Wood
- 2.2%Utility gas
- 0.5%Fuel oil, kerosene, etc.
- 0.5%No fuel used
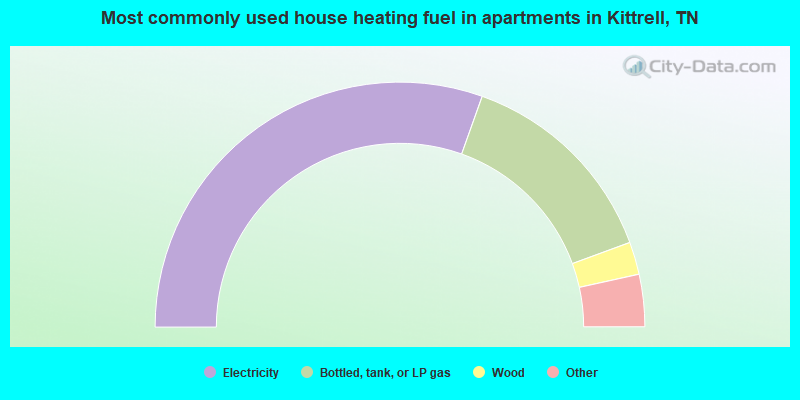
- 60.9%Electricity
- 27.9%Bottled, tank, or LP gas
- 4.3%Wood
- 2.5%Coal or coke
- 2.2%Utility gas
- 2.2%Fuel oil, kerosene, etc.
Private vs. public school enrollment:
| Here: | 8.2% |
| Tennessee: | 9.5% |
| Here: | 5.7% |
| Tennessee: | 10.4% |
| Here: | 9.2% |
| Tennessee: | 22.8% |


