Kingston, NY (New York) Houses and Residents
| Kingston: | $289,644 |
| New York: | $400,400 |
Mean price in 2022:
Detached houses: $270,153
Here: $270,153 State: $476,719 Townhouses or other attached units: $305,331
Here: $305,331 State: $699,270 In 2-unit structures: $441,717
Here: $441,717 State: $713,077 In 3-to-4-unit structures: $276,481
Here: $276,481 State: $764,568 In 5-or-more-unit structures: $102,961
Here: $102,961 State: $912,009
Total population: 23,557 (Urban population: 23,387, Rural population: 0)
Houses: 10,980 (9,885 occupied: 4,875 owner occupied, 5,342 renter occupied)
| % of renters here: | 52% |
| State: | 46% |
Housing density: 1,493 houses/condos per square mile
Median price asked for vacant for-sale houses and condos in 2022: $147,975.
Median contract rent in 2022: $1,197 (lower quartile is $896, upper quartile is $1,596)
Median rent asked for vacant for-rent units in 2022: $1,675
Median gross rent in Kingston, NY in 2022: $1,448
Housing units in Kingston with a mortgage: 3,251 (274 second mortgage, 4 home equity loan, 259 both second mortgage and home equity loan)
Houses without a mortgage: 159
Median household income for houses/condos with a mortgage: $104,686
Median household income for apartments without a mortgage: $68,480
Median monthly housing costs: $1,451
Compare current foreclosures in Kingston, NY:
| Photo | Address | Area | Beds / Baths | Price | Details |
|---|---|---|---|---|---|

|
#1
Dogwood St
Kingston, NY 12401
|
1,751 sq. feet
|
2 baths 4 beds |
show details | |

|
#2
Ashorkan Rd
Kingston, NY 12401
|
960 sq. feet
|
1 baths 3 beds |
show details | |

|
#3
Harwich St
Kingston, NY 12401
|
1,866 sq. feet
|
2 baths 3 beds |
show details | |

|
#4
Hallihans Hill Rd
Kingston, NY 12401
|
1,560 sq. feet
|
2 baths 3 beds |
show details | |

|
#5
Lawrenceville St
Kingston, NY 12401
|
1,764 sq. feet
|
2 baths 4 beds |
show details | |

|
#6
Wurts St
Kingston, NY 12401
|
3,482 sq. feet
|
2 baths 4 beds |
show details | |

|
#7
Jumping Brook Ln
Kingston, NY 12401
|
1,501 sq. feet
|
2 baths 4 beds |
show details | |

|
#8
Marys Ave
Kingston, NY 12401
|
904 sq. feet
|
1 baths 2 beds |
show details | |

|
#9
Prospect St
Kingston, NY 12401
|
1,758 sq. feet
|
2 baths 4 beds |
show details | |

|
#10
Wilbur Ave
Kingston, NY 12401
|
855 sq. feet
|
1 baths 2 beds |
show details |
| Photo | Address | Area | Beds / Baths | Price | Details |
|---|---|---|---|---|---|

|
#11
Downs St
Kingston, NY 12401
|
2,214 sq. feet
|
2 baths 5 beds |
show details | |

|
#12
Hickory Bush Rd
Kingston, NY 12401
|
1,092 sq. feet
|
1 baths 1 beds |
show details | |

|
#13
Fair St
Kingston, NY 12401
|
1,494 sq. feet
|
1 baths 3 beds |
show details | |

|
#14
Meadowbrook Dr
Kingston, NY 12401
|
1,839 sq. feet
|
2 baths 4 beds |
show details | |

|
#15
Kukuk Ln
Kingston, NY 12401
|
2,372 sq. feet
|
2 baths 4 beds |
show details | |

|
#16
Lapla Rd
Kingston, NY 12401
|
1,478 sq. feet
|
1 baths 2 beds |
show details | |

|
#17
Fair St
Kingston, NY 12401
|
1,581 sq. feet
|
1 baths 3 beds |
show details | |

|
#18
Clinton Ave
Kingston, NY 12401
|
2,678 sq. feet
|
2 baths 4 beds |
show details | |

|
#19
Willow St
Kingston, NY 12401
|
2,224 sq. feet
|
3 baths 5 beds |
show details | |

|
#20
Oakwood Dr
Kingston, NY 12401
|
1,102 sq. feet
|
1 baths 2 beds |
show details |
| Photo | Address | Area | Beds / Baths | Price | Details |
|---|---|---|---|---|---|

|
#21
Van Buren St
Kingston, NY 12401
|
2,375 sq. feet
|
2 baths 6 beds |
show details | |

|
#22
4th Ave # 2
Kingston, NY 12401
|
1,553 sq. feet
|
2 baths 2 beds |
show details | |

|
#23
1st Ave
Kingston, NY 12401
|
1,444 sq. feet
|
1 baths 3 beds |
show details | |

|
#24
Fair St
Kingston, NY 12401
|
3,974 sq. feet
|
2 baths 5 beds |
show details | |

|
#25
Codwise St
Kingston, NY 12401
|
1,234 sq. feet
|
1 baths 2 beds |
show details | |

|
#26
New St
Kingston, NY 12401
|
1,690 sq. feet
|
1 baths 3 beds |
show details | |

|
#27
Downs St
Kingston, NY 12401
|
1,176 sq. feet
|
1 baths 2 beds |
show details | |

|
#28
Linderman Avenue Ext
Kingston, NY 12401
|
1,360 sq. feet
|
1 baths 2 beds |
show details | |

|
#29
Forest Hill Dr
Kingston, NY 12401
|
2,320 sq. feet
|
2 baths 4 beds |
show details | |

|
#30
Hinsdale St
Kingston, NY 12401
|
1,341 sq. feet
|
1 baths 2 beds |
show details |
| Photo | Address | Area | Beds / Baths | Price | Details |
|---|---|---|---|---|---|

|
#31
3rd Ave
Kingston, NY 12401
|
1,402 sq. feet
|
1 baths 2 beds |
show details | |

|
#32
Maiden Ln Apt 5
Kingston, NY 12401
|
- sq. feet
|
- baths - beds |
show details | |

|
#33
Lawrenceville St Apt 46
Kingston, NY 12401
|
- sq. feet
|
- baths - beds |
show details | |

|
#34
Rymrock Rd Unit 30
Kingston, NY 12401
|
- sq. feet
|
- baths - beds |
show details | |

|
#35
Wilbur Ave # 2
Kingston, NY 12401
|
- sq. feet
|
- baths - beds |
show details | |

|
#36
Canimi Way
Kingston, NY 12401
|
- sq. feet
|
- baths - beds |
show details | |

|
#37
Ulster Gardens Ct
Kingston, NY 12401
|
- sq. feet
|
- baths - beds |
show details | |

|
#38
Harwich St
Kingston, NY 12401
|
- sq. feet
|
- baths - beds |
show details | |

|
#39
Wilbur Ave Apt 709
Kingston, NY 12401
|
- sq. feet
|
- baths - beds |
show details | |

|
#40
Shufeldt St
Kingston, NY 12401
|
- sq. feet
|
- baths - beds |
show details |
| Photo | Address | Area | Beds / Baths | Price | Details |
|---|---|---|---|---|---|

|
#41
Kukuk Ln
Kingston, NY 12401
|
- sq. feet
|
- baths - beds |
show details | |

|
#42
Wiltwyck Ave
Kingston, NY 12401
|
- sq. feet
|
- baths - beds |
show details | |

|
#43
Washington Ave Ste 1d
Kingston, NY 12401
|
- sq. feet
|
- baths - beds |
show details | |

|
#44
Hudson Valley Lndg
Kingston, NY 12401
|
- sq. feet
|
- baths - beds |
show details | |

|
#45
W Oreilly St Apt 1707
Kingston, NY 12401
|
- sq. feet
|
- baths - beds |
show details | |

|
#46
Forest Hill Dr
Kingston, NY 12401
|
- sq. feet
|
- baths - beds |
show details | |

|
#47
W Chestnut St
Kingston, NY 12401
|
- sq. feet
|
- baths - beds |
show details | |

|
#48
Foxhall Ave
Kingston, NY 12401
|
- sq. feet
|
- baths - beds |
show details | |

|
Check over 1 million property listings on Foreclosure.com!
|
browse all offers | |||

Latest news about housing in Kingston, NY collected exclusively by city-data.com from local newspapers, TV, and radio stations

 | Rental communities or condo communties Upstate NY (58 replies) |
| Kingston To Get Rent Control (84 replies) |
| Report: Capital Region is New York's fourth most expensive for household spending (2 replies) |
| Upstate Cabins, Campers and Tiny Houses (34 replies) |
| Looking to find a business location from the 1970's in Kingston (2 replies) |
| Kingston and the Hudson Valley (32 replies) |

Median year apartment built: 1951
Household type by relationship:
Households: 24,039- Male householders: 4,386 (1,708 living alone), Female householders: 5,442 (1,947 living alone)
3,105 spouses (3,002 opposite-sex spouses), 1,319 unmarried partners, (1,295 opposite-sex unmarried partners), 6,686 children (6,291 natural, 103 adopted, 291 stepchildren), 657 grandchildren, 179 brothers or sisters, 199 parents, 0 foster children, 167 other relatives, 998 non-relatives
- In group quarters: 896
Size of family households: 2,152 2-persons, 1,546 3-persons, 1,013 4-persons, 319 5-persons, 159 6-persons, 78 7-or-more-persons.
Size of nonfamily households: 3,513 1-person, 1,171 2-persons, 75 3-persons, 138 4-persons, 5 7-or-more-persons.
1,838 married couples with children.
2,568 single-parent households (259 men, 2,309 women).
84.0% of residents of Kingston speak English at home.
9.8% of residents speak Spanish at home (52% speak English very well, 18% speak English well, 26% speak English not well, 4% don't speak English at all).
4.0% of residents speak other Indo-European language at home (75% speak English very well, 6% speak English well, 12% speak English not well, 7% don't speak English at all).
0.4% of residents speak Asian or Pacific Island language at home (57% speak English very well, 20% speak English well, 22% speak English not well).
1.5% of residents speak other language at home (76% speak English very well, 16% speak English well, 8% speak English not well).
Foreign born population: 3,030 (12.6%)
(41.1% of them are naturalized citizens)
| Here: | 6.4 |
| State: | 6.3 |
| Here: | 3.8 |
| State: | 3.8 |

- Bedrooms in owner-occupied houses and condos in Kingston, New York
- 0no bedroom
- 2791 bedroom
- 1,3642 bedrooms
- 2,0333 bedrooms
- 9494 bedrooms
- 2515+ bedrooms

- Bedrooms in renter-occupied apartments in Kingston, New York
- 433no bedroom
- 1,8131 bedroom
- 1,9962 bedrooms
- 9463 bedrooms
- 1434 bedrooms
- 125+ bedrooms

- Cars and other vehicles available in Kingston in owner-occupied houses/condos
- 204no vehicle
- 1,6221 vehicle
- 2,1092 vehicles
- 6013 vehicles
- 2994 vehicles
- 415+ vehicles

- Cars and other vehicles available in Kingston in renter-occupied apartments
- 1,020no vehicle
- 2,7781 vehicle
- 1,2072 vehicles
- 2893 vehicles
- 334 vehicles
- 165+ vehicles

- Rooms in owner-occupied houses in Kingston, New York
- 01 room
- 212 rooms
- 1523 rooms
- 5804 rooms
- 8085 rooms
- 1,0366 rooms
- 9467 rooms
- 6068 rooms
- 7279+ rooms

- Rooms in renter-occupied apartments in Kingston, New York
- 3451 room
- 4892 rooms
- 1,2253 rooms
- 1,3654 rooms
- 1,0635 rooms
- 4976 rooms
- 2037 rooms
- 488 rooms
- 1079+ rooms


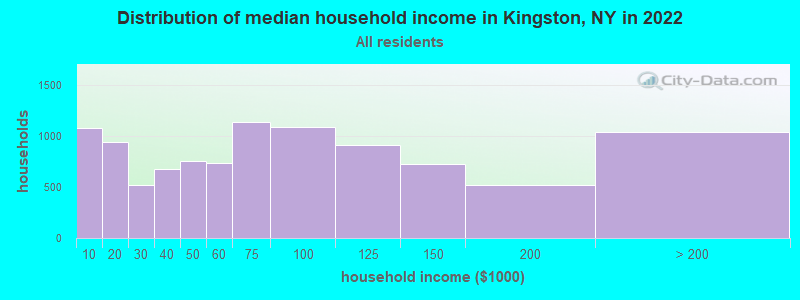
Kingston, NY household income distribution

- 1,079Less than $10,000
- 937$10,000 to $19,999
- 524$20,000 to $29,999
- 676$30,000 to $39,999
- 757$40,000 to $49,999
- 733$50,000 to $59,999
- 1,138$60,000 to $74,999
- 1,092$75,000 to $99,999
- 912$100,000 to $124,999
- 729$125,000 to $149,999
- 517$150,000 to $199,999
- 1,044$200,000 or more
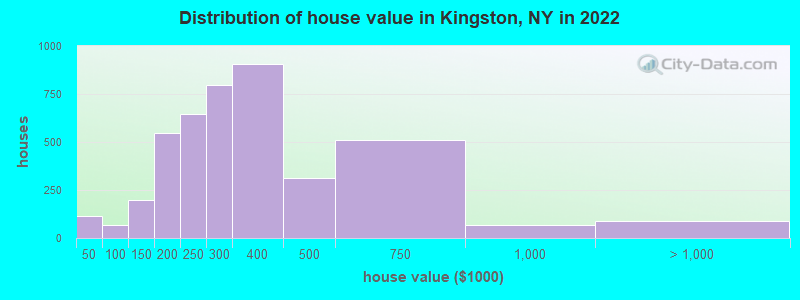
Home value of owner - occupied houses in 2022 in Kingston, NY
-
- 36Less than $10,000
- 8$10,000 to $14,999
- 44$15,000 to $19,999
- 23$25,000 to $29,999
- 20$50,000 to $59,999
- 28$60,000 to $69,999
- 8$80,000 to $89,999
- 11$90,000 to $99,999
- 83$100,000 to $124,999
- 115$125,000 to $149,999
- 196$150,000 to $174,999
- 350$175,000 to $199,999
- 646$200,000 to $249,999
- 798$250,000 to $299,999
- 908$300,000 to $399,999
- 311$400,000 to $499,999
- 512$500,000 to $749,999
- 65$750,000 to $999,999
- 70$1,000,000 to $1,499,999
- 6$1,500,000 to $1,999,999
- 9$2,000,000 or more
Rent paid by renters in 2022 in Kingston, NY
-
- 24$100 to $149
- 38$150 to $199
- 80$200 to $249
- 38$250 to $299
- 281$300 to $349
- 58$350 to $399
- 21$400 to $449
- 51$450 to $499
- 100$500 to $549
- 61$550 to $599
- 66$600 to $649
- 57$650 to $699
- 114$700 to $749
- 53$750 to $799
- 284$800 to $899
- 566$900 to $999
- 1,369$1,000 to $1,249
- 692$1,250 to $1,499
- 891$1,500 to $1,999
- 113$2,000 to $2,499
- 15$2,500 to $2,999
- 238No cash rent


Percentage of workers working in this county: 81.0%
Number of people working at home: 1,688 (14.5% of all workers)
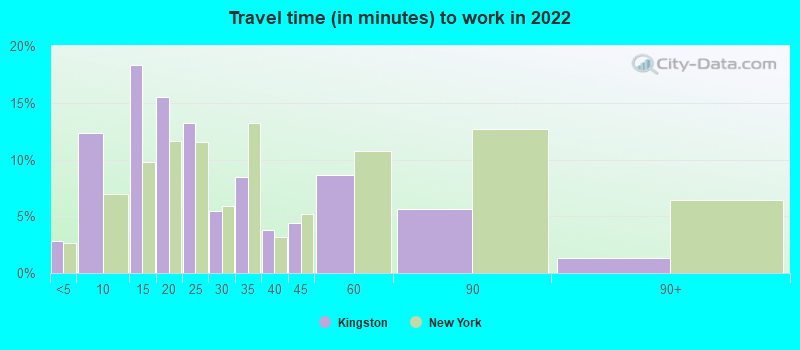
Travel time to work (commute)
- Less than 5 minutes: 475
- 5 to 9 minutes: 1,507
- 10 to 14 minutes: 1,867
- 15 to 19 minutes: 1,687
- 20 to 24 minutes: 910
- 25 to 29 minutes: 519
- 30 to 34 minutes: 1,046
- 35 to 39 minutes: 222
- 40 to 44 minutes: 571
- 45 to 59 minutes: 345
- 60 to 89 minutes: 261
- 90 or more minutes: 300
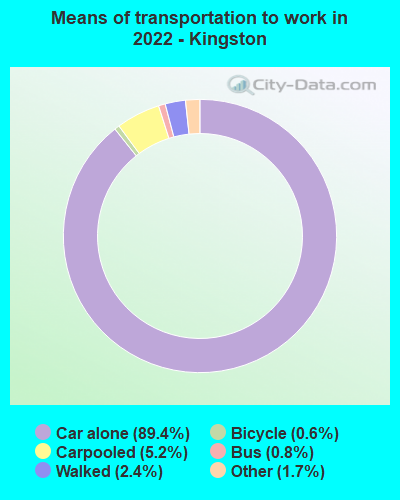
Means of transportation to work:
- Drove a car alone: 12,969 (79.8%)
- Carpooled: 800 (4.9%)
- Bus: 109 (0.7%)
- Long-distance train or commuter rail: 8 (0.0%)
- Taxi: 298 (1.8%)
- Bicycle: 93 (0.6%)
- Walked: 351 (2.2%)
- Worked at home: 1,670 (10.3%)

- Unemployment by race in 2022
- Unemployment rate for White non-Hispanic residents
- 6.1%Males
- 3.3%Females
- Unemployment rate for Black residents
- 6.5%Males
- 3.3%Females
- Unemployment rate for Asian residents
- 4.0%Females
- Unemployment rate for other race residents
- 7.2%Males
- Unemployment rate for two or more race residents
- 4.5%Females
- Unemployment rate for Hispanic or Latino residents
- 6.2%Males
- 5.4%Females

- Year of entry for the foreign-born population in Kingston, New York
- 6872010 or later
- 7822000 to 2009
- 5891990 to 1999
- 2781980 to 1989
- 1531970 to 1979
- 337Before 1970

First ancestries reported:
- Irish: 1,436 (13.5%)
- Italian: 1,329 (12.4%)
- American: 739 (6.9%)
- German: 577 (5.4%)
- Jamaican: 404 (3.8%)
- English: 393 (3.7%)
- Polish: 195 (1.8%)
- European: 181 (1.7%)
- Haitian: 151 (1.4%)
- African: 146 (1.4%)
- Eastern European: 66 (0.6%)
- French Canadian: 64 (0.6%)
- Romanian: 60 (0.6%)
- Northern European: 58 (0.5%)
- Scotch-Irish: 53 (0.5%)
- Dutch: 50 (0.5%)
- Australian: 49 (0.5%)
- Scandinavian: 46 (0.4%)
- Greek: 42 (0.4%)
- British: 33 (0.3%)
- Russian: 32 (0.3%)
- Hungarian: 23 (0.2%)
- Scottish: 15 (0.1%)
- Swedish: 14 (0.1%)
- British West Indian: 14 (0.1%)
- Czechoslovakian: 13 (0.1%)
- Norwegian: 13 (0.1%)
- Canadian: 9 (0.08%)
- Welsh: 8 (0.07%)
- Austrian: 7 (0.07%)
- French: 6 (0.06%)
- Lithuanian: 5 (0.05%)
- Ukrainian: 5 (0.05%)
Most common places of birth for foreign-born residents (%):
| Kingston: | 22.0% (566) |
| New York: | 4.8% (214,559) |
| Kingston: | 15.7% (404) |
| New York: | 5.0% (227,557) |
| Kingston: | 14.2% (365) |
| New York: | 2.4% (108,067) |
| Kingston: | 5.5% (140) |
| New York: | 1.4% (61,245) |
| Kingston: | 4.2% (107) |
| New York: | 2.8% (126,936) |
| Kingston: | 3.7% (96) |
| New York: | 0.1% (6,368) |
| Kingston: | 2.8% (72) |
| New York: | 9.1% (410,910) |
| Kingston: | 2.2% (56) |
| New York: | 0.8% (33,869) |
| Kingston: | 2.1% (54) |
| New York: | 1.2% (55,571) |
| Kingston: | 1.9% (50) |
| New York: | 2.5% (111,920) |
| Kingston: | 1.8% (47) |
| New York: | 1.4% (62,442) |
| Kingston: | 1.6% (40) |
| New York: | 3.8% (172,129) |
Place of birth for U.S.-born residents:
- This state: 16,762
- Other state: 3,942
- Northeast: 1,350
- Midwest: 393
- South: 1,639
- West: 595
85.5% of Kingston residents lived in the same house 1 years ago.
Out of people who lived in different houses, 41.2% lived in this county.
Out of people who lived in different counties, 68.7% lived in New York.
| Kingston: | 85.5% |
| State average: | 89.6% |
Education attainment for males 25 years and older:
- No schooling: 149
- Nursery to 4th grade: 0
- 5th and 6th grade: 23
- 7th and 8th grade: 93
- 9th grade: 152
- 10th grade: 296
- 11th grade: 112
- 12th grade, no diploma: 230
- High school graduate (or equivalency): 2,736
- Less than 1 year of college: 600
- Some college more than 1 year, no degree: 1,193
- Associate degree: 453
- Bachelor's degree: 1,274
- Master's degree: 634
- Professional school degree: 187
- Doctorate degree: 76

Education attainment for females 25 years and older:
- No schooling: 245
- Nursery to 4th grade: 172
- 5th and 6th grade: 39
- 7th and 8th grade: 60
- 9th grade: 128
- 10th grade: 135
- 11th grade: 119
- 12th grade, no diploma: 102
- High school graduate (or equivalency): 2,205
- Less than 1 year of college: 752
- Some college more than 1 year, no degree: 878
- Associate degree: 751
- Bachelor's degree: 1,858
- Master's degree: 1,122
- Professional school degree: 73
- Doctorate degree: 36


Housing units in structures:
- One, detached: 4,963
- One, attached: 333
- Two: 2,002
- 3 or 4: 1,266
- 5 to 9: 705
- 10 to 19: 833
- 20 to 49: 277
- 50 or more: 588
- Mobile homes: 10
Housing units lacking complete kitchen facilities in 2022: 1.5%
House/condo owner moved in on average 13 years ago
Renter moved in on average 2 years ago

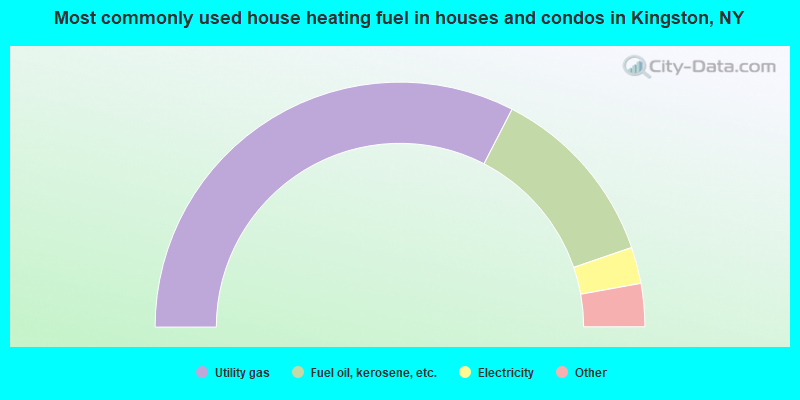
- 65.2%Utility gas
- 24.4%Fuel oil, kerosene, etc.
- 4.8%Electricity
- 3.4%Bottled, tank, or LP gas
- 2.1%Wood
- 0.2%Other fuel
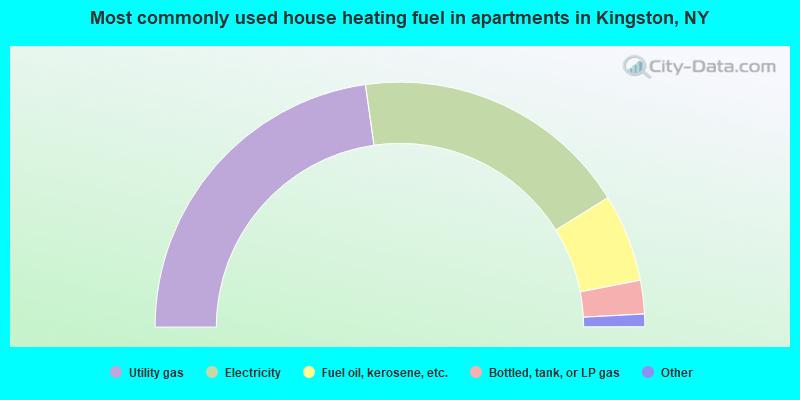
- 45.5%Utility gas
- 36.8%Electricity
- 11.6%Fuel oil, kerosene, etc.
- 4.4%Bottled, tank, or LP gas
- 1.3%Other fuel
- 0.2%No fuel used
- 0.2%Wood
Private vs. public school enrollment:
| Here: | 8.5% |
| New York: | 15.6% |
| Here: | 3.9% |
| New York: | 15.0% |
| Here: | 19.3% |
| New York: | 39.2% |


