Killingworth, CT (Connecticut) Houses and Residents
| Killingworth: | $498,316 |
| Connecticut: | $347,200 |
Total population: 6,525 (Urban population: 0, Rural population: 6,018 (37 farm, 5,981 nonfarm))
Houses: 2,283 (2,196 occupied: 2,099 owner occupied, 97 renter occupied)
| % of renters here: | 4% |
| State: | 34% |
Housing density: 65 houses/condos per square mile
Median price asked for vacant for-sale houses and condos in 2022 in this county: $431,754.
Median contract rent in 2022: over $2,000 (lower quartile is $1,534, upper quartile is over $2,000)
Median gross rent in Killingworth, CT in 2022: over $2,000
Housing units in Killingworth with a mortgage: 1,360 (159 second mortgage, 188 home equity loan, 8 both second mortgage and home equity loan)
Houses without a mortgage: 257
Compare current foreclosures near Killingworth, CT:
| Photo | Address | Area | Beds / Baths | Price | Details |
|---|---|---|---|---|---|

|
#1
Kelseytown Rd
Killingworth, CT 06419
|
1,505 sq. feet
|
2 baths 4 beds |
show details | |

|
#2
Willis Ave
Meriden, CT 06450
|
1,008 sq. feet
|
1 baths 2 beds |
$299,900
|
show details |

|
#3
Railroad Ave
Chester, CT 06412
|
2,092 sq. feet
|
2 baths 4 beds |
$484,900
|
show details |

|
#4
Route 80
Killingworth, CT 06419
|
- sq. feet
|
- baths - beds |
show details | |

|
#5
Evansville Ave
Meriden, CT 06451
|
624 sq. feet
|
1 baths 3 beds |
show details | |

|
#6
Center St
Wallingford, CT 06492
|
2,412 sq. feet
|
1 baths 2 beds |
show details | |

|
#7
Tennyson Ave
North Haven, CT 06473
|
1,278 sq. feet
|
1 baths 2 beds |
show details | |

|
#8
Shawmut Ave
North Haven, CT 06473
|
1,152 sq. feet
|
1 baths 3 beds |
show details | |

|
#9
Mount Parnassus Rd
East Haddam, CT 06423
|
2,328 sq. feet
|
3 baths 3 beds |
show details | |

|
#10
Orient St
Meriden, CT 06450
|
1,780 sq. feet
|
3 baths 3 beds |
show details |
| Photo | Address | Area | Beds / Baths | Price | Details |
|---|---|---|---|---|---|

|
#11
Dora Dr
New Haven, CT 06513
|
1,302 sq. feet
|
1 baths 3 beds |
show details | |

|
#12
Pratt St
Meriden, CT 06450
|
1,040 sq. feet
|
2 baths 3 beds |
show details | |

|
#13
Feather Ln
North Branford, CT 06471
|
4,408 sq. feet
|
2 baths 4 beds |
show details | |

|
#14
Spring St
Meriden, CT 06451
|
660 sq. feet
|
1 baths 3 beds |
show details | |

|
#15
Amity St
Meriden, CT 06450
|
1,568 sq. feet
|
2 baths 3 beds |
show details | |

|
#16
Borrmann Rd
East Haven, CT 06512
|
1,222 sq. feet
|
2 baths 4 beds |
show details | |

|
#17
Windsor Rd
Hamden, CT 06517
|
1,116 sq. feet
|
3 baths 4 beds |
show details | |

|
#18
Hidden Valley Dr
Meriden, CT 06451
|
2,264 sq. feet
|
2 baths 4 beds |
show details | |

|
#19
Fawn Dr
Meriden, CT 06451
|
1,766 sq. feet
|
2 baths 4 beds |
show details | |

|
#20
Liberty St
Meriden, CT 06450
|
924 sq. feet
|
2 baths 2 beds |
show details |
| Photo | Address | Area | Beds / Baths | Price | Details |
|---|---|---|---|---|---|

|
#21
Sylvan Hills Rd
New Haven, CT 06513
|
1,344 sq. feet
|
2 baths 3 beds |
show details | |

|
#22
Mathew Ln
North Haven, CT 06473
|
1,275 sq. feet
|
1 baths 3 beds |
show details | |

|
#23
Paddock Ave
Meriden, CT 06450
|
1,099 sq. feet
|
1 baths 2 beds |
show details | |

|
#24
Turner Dr
North Haven, CT 06473
|
1,398 sq. feet
|
2 baths 3 beds |
show details | |

|
#25
Westwood Cir
Meriden, CT 06450
|
948 sq. feet
|
1 baths 2 beds |
show details | |

|
#26
Oak St
Old Lyme, CT 06371
|
1,416 sq. feet
|
2 baths 3 beds |
show details | |

|
#27
Ramona Way
Branford, CT 06405
|
1,665 sq. feet
|
2 baths 3 beds |
show details | |

|
#28
Sundance Dr
Branford, CT 06405
|
1,259 sq. feet
|
1 baths 2 beds |
show details | |

|
#29
Brownstone Rdg
Meriden, CT 06451
|
2,373 sq. feet
|
2 baths 4 beds |
show details | |

|
#30
Thompson St Apt 11d
New Haven, CT 06513
|
1,210 sq. feet
|
1 baths 2 beds |
show details |
| Photo | Address | Area | Beds / Baths | Price | Details |
|---|---|---|---|---|---|

|
#31
Brentwood Dr
Wallingford, CT 06492
|
1,024 sq. feet
|
1 baths 2 beds |
show details | |

|
#32
Lydale Pl
Meriden, CT 06450
|
1,572 sq. feet
|
2 baths 3 beds |
show details | |

|
#33
Tumblebrook Rd
Meriden, CT 06450
|
1,972 sq. feet
|
3 baths 4 beds |
show details | |

|
#34
Koczak Ct
North Haven, CT 06473
|
1,320 sq. feet
|
1 baths 3 beds |
show details | |

|
#35
Hanover St
Wallingford, CT 06492
|
1,899 sq. feet
|
2 baths 4 beds |
show details | |

|
#36
N High St
East Haven, CT 06512
|
1,819 sq. feet
|
2 baths 3 beds |
show details | |

|
#37
Farm Gate Rd
Colchester, CT 06415
|
3,622 sq. feet
|
3 baths 3 beds |
show details | |

|
#38
Chamberlain Hwy
Meriden, CT 06451
|
1,094 sq. feet
|
1 baths 3 beds |
show details | |

|
#39
Willow Rd
New Haven, CT 06512
|
1,582 sq. feet
|
1 baths 5 beds |
show details | |

|
#40
East St
Middletown, CT 06457
|
1,598 sq. feet
|
1 baths 3 beds |
show details |
| Photo | Address | Area | Beds / Baths | Price | Details |
|---|---|---|---|---|---|

|
#41
Parker Ave
Meriden, CT 06450
|
1,830 sq. feet
|
1 baths 4 beds |
show details | |

|
#42
Shunpike Rd
Cromwell, CT 06416
|
1,442 sq. feet
|
1 baths 4 beds |
show details | |

|
#43
Crest Ave
New Haven, CT 06513
|
1,248 sq. feet
|
1 baths 2 beds |
show details | |

|
#44
South St
Cromwell, CT 06416
|
2,272 sq. feet
|
3 baths 3 beds |
show details | |

|
#45
Yale Ave
Meriden, CT 06450
|
1,692 sq. feet
|
1 baths 3 beds |
show details | |

|
#46
Sugar Hill Rd
North Haven, CT 06473
|
2,303 sq. feet
|
3 baths 4 beds |
show details | |

|
#47
Robin Dr
New Haven, CT 06513
|
1,756 sq. feet
|
1 baths 3 beds |
show details | |

|
#48
N Main St Unit 32
East Hampton, CT 06424
|
1,040 sq. feet
|
1 baths 2 beds |
show details | |

|
#49
Northfield Rd
Wallingford, CT 06492
|
1,232 sq. feet
|
2 baths 3 beds |
show details | |

|
Check over 1 million property listings on Foreclosure.com!
|
browse all offers | |||
Latest news about housing in Killingworth, CT collected exclusively by city-data.com from local newspapers, TV, and radio stations


Household type by relationship:
Households: 160,591- In family households: 131,621 (30,370 male householders, 13,373 female householders)
34,891 spouses, 44,052 children (41,443 natural, 1,059 adopted, 1,550 stepchildren), 1,876 grandchildren, 1,018 brothers or sisters, 1,359 parents, foster children, 1,032 other relatives, 2,795 non-relatives
- In nonfamily households: 28,970 (10,508 male householders (8,006 living alone)), 12,951 female householders (10,912 living alone)), 5,511 nonrelatives
- In group quarters: 5,085 (1,881 institutionalized population)
26,910 married couples with children.
6,210 single-parent households (1,312 men, 4,898 women).
96.9% of residents of Killingworth speak English at home.
0.7% of residents speak Spanish at home (71% speak English very well, 13% speak English well, 16% speak English not well).
2.2% of residents speak other Indo-European language at home (89% speak English very well, 11% speak English well).
0.1% of residents speak Asian or Pacific Island language at home (100% speak English very well).
Foreign born population: 339 (4.7%)
(54.6% of them are naturalized citizens)
| Here: | 8.4 |
| State: | 6.5 |
| Here: | 7.0 |
| State: | 4.0 |

- Bedrooms in owner-occupied houses and condos in Killingworth, Connecticut
- 0no bedroom
- 401 bedroom
- 3792 bedrooms
- 9233 bedrooms
- 6794 bedrooms
- 785+ bedrooms

- Bedrooms in renter-occupied apartments in Killingworth, Connecticut
- 0no bedroom
- 01 bedroom
- 302 bedrooms
- 433 bedrooms
- 244 bedrooms
- 05+ bedrooms

- Cars and other vehicles available in Killingworth in owner-occupied houses/condos
- 51no vehicle
- 3231 vehicle
- 1,0542 vehicles
- 5583 vehicles
- 654 vehicles
- 485+ vehicles

- Cars and other vehicles available in Killingworth in renter-occupied apartments
- 9no vehicle
- 371 vehicle
- 402 vehicles
- 113 vehicles
- 04 vehicles
- 05+ vehicles

- Rooms in owner-occupied houses in Killingworth, Connecticut
- 01 room
- 02 rooms
- 173 rooms
- 1674 rooms
- 2535 rooms
- 2776 rooms
- 4427 rooms
- 6008 rooms
- 3439+ rooms

- Rooms in renter-occupied apartments in Killingworth, Connecticut
- 01 room
- 02 rooms
- 103 rooms
- 94 rooms
- 275 rooms
- 06 rooms
- 517 rooms
- 08 rooms
- 09+ rooms


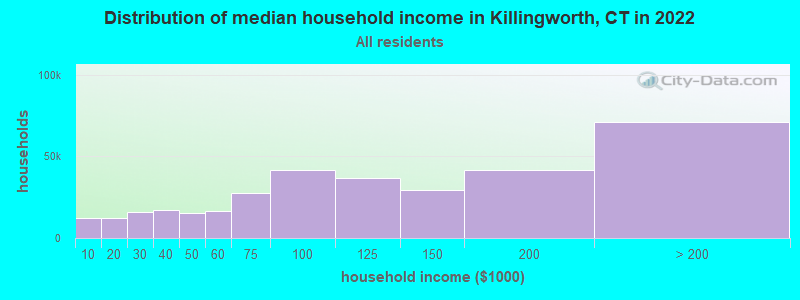
Killingworth, CT household income distribution

- 6,156Less than $10,000
- 5,011$10,000 to $19,999
- 7,814$20,000 to $29,999
- 10,052$30,000 to $39,999
- 8,149$40,000 to $49,999
- 9,860$50,000 to $59,999
- 19,054$60,000 to $74,999
- 27,536$75,000 to $99,999
- 26,241$100,000 to $124,999
- 21,152$125,000 to $149,999
- 30,443$150,000 to $199,999
- 55,946$200,000 or more
Percentage of workers working in this county: 48.8%
Number of people working at home: 675 (18.8% of all workers)
Travel time to work (commute)
- Less than 5 minutes: 33
- 5 to 9 minutes: 99
- 10 to 14 minutes: 168
- 15 to 19 minutes: 441
- 20 to 24 minutes: 423
- 25 to 29 minutes: 186
- 30 to 34 minutes: 419
- 35 to 39 minutes: 216
- 40 to 44 minutes: 225
- 45 to 59 minutes: 471
- 60 to 89 minutes: 166
- 90 or more minutes: 53
Means of transportation to work:
- Drove a car alone: 2,628 (85.6%)
- Carpooled: 242 (7.9%)
- Bus or trolley bus: 7 (0.2%)
- Railroad: 8 (0.3%)
- Bicycle: 8 (0.3%)
- Walked: 7 (0.2%)
- Worked at home: 170 (5.5%)


- Year of entry for the foreign-born population in Killingworth, Connecticut
- 281995 to March 2000
- 751990 to 1994
- 51985 to 1989
- 81980 to 1984
- 241975 to 1979
- 121970 to 1974
- 01965 to 1969
- 52Before 1965
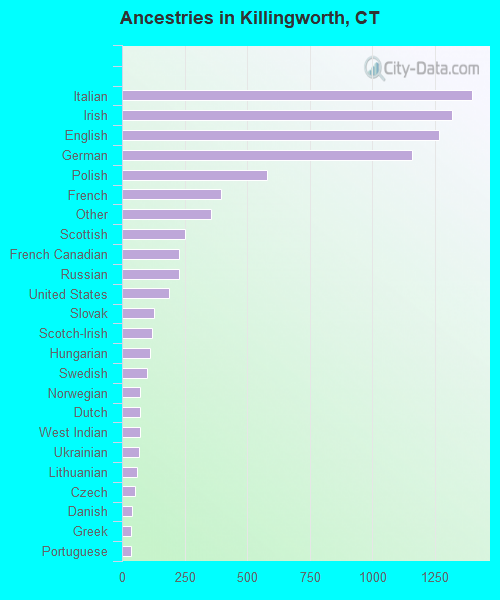
First ancestries reported:
- Italian: 1,398 (16.8%)
- Irish: 1,319 (15.8%)
- English: 1,268 (15.2%)
- German: 1,158 (13.9%)
- Polish: 581 (7.0%)
- French: 395 (4.7%)
- Other: 354 (4.2%)
- Scottish: 253 (3.0%)
- French Canadian: 228 (2.7%)
- Russian: 227 (2.7%)
- United States: 187 (2.2%)
- Slovak: 129 (1.5%)
- Scotch-Irish: 121 (1.5%)
- Hungarian: 110 (1.3%)
- Swedish: 99 (1.2%)
- Norwegian: 73 (0.9%)
- Dutch: 71 (0.9%)
- West Indian: 70 (0.8%)
- Ukrainian: 66 (0.8%)
- Lithuanian: 58 (0.7%)
- Czech: 52 (0.6%)
- Danish: 38 (0.5%)
- Greek: 34 (0.4%)
- Portuguese: 34 (0.4%)
- Swiss: 12 (0.1%)
- Welsh: 8 (0.10%)
Most common places of birth for foreign-born residents (%):
| Killingworth: | 29.9% (61) |
| Connecticut: | 5.2% (19,083) |
| Killingworth: | 18.6% (38) |
| Connecticut: | 3.1% (11,432) |
| Killingworth: | 8.8% (18) |
| Connecticut: | 1.2% (4,344) |
| Killingworth: | 7.4% (15) |
| Connecticut: | 0.5% (2,025) |
| Killingworth: | 6.9% (14) |
| Connecticut: | 2.5% (9,358) |
| Killingworth: | 4.9% (10) |
| Connecticut: | 7.2% (26,819) |
| Killingworth: | 3.9% (8) |
| Connecticut: | 0.7% (2,742) |
| Killingworth: | 3.4% (7) |
| Connecticut: | 0.4% (1,303) |
| Killingworth: | 2.9% (6) |
| Connecticut: | 0.6% (2,220) |
| Killingworth: | 2.9% (6) |
| Connecticut: | 2.3% (8,500) |
| Killingworth: | 2.9% (6) |
| Connecticut: | 2.1% (7,612) |
| Killingworth: | 2.5% (5) |
| Connecticut: | 0.4% (1,463) |
| Killingworth: | 2.5% (5) |
| Connecticut: | 1.5% (5,508) |
| Killingworth: | 2.5% (5) |
| Connecticut: | 0.3% (1,213) |
Place of birth for U.S.-born residents:
- This state: 4,069
- Other state: 1,709
- Northeast: 1,311
- Midwest: 115
- South: 211
- West: 72
70% of Killingworth residents lived in the same house 5 years ago.
Out of people who lived in different houses, 37% lived in this county.
Out of people who lived in different counties, 80% lived in Connecticut.
Education attainment for males 25 years and older:
- No schooling: 0
- Nursery to 4th grade: 0
- 5th and 6th grade: 11
- 7th and 8th grade: 28
- 9th grade: 17
- 10th grade: 51
- 11th grade: 46
- 12th grade, no diploma: 42
- High school graduate (or equivalency): 340
- Less than 1 year of college: 129
- Some college more than 1 year, no degree: 286
- Associate degree: 124
- Bachelor's degree: 502
- Master's degree: 395
- Professional school degree: 42
- Doctorate degree: 42

Education attainment for females 25 years and older:
- No schooling: 0
- Nursery to 4th grade: 0
- 5th and 6th grade: 0
- 7th and 8th grade: 18
- 9th grade: 14
- 10th grade: 25
- 11th grade: 20
- 12th grade, no diploma: 31
- High school graduate (or equivalency): 478
- Less than 1 year of college: 125
- Some college more than 1 year, no degree: 192
- Associate degree: 186
- Bachelor's degree: 590
- Master's degree: 380
- Professional school degree: 71
- Doctorate degree: 14


Housing units in structures:
- One, detached: 2,013
- One, attached: 14
- Two: 18
- Mobile homes: 238
Median worth of mobile homes: $64,679

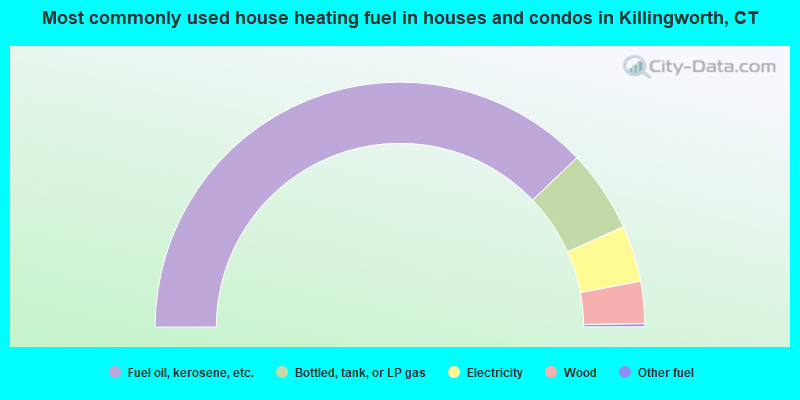
- 75.7%Fuel oil, kerosene, etc.
- 10.9%Bottled, tank, or LP gas
- 7.4%Electricity
- 5.6%Wood
- 0.4%Other fuel
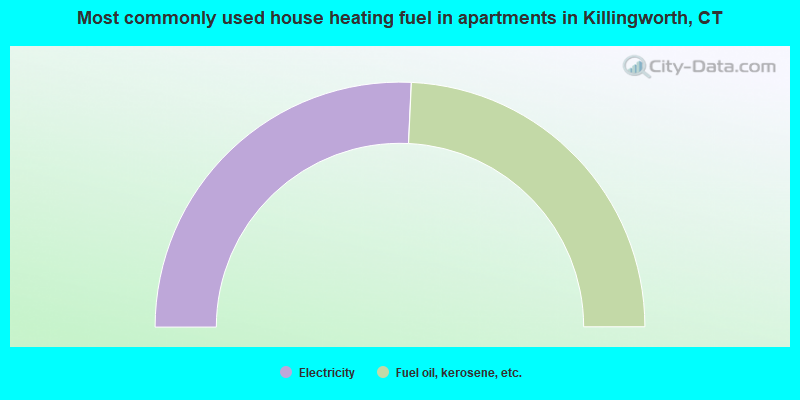
- 51.5%Electricity
- 48.5%Fuel oil, kerosene, etc.
Private vs. public school enrollment:
| Here: | 2.0% |
| Connecticut: | 9.9% |
| Here: | 16.4% |
| Connecticut: | 11.0% |
| Here: | 43.3% |
| Connecticut: | 33.4% |


