Keyser, WV (West Virginia) Houses and Residents
| Keyser: | $122,761 |
| West Virginia: | $155,100 |
Mean price in 2022:
Detached houses: $132,425
Here: $132,425 State: $206,655 Townhouses or other attached units: $21,872
Here: $21,872 State: $205,683 In 2-unit structures: $143,638
Here: $143,638 State: $127,101 Mobile homes: $20,683
Here: $20,683 State: $63,963
Total population: 5,264 (Urban population: 5,132 (all inside urban clusters), Rural population: 0)
Houses: 2,533 (1,959 occupied: 1,190 owner occupied, 818 renter occupied)
| % of renters here: | 41% |
| State: | 26% |
Housing density: 1,333 houses/condos per square mile
Median price asked for vacant for-sale houses and condos in 2022: $7,816.
Median contract rent in 2022: $451 (lower quartile is $312, upper quartile is $596)
Median rent asked for vacant for-rent units in 2022: $388
Median gross rent in Keyser, WV in 2022: $675
Housing units in Keyser with a mortgage: 517 (46 second mortgage, 0 home equity loan, 46 both second mortgage and home equity loan)
Houses without a mortgage: 0
Median household income for houses/condos with a mortgage: $85,403
Median household income for apartments without a mortgage: $63,212
Median monthly housing costs: $589
Compare current foreclosures near Keyser, WV:
| Photo | Address | Area | Beds / Baths | Price | Details |
|---|---|---|---|---|---|

|
#1
1 Box 122 A36
Keyser, WV 26726
|
1,568 sq. feet
|
2 baths 4 beds |
show details | |

|
#2
84 Box 65
Keyser, WV 26726
|
- sq. feet
|
1 baths 2 beds |
show details | |

|
#3
Cabin Run Rd
Keyser, WV 26726
|
- sq. feet
|
- baths - beds |
show details | |

|
#4
Old Hickory Rd
Keyser, WV 26726
|
- sq. feet
|
- baths - beds |
show details | |

|
#5
Horseshoe Rd
Keyser, WV 26726
|
- sq. feet
|
- baths - beds |
show details | |

|
#6
W Main St
Kitzmiller, MD 21538
|
- sq. feet
|
1 baths 3 beds |
$34,900
|
show details |

|
#7
W Main St
Lonaconing, MD 21539
|
2,488 sq. feet
|
2 baths 3 beds |
show details | |

|
#8
Welsh St
Frostburg, MD 21532
|
1,663 sq. feet
|
2 baths 4 beds |
show details | |

|
#9
Maple Tree Ln SW
Cumberland, MD 21502
|
1,737 sq. feet
|
2 baths 3 beds |
show details | |

|
#10
Pine Street
Elk Garden, WV 26717
|
1,310 sq. feet
|
1 baths 3 beds |
show details |
| Photo | Address | Area | Beds / Baths | Price | Details |
|---|---|---|---|---|---|

|
#11
Yuma St
Cumberland, MD 21502
|
1,348 sq. feet
|
2 baths 3 beds |
show details | |

|
#12
Federal St
Frostburg, MD 21532
|
1,056 sq. feet
|
1 baths - beds |
show details | |

|
#13
Shaw St
Frostburg, MD 21532
|
1,644 sq. feet
|
2 baths - beds |
show details | |

|
#14
Detmold St
Lonaconing, MD 21539
|
2,689 sq. feet
|
2 baths - beds |
show details | |

|
#15
W Main St
Frostburg, MD 21532
|
2,088 sq. feet
|
2 baths - beds |
show details | |

|
#16
Washington St
Frostburg, MD 21532
|
1,218 sq. feet
|
2 baths - beds |
show details | |

|
#17
Porter Rd SW
Frostburg, MD 21532
|
1,664 sq. feet
|
3 baths - beds |
show details | |

|
#18
Mcmullen Hwy SW
Cumberland, MD 21502
|
1,428 sq. feet
|
1 baths - beds |
show details | |

|
#19
E Main St
Frostburg, MD 21532
|
1,315 sq. feet
|
1 baths - beds |
show details | |

|
#20
Ormand St
Frostburg, MD 21532
|
2,100 sq. feet
|
1 baths - beds |
show details |
| Photo | Address | Area | Beds / Baths | Price | Details |
|---|---|---|---|---|---|

|
#21
Fritz Dr SW
Cumberland, MD 21502
|
2,360 sq. feet
|
1 baths - beds |
show details | |

|
#22
Welsh Hill Rd
Frostburg, MD 21532
|
960 sq. feet
|
1 baths - beds |
show details | |

|
#23
Hoffman Hollow Rd SW
Frostburg, MD 21532
|
1,548 sq. feet
|
1 baths - beds |
show details | |

|
#24
Angel St SW
Frostburg, MD 21532
|
1,068 sq. feet
|
1 baths - beds |
show details | |

|
#25
Fairview Rd
Grantsville, MD 21536
|
4,015 sq. feet
|
3 baths - beds |
show details | |

|
#26
Horse Rock Rd SW
Westernport, MD 21562
|
1,152 sq. feet
|
1 baths - beds |
show details | |

|
#27
Martz Ln
Cumberland, MD 21502
|
1,014 sq. feet
|
1 baths - beds |
show details | |

|
#28
Maryland Ave
Westernport, MD 21562
|
1,708 sq. feet
|
1 baths - beds |
show details | |

|
#29
Hummingbird Hl SW
Lonaconing, MD 21539
|
1,944 sq. feet
|
2 baths - beds |
show details | |

|
#30
Brant Rd SW
Cumberland, MD 21502
|
1,084 sq. feet
|
1 baths - beds |
show details |
| Photo | Address | Area | Beds / Baths | Price | Details |
|---|---|---|---|---|---|

|
#31
Carlos Rd SW
Frostburg, MD 21532
|
1,037 sq. feet
|
1 baths - beds |
show details | |

|
#32
Bourbon St SW
Cumberland, MD 21502
|
2,110 sq. feet
|
2 baths - beds |
show details | |

|
#33
Walnut St
Westernport, MD 21562
|
1,186 sq. feet
|
1 baths - beds |
show details | |

|
#34
S Water St
Frostburg, MD 21532
|
1,092 sq. feet
|
1 baths - beds |
show details | |

|
#35
Cemetery Rd
Frostburg, MD 21532
|
1,536 sq. feet
|
2 baths - beds |
show details | |

|
#36
Warnick Rd SW
Frostburg, MD 21532
|
1,888 sq. feet
|
2 baths - beds |
show details | |

|
#37
Laurel Run Rd SW
Barton, MD 21521
|
1,424 sq. feet
|
1 baths - beds |
show details | |

|
#38
Shaw St
Frostburg, MD 21532
|
1,644 sq. feet
|
2 baths - beds |
show details | |

|
#39
Watercliff St
Lonaconing, MD 21539
|
2,048 sq. feet
|
1 baths - beds |
show details | |

|
#40
W Florida Way
Lonaconing, MD 21539
|
1,664 sq. feet
|
1 baths - beds |
show details |
| Photo | Address | Area | Beds / Baths | Price | Details |
|---|---|---|---|---|---|

|
#41
N Cresap St
Cumberland, MD 21502
|
1,730 sq. feet
|
1 baths - beds |
show details | |

|
#42
Redwood St
Cumberland, MD 21502
|
- sq. feet
|
- baths - beds |
show details | |

|
#43
E Main St Apt 2
Frostburg, MD 21532
|
- sq. feet
|
- baths - beds |
show details | |

|
#44
Death Valley Rd
Ridgeley, WV 26753
|
- sq. feet
|
- baths - beds |
show details | |

|
#45
Braddock St Unit 802
Frostburg, MD 21532
|
- sq. feet
|
- baths - beds |
show details | |

|
#46
Avilton Lonaconing Rd
Lonaconing, MD 21539
|
- sq. feet
|
- baths - beds |
show details | |

|
#47
Fir Tree Ln
Cumberland, MD 21502
|
- sq. feet
|
- baths - beds |
show details | |

|
#48
Valley View Dr
Romney, WV 26757
|
- sq. feet
|
- baths - beds |
show details | |

|
#49
Trails Edge Ln
Ridgeley, WV 26753
|
- sq. feet
|
- baths - beds |
show details | |

|
Check over 1 million property listings on Foreclosure.com!
|
browse all offers | |||

Latest news about housing in Keyser, WV collected exclusively by city-data.com from local newspapers, TV, and radio stations

 | Morgantown Business News (1161 replies) |
| WVU News, Facilities, and Information (645 replies) |
| Mon County Area Roads and Infrastructure (908 replies) |
| Apartments in Keyser, WV (1 reply) |
| Need a 3-BR rental house in Moorefield WV (9 replies) |
| Rocket Center, WV relocation (17 replies) |

Median year apartment built: 1958
Household type by relationship:
Households: 4,830- Male householders: 547 (173 living alone), Female householders: 1,387 (668 living alone)
705 spouses (705 opposite-sex spouses), 169 unmarried partners, (169 opposite-sex unmarried partners), 1,096 children (1,096 natural, 0 adopted, 0 stepchildren), 260 grandchildren, 0 brothers or sisters, 0 parents, 0 foster children, 111 other relatives, 123 non-relatives
- In group quarters: 427
Size of family households: 471 2-persons, 441 3-persons, 36 4-persons, 56 5-persons, 27 6-persons.
Size of nonfamily households: 870 1-person, 86 2-persons, 20 3-persons, 10 4-persons.
225 married couples with children.
325 single-parent households (35 men, 290 women).
100.0% of residents of Keyser speak English at home.
| Here: | 6.2 |
| State: | 6.5 |
| Here: | 4.3 |
| State: | 4.7 |

- Bedrooms in owner-occupied houses and condos in Keyser, West Virginia
- 0no bedroom
- 01 bedroom
- 2342 bedrooms
- 8623 bedrooms
- 954 bedrooms
- 05+ bedrooms

- Bedrooms in renter-occupied apartments in Keyser, West Virginia
- 0no bedroom
- 2651 bedroom
- 3382 bedrooms
- 1843 bedrooms
- 304 bedrooms
- 15+ bedrooms

- Cars and other vehicles available in Keyser in owner-occupied houses/condos
- 44no vehicle
- 4561 vehicle
- 2662 vehicles
- 4043 vehicles
- 214 vehicles
- 05+ vehicles

- Cars and other vehicles available in Keyser in renter-occupied apartments
- 283no vehicle
- 3501 vehicle
- 1862 vehicles
- 03 vehicles
- 04 vehicles
- 05+ vehicles

- Rooms in owner-occupied houses in Keyser, West Virginia
- 01 room
- 02 rooms
- 03 rooms
- 874 rooms
- 4225 rooms
- 1416 rooms
- 2087 rooms
- 988 rooms
- 2359+ rooms

- Rooms in renter-occupied apartments in Keyser, West Virginia
- 01 room
- 1092 rooms
- 1433 rooms
- 2104 rooms
- 1875 rooms
- 1036 rooms
- 387 rooms
- 08 rooms
- 299+ rooms


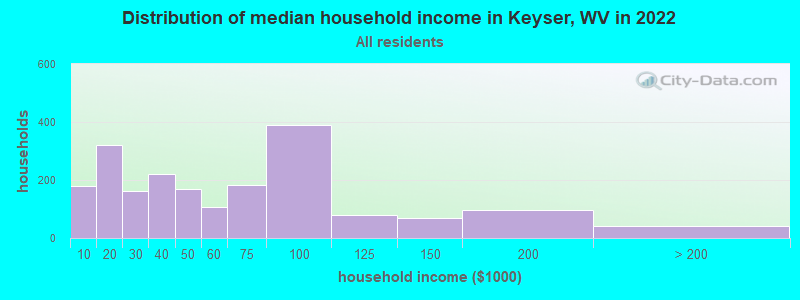
Keyser, WV household income distribution

- 181Less than $10,000
- 320$10,000 to $19,999
- 163$20,000 to $29,999
- 219$30,000 to $39,999
- 170$40,000 to $49,999
- 108$50,000 to $59,999
- 183$60,000 to $74,999
- 390$75,000 to $99,999
- 80$100,000 to $124,999
- 69$125,000 to $149,999
- 98$150,000 to $199,999
- 40$200,000 or more
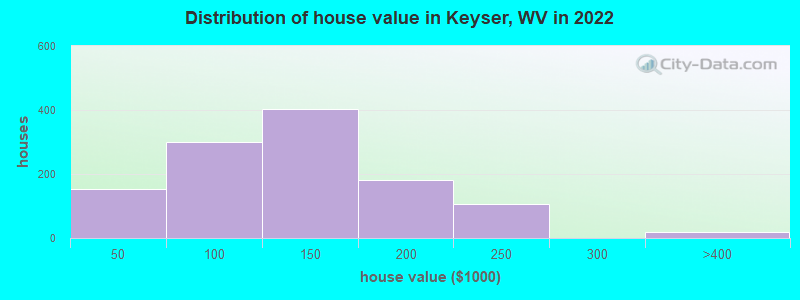
Home value of owner - occupied houses in 2022 in Keyser, WV
-
- 19$10,000 to $14,999
- 37$15,000 to $19,999
- 18$20,000 to $24,999
- 56$25,000 to $29,999
- 20$35,000 to $39,999
- 14$50,000 to $59,999
- 65$60,000 to $69,999
- 101$70,000 to $79,999
- 65$80,000 to $89,999
- 52$90,000 to $99,999
- 219$100,000 to $124,999
- 182$125,000 to $149,999
- 155$150,000 to $174,999
- 24$175,000 to $199,999
- 104$200,000 to $249,999
- 18$300,000 to $399,999
Rent paid by renters in 2022 in Keyser, WV
-
- 54$100 to $149
- 99$200 to $249
- 41$250 to $299
- 39$300 to $349
- 24$350 to $399
- 179$400 to $449
- 11$450 to $499
- 191$500 to $549
- 27$550 to $599
- 54$600 to $649
- 45$650 to $699
- 50$700 to $749
- 51$800 to $899
- 28No cash rent


Percentage of workers working in this county: 74.6%
Number of people working at home: 294 (14.5% of all workers)
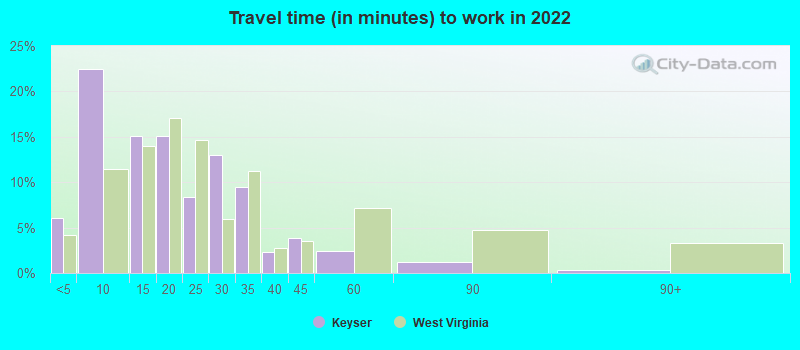
Travel time to work (commute)
- Less than 5 minutes: 209
- 5 to 9 minutes: 456
- 10 to 14 minutes: 352
- 15 to 19 minutes: 95
- 20 to 24 minutes: 52
- 25 to 29 minutes: 112
- 30 to 34 minutes: 176
- 35 to 39 minutes: 0
- 40 to 44 minutes: 219
- 45 to 59 minutes: 60
- 60 to 89 minutes: 0
- 90 or more minutes: 42
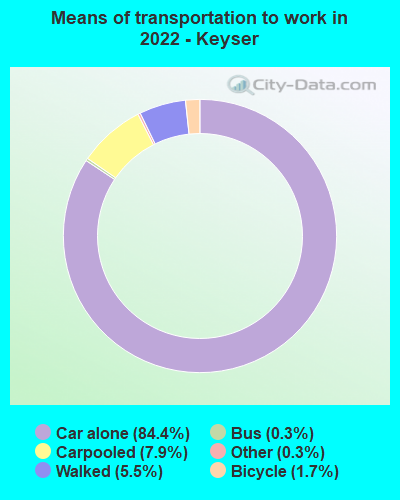
Means of transportation to work:
- Drove a car alone: 2,260 (76.3%)
- Carpooled: 211 (7.1%)
- Bus: 6 (0.2%)
- Taxi: 8 (0.3%)
- Bicycle: 18 (0.6%)
- Walked: 136 (4.6%)
- Worked at home: 294 (9.9%)

- Unemployment by race in 2022
- Unemployment rate for White non-Hispanic residents
- 4.1%Males
- 5.7%Females
- Unemployment rate for Black residents
- 14.3%Males

- Year of entry for the foreign-born population in Keyser, West Virginia
- 01995 to March 2000
- 121990 to 1994
- 01985 to 1989
- 81980 to 1984
- 01975 to 1979
- 01970 to 1974
- 01965 to 1969
- 16Before 1965
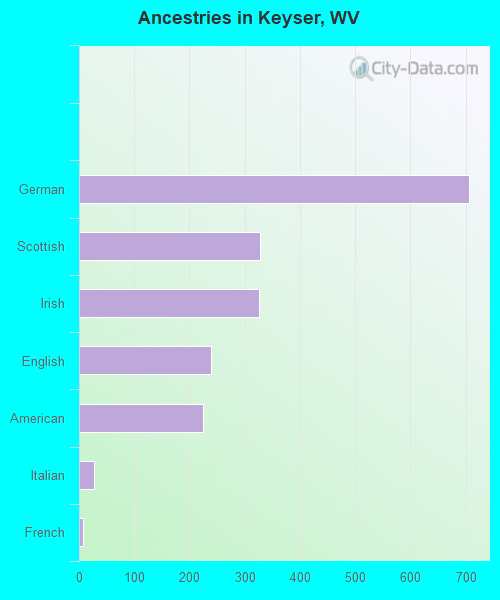
First ancestries reported:
- German: 707 (33.5%)
- Scottish: 328 (15.5%)
- Irish: 326 (15.4%)
- English: 239 (11.3%)
- American: 224 (10.6%)
- Italian: 27 (1.3%)
- French: 7 (0.3%)
Most common places of birth for foreign-born residents (%):
| Keyser: | 33.3% (12) |
| West Virginia: | 5.2% (1,011) |
| Keyser: | 27.8% (10) |
| West Virginia: | 1.2% (226) |
| Keyser: | 22.2% (8) |
| West Virginia: | 4.9% (956) |
| Keyser: | 16.7% (6) |
| West Virginia: | 4.4% (846) |
Place of birth for U.S.-born residents:
- This state: 1,816
- Other state: 3,071
- Northeast: 202
- Midwest: 195
- South: 2,595
- West: 117
82.8% of Keyser residents lived in the same house 1 years ago.
Out of people who lived in different houses, 32.5% lived in this county.
Out of people who lived in different counties, 38.5% lived in West Virginia.
| Keyser: | 82.8% |
| State average: | 89.6% |
Education attainment for males 25 years and older:
- No schooling: 0
- Nursery to 4th grade: 0
- 5th and 6th grade: 0
- 7th and 8th grade: 19
- 9th grade: 16
- 10th grade: 13
- 11th grade: 8
- 12th grade, no diploma: 0
- High school graduate (or equivalency): 587
- Less than 1 year of college: 116
- Some college more than 1 year, no degree: 131
- Associate degree: 448
- Bachelor's degree: 316
- Master's degree: 110
- Professional school degree: 0
- Doctorate degree: 12

Education attainment for females 25 years and older:
- No schooling: 0
- Nursery to 4th grade: 22
- 5th and 6th grade: 0
- 7th and 8th grade: 0
- 9th grade: 96
- 10th grade: 89
- 11th grade: 27
- 12th grade, no diploma: 49
- High school graduate (or equivalency): 532
- Less than 1 year of college: 175
- Some college more than 1 year, no degree: 119
- Associate degree: 238
- Bachelor's degree: 240
- Master's degree: 286
- Professional school degree: 13
- Doctorate degree: 0


Housing units in structures:
- One, detached: 1,520
- One, attached: 136
- Two: 175
- 3 or 4: 321
- 5 to 9: 122
- 10 to 19: 30
- 20 to 49: 52
- 50 or more: 22
- Mobile homes: 152
Housing units lacking complete kitchen facilities in 2022: 0.6%
House/condo owner moved in on average 19 years ago
Renter moved in on average 6 years ago

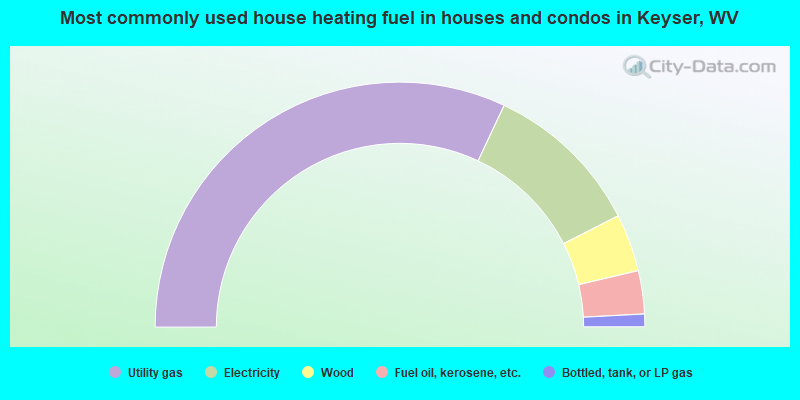
- 64.0%Utility gas
- 21.0%Electricity
- 7.6%Wood
- 5.7%Fuel oil, kerosene, etc.
- 1.7%Bottled, tank, or LP gas
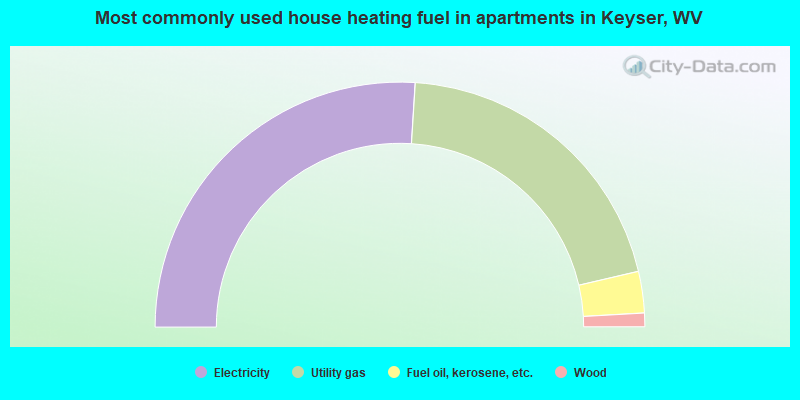
- 52.0%Electricity
- 40.7%Utility gas
- 5.5%Fuel oil, kerosene, etc.
- 1.8%Wood
Private vs. public school enrollment:
| Here: | 14.1% |
| West Virginia: | 12.2% |
| Here: | 0.0% |
| West Virginia: | 8.8% |
| Here: | 15.7% |
| West Virginia: | 17.3% |


