Kettering, OH (Ohio) Houses and Residents
| Kettering: | $200,507 |
| Ohio: | $204,100 |
Mean price in 2022:
Detached houses: $216,453
Here: $216,453 State: $254,366 Townhouses or other attached units: $413,533
Here: $413,533 State: $225,733 In 2-unit structures: $203,818
Here: $203,818 State: $144,384 In 3-to-4-unit structures: $80,428
Here: $80,428 State: $203,002 In 5-or-more-unit structures: $92,785
Here: $92,785 State: $211,593 Mobile homes: $52,334
Here: $52,334 State: $62,719
Total population: 55,705 (All urban)
Houses: 27,843 (26,430 occupied: 17,460 owner occupied, 9,759 renter occupied)
| % of renters here: | 36% |
| State: | 33% |
Housing density: 1,490 houses/condos per square mile
Median price asked for vacant for-sale houses and condos in 2022: $123,840.
Median contract rent in 2022: $805 (lower quartile is $583, upper quartile is $1,023)
Median rent asked for vacant for-rent units in 2022: $1,334
Median gross rent in Kettering, OH in 2022: $957
Housing units in Kettering with a mortgage: 11,347 (1,087 second mortgage, 0 home equity loan, 952 both second mortgage and home equity loan)
Houses without a mortgage: 500
Median household income for houses/condos with a mortgage: $92,208
Median household income for apartments without a mortgage: $64,699
Median monthly housing costs: $1,045
Compare current foreclosures near Kettering, OH:
| Photo | Address | Area | Beds / Baths | Price | Details |
|---|---|---|---|---|---|

|
#1
Sparks St
Dayton, OH 45426
|
1,100 sq. feet
|
1 baths 3 beds |
$159,900
|
show details |

|
#2
Alexandersville Bell
Dayton, OH 45449
|
1,669 sq. feet
|
2 baths 3 beds |
$148,500
|
show details |

|
#3
Cherry Dr
Dayton, OH 45405
|
1,260 sq. feet
|
1 baths 3 beds |
$57,200
|
show details |

|
#4
W Main St
Dayton, OH 45449
|
1,037 sq. feet
|
1 baths 2 beds |
show details | |

|
#5
S Lutheran Church Rd
New Lebanon, OH 45345
|
1,640 sq. feet
|
1 baths 2 beds |
show details | |

|
#6
E Dixon Ave
Dayton, OH 45419
|
1,532 sq. feet
|
2 baths 3 beds |
show details | |

|
#7
Shaunee Creek Dr
Dayton, OH 45415
|
1,568 sq. feet
|
3 baths 2 beds |
show details | |

|
#8
S Patterson Blvd
Dayton, OH 45409
|
1,408 sq. feet
|
2 baths 3 beds |
show details | |

|
#9
Northwood Ave
Dayton, OH 45405
|
1,048 sq. feet
|
2 baths 3 beds |
show details | |

|
#10
Timber Wolf Dr
Franklin, OH 45005
|
2,551 sq. feet
|
3 baths 3 beds |
show details |
| Photo | Address | Area | Beds / Baths | Price | Details |
|---|---|---|---|---|---|

|
#11
Frahn Ave
Fairborn, OH 45324
|
1,578 sq. feet
|
2 baths 3 beds |
show details | |

|
#12
Ketcham St
Dayton, OH 45431
|
1,107 sq. feet
|
2 baths 3 beds |
show details | |

|
#13
Merrywood Dr
Englewood, OH 45322
|
1,827 sq. feet
|
2 baths 4 beds |
show details | |

|
#14
E Lindsey Ave
Miamisburg, OH 45342
|
1,161 sq. feet
|
1 baths 3 beds |
show details | |

|
#15
W 2nd St
Dayton, OH 45402
|
1,784 sq. feet
|
1 baths 3 beds |
show details | |

|
#16
N Elm St
Farmersville, OH 45325
|
970 sq. feet
|
1 baths 2 beds |
show details | |

|
#17
W Floyd Ave
Dayton, OH 45415
|
2,487 sq. feet
|
2 baths 4 beds |
show details | |

|
#18
Willowwood Dr
Dayton, OH 45405
|
1,992 sq. feet
|
2 baths 4 beds |
show details | |

|
#19
Mound St
Dayton, OH 45402
|
1,726 sq. feet
|
2 baths 4 beds |
show details | |

|
#20
Collins Ct
Dayton, OH 45439
|
1,425 sq. feet
|
2 baths 2 beds |
show details |
| Photo | Address | Area | Beds / Baths | Price | Details |
|---|---|---|---|---|---|

|
#21
Wilbraham Rd
Middletown, OH 45042
|
1,361 sq. feet
|
1 baths 3 beds |
show details | |

|
#22
Newgate Ave
Dayton, OH 45420
|
1,050 sq. feet
|
1 baths 3 beds |
show details | |

|
#23
Glenwood Way
Dayton, OH 45440
|
3,625 sq. feet
|
3 baths 4 beds |
show details | |

|
#24
W Main St
Dayton, OH 45449
|
940 sq. feet
|
1 baths 2 beds |
show details | |

|
#25
Forest Ridge Blvd
Dayton, OH 45424
|
1,898 sq. feet
|
2 baths 4 beds |
show details | |

|
#26
Deville Dr
Dayton, OH 45415
|
1,994 sq. feet
|
2 baths 4 beds |
show details | |

|
#27
Sugartree Dr
Dayton, OH 45414
|
988 sq. feet
|
1 baths 2 beds |
show details | |

|
#28
Pioneer St
Dayton, OH 45405
|
1,218 sq. feet
|
1 baths 3 beds |
show details | |

|
#29
Santa Cruz Ave
Dayton, OH 45410
|
1,248 sq. feet
|
1 baths 2 beds |
show details | |

|
#30
Malvern Ave
Dayton, OH 45406
|
1,676 sq. feet
|
1 baths 5 beds |
show details |
| Photo | Address | Area | Beds / Baths | Price | Details |
|---|---|---|---|---|---|

|
#31
Parrot St
Dayton, OH 45410
|
- sq. feet
|
- baths - beds |
$9,750
|
show details |

|
#32
Carrilon Woods Dr
Dayton, OH 45458
|
3,668 sq. feet
|
3 baths 4 beds |
show details | |

|
#33
Utica Dr
Dayton, OH 45439
|
1,040 sq. feet
|
1 baths 3 beds |
show details | |

|
#34
Lakeview Ave
Dayton, OH 45417
|
1,290 sq. feet
|
2 baths 3 beds |
show details | |

|
#35
W Grand Ave
Dayton, OH 45402
|
1,629 sq. feet
|
1 baths 3 beds |
show details | |

|
#36
Spinning Rd
Dayton, OH 45431
|
2,024 sq. feet
|
1 baths 4 beds |
show details | |

|
#37
Glenbrook Dr
Dayton, OH 45406
|
1,333 sq. feet
|
2 baths 3 beds |
show details | |

|
#38
S Monmouth St
Dayton, OH 45403
|
1,132 sq. feet
|
1 baths 2 beds |
show details | |

|
#39
Edison St
Dayton, OH 45417
|
1,217 sq. feet
|
1 baths 2 beds |
show details | |

|
#40
Sandpiper Ln
Dayton, OH 45424
|
2,088 sq. feet
|
2 baths 4 beds |
show details |
| Photo | Address | Area | Beds / Baths | Price | Details |
|---|---|---|---|---|---|

|
#41
Norville Ct
Dayton, OH 45417
|
1,100 sq. feet
|
1 baths 2 beds |
show details | |

|
#42
N Snyder Rd
Dayton, OH 45426
|
1,142 sq. feet
|
1 baths 4 beds |
show details | |

|
#43
Milo Rd
Dayton, OH 45414
|
988 sq. feet
|
1 baths 4 beds |
show details | |

|
#44
E Bruce Ave
Dayton, OH 45405
|
1,470 sq. feet
|
2 baths 3 beds |
show details | |

|
#45
Jenny Marie Dr
Xenia, OH 45385
|
1,710 sq. feet
|
2 baths 3 beds |
show details | |

|
#46
Burleigh Ave
Dayton, OH 45417
|
834 sq. feet
|
1 baths 2 beds |
show details | |

|
#47
Evansville Ave
Dayton, OH 45406
|
1,856 sq. feet
|
2 baths 3 beds |
show details | |

|
#48
Ridgebury Dr
Dayton, OH 45440
|
1,120 sq. feet
|
1 baths 3 beds |
show details | |

|
#49
Hillway Dr
Dayton, OH 45405
|
1,344 sq. feet
|
1 baths 3 beds |
show details | |

|
Check over 1 million property listings on Foreclosure.com!
|
browse all offers | |||

Latest news about housing in Kettering, OH collected exclusively by city-data.com from local newspapers, TV, and radio stations


Median year apartment built: 1968
Household type by relationship:
Households: 57,467- Male householders: 12,841 (4,107 living alone), Female householders: 13,404 (5,268 living alone)
11,429 spouses (11,330 opposite-sex spouses), 1,695 unmarried partners, (1,559 opposite-sex unmarried partners), 14,421 children (13,131 natural, 269 adopted, 1,020 stepchildren), 670 grandchildren, 317 brothers or sisters, 419 parents, 41 foster children, 534 other relatives, 1,222 non-relatives
- In group quarters: 468
Size of family households: 8,203 2-persons, 3,380 3-persons, 2,304 4-persons, 1,087 5-persons, 397 6-persons, 126 7-or-more-persons.
Size of nonfamily households: 9,824 1-person, 1,744 2-persons, 115 3-persons, 18 4-persons.
8,802 married couples with children.
2,610 single-parent households (404 men, 2,206 women).
93.4% of residents of Kettering speak English at home.
1.5% of residents speak Spanish at home (74% speak English very well, 17% speak English well, 7% speak English not well, 2% don't speak English at all).
1.7% of residents speak other Indo-European language at home (67% speak English very well, 28% speak English well, 6% speak English not well).
1.1% of residents speak Asian or Pacific Island language at home (75% speak English very well, 14% speak English well, 11% speak English not well).
2.3% of residents speak other language at home (48% speak English very well, 35% speak English well, 4% speak English not well, 13% don't speak English at all).
Foreign born population: 3,138 (5.5%)
(45.6% of them are naturalized citizens)
| Here: | 6.7 |
| State: | 6.7 |
| Here: | 4.5 |
| State: | 4.4 |

- Bedrooms in owner-occupied houses and condos in Kettering, Ohio
- 0no bedroom
- 1961 bedroom
- 2,4502 bedrooms
- 10,5053 bedrooms
- 3,6984 bedrooms
- 6115+ bedrooms

- Bedrooms in renter-occupied apartments in Kettering, Ohio
- 419no bedroom
- 2,3691 bedroom
- 4,3862 bedrooms
- 2,3543 bedrooms
- 1554 bedrooms
- 755+ bedrooms

- Cars and other vehicles available in Kettering in owner-occupied houses/condos
- 343no vehicle
- 5,2761 vehicle
- 7,9062 vehicles
- 2,9643 vehicles
- 7884 vehicles
- 1845+ vehicles

- Cars and other vehicles available in Kettering in renter-occupied apartments
- 1,263no vehicle
- 5,1331 vehicle
- 2,8182 vehicles
- 4763 vehicles
- 524 vehicles
- 185+ vehicles

- Rooms in owner-occupied houses in Kettering, Ohio
- 01 room
- 02 rooms
- 1933 rooms
- 9234 rooms
- 3,3855 rooms
- 3,8726 rooms
- 3,3767 rooms
- 2,4788 rooms
- 3,2349+ rooms

- Rooms in renter-occupied apartments in Kettering, Ohio
- 3761 room
- 3942 rooms
- 1,6283 rooms
- 2,8654 rooms
- 2,2215 rooms
- 1,3676 rooms
- 4117 rooms
- 1798 rooms
- 3199+ rooms


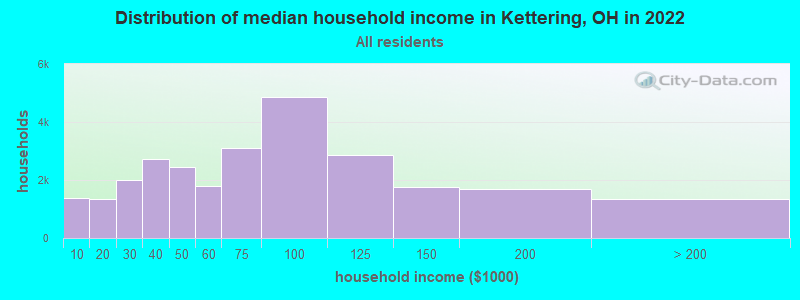
Kettering, OH household income distribution

- 1,382Less than $10,000
- 1,355$10,000 to $19,999
- 1,995$20,000 to $29,999
- 2,729$30,000 to $39,999
- 2,437$40,000 to $49,999
- 1,789$50,000 to $59,999
- 3,113$60,000 to $74,999
- 4,879$75,000 to $99,999
- 2,859$100,000 to $124,999
- 1,775$125,000 to $149,999
- 1,702$150,000 to $199,999
- 1,350$200,000 or more
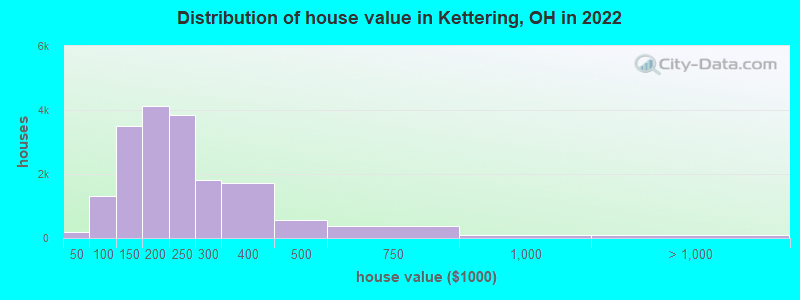
Home value of owner - occupied houses in 2022 in Kettering, OH
-
- 44Less than $10,000
- 8$10,000 to $14,999
- 8$15,000 to $19,999
- 29$20,000 to $24,999
- 7$25,000 to $29,999
- 37$30,000 to $34,999
- 33$35,000 to $39,999
- 23$40,000 to $49,999
- 97$50,000 to $59,999
- 105$60,000 to $69,999
- 303$70,000 to $79,999
- 285$80,000 to $89,999
- 500$90,000 to $99,999
- 1,836$100,000 to $124,999
- 1,659$125,000 to $149,999
- 2,309$150,000 to $174,999
- 1,807$175,000 to $199,999
- 3,848$200,000 to $249,999
- 1,822$250,000 to $299,999
- 1,720$300,000 to $399,999
- 578$400,000 to $499,999
- 370$500,000 to $749,999
- 82$750,000 to $999,999
- 45$1,000,000 to $1,499,999
- 7$1,500,000 to $1,999,999
- 49$2,000,000 or more
Rent paid by renters in 2022 in Kettering, OH
-
- 118Less than $100
- 36$100 to $149
- 54$150 to $199
- 59$200 to $249
- 68$250 to $299
- 134$300 to $349
- 324$350 to $399
- 160$400 to $449
- 208$450 to $499
- 480$500 to $549
- 428$550 to $599
- 419$600 to $649
- 562$650 to $699
- 573$700 to $749
- 715$750 to $799
- 1,020$800 to $899
- 1,227$900 to $999
- 1,248$1,000 to $1,249
- 520$1,250 to $1,499
- 297$1,500 to $1,999
- 46$2,000 to $2,499
- 24$2,500 to $2,999
- 15$3,000 to $3,499
- 271$3,500 or more
- 385No cash rent


Percentage of workers working in this county: 75.9%
Number of people working at home: 3,919 (13.0% of all workers)
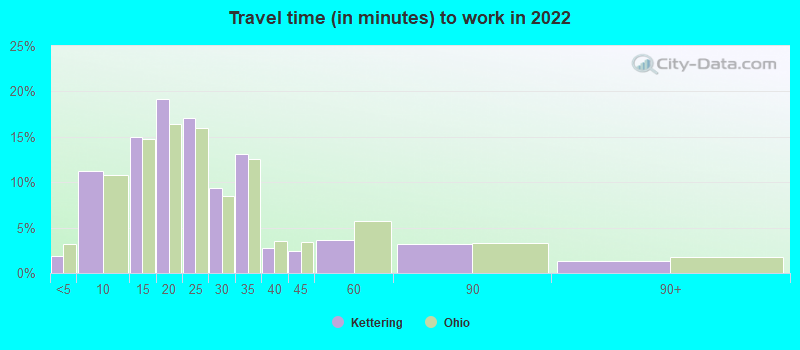
Travel time to work (commute)
- Less than 5 minutes: 619
- 5 to 9 minutes: 2,936
- 10 to 14 minutes: 4,629
- 15 to 19 minutes: 6,713
- 20 to 24 minutes: 5,389
- 25 to 29 minutes: 1,601
- 30 to 34 minutes: 2,170
- 35 to 39 minutes: 387
- 40 to 44 minutes: 319
- 45 to 59 minutes: 724
- 60 to 89 minutes: 624
- 90 or more minutes: 207
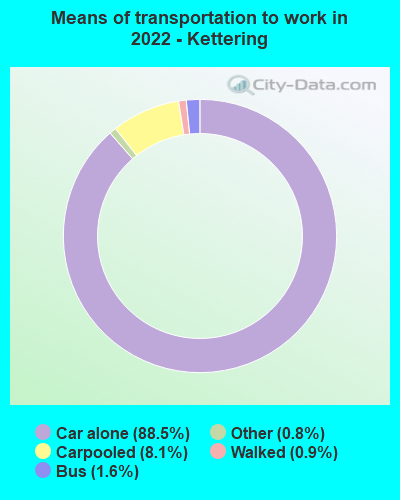
Means of transportation to work:
- Drove a car alone: 23,959 (77.5%)
- Carpooled: 2,288 (7.4%)
- Bus: 264 (0.9%)
- Long-distance train or commuter rail: 10 (0.0%)
- Taxi: 348 (1.1%)
- Bicycle: 25 (0.1%)
- Walked: 206 (0.7%)
- Worked at home: 3,919 (12.7%)

- Unemployment by race in 2022
- Unemployment rate for White non-Hispanic residents
- 3.0%Males
- 1.7%Females
- Unemployment rate for Black residents
- 8.2%Males
- 5.5%Females
- Unemployment rate for Asian residents
- 3.9%Males
- 5.6%Females
- Unemployment rate for two or more race residents
- 6.5%Males
- 2.7%Females
- Unemployment rate for Hispanic or Latino residents
- 1.5%Males

- Year of entry for the foreign-born population in Kettering, Ohio
- 2,2772010 or later
- 5372000 to 2009
- 1481990 to 1999
- 2471980 to 1989
- 1621970 to 1979
- 672Before 1970

First ancestries reported:
- German: 5,884 (24.7%)
- English: 2,891 (12.2%)
- American: 2,528 (10.6%)
- Irish: 1,694 (7.1%)
- European: 1,172 (4.9%)
- Italian: 622 (2.6%)
- Polish: 381 (1.6%)
- African: 322 (1.4%)
- French: 274 (1.2%)
- Scottish: 266 (1.1%)
- Eastern European: 232 (1.0%)
- Hungarian: 214 (0.9%)
- Greek: 195 (0.8%)
- Scotch-Irish: 173 (0.7%)
- Dutch: 121 (0.5%)
- British: 87 (0.4%)
- Russian: 81 (0.3%)
- Northern European: 67 (0.3%)
- Lebanese: 61 (0.3%)
- Arab: 54 (0.2%)
- Haitian: 54 (0.2%)
- French Canadian: 48 (0.2%)
- Norwegian: 42 (0.2%)
- Czechoslovakian: 39 (0.2%)
- Turkish: 39 (0.2%)
- Welsh: 32 (0.1%)
- Austrian: 31 (0.1%)
- Swiss: 31 (0.1%)
- Ukrainian: 31 (0.1%)
- Iranian: 30 (0.1%)
- Sudanese: 30 (0.1%)
- Jamaican: 30 (0.1%)
- Lithuanian: 29 (0.1%)
- Nigerian: 27 (0.1%)
- Canadian: 26 (0.1%)
- Croatian: 25 (0.1%)
- Serbian: 24 (0.1%)
- Ghanaian: 24 (0.1%)
- Swedish: 23 (0.10%)
- Belgian: 21 (0.09%)
- Scandinavian: 20 (0.08%)
- Romanian: 14 (0.06%)
- Carpatho Rusyn: 11 (0.05%)
- Bulgarian: 10 (0.04%)
- Finnish: 10 (0.04%)
- South African: 10 (0.04%)
- Pennsylvania German: 8 (0.03%)
- Danish: 7 (0.03%)
- Czech: 7 (0.03%)
- Barbadian: 7 (0.03%)
- Yugoslavian: 6 (0.03%)
- Luxembourger: 5 (0.02%)
- Guyanese: 5 (0.02%)
- Slovene: 5 (0.02%)
- Alsatian: 3 (0.01%)
Most common places of birth for foreign-born residents (%):
| Kettering: | 13.9% (457) |
| Ohio: | 0.5% (3,042) |
| Kettering: | 9.2% (304) |
| Ohio: | 11.6% (66,525) |
| Kettering: | 7.3% (242) |
| Ohio: | 6.2% (35,703) |
| Kettering: | 5.2% (171) |
| Ohio: | 2.2% (12,846) |
| Kettering: | 4.8% (159) |
| Ohio: | 0.4% (2,154) |
| Kettering: | 4.2% (139) |
| Ohio: | 2.6% (14,988) |
| Kettering: | 4.1% (134) |
| Ohio: | 3.1% (17,818) |
| Kettering: | 2.5% (84) |
| Ohio: | 1.0% (5,979) |
| Kettering: | 2.5% (82) |
| Ohio: | 1.0% (5,444) |
| Kettering: | 2.4% (78) |
| Ohio: | 1.2% (7,029) |
| Kettering: | 2.2% (74) |
| Ohio: | 0.7% (4,155) |
| Kettering: | 2.2% (71) |
| Ohio: | 1.1% (6,096) |
| Kettering: | 2.1% (69) |
| Ohio: | 0.2% (1,056) |
| Kettering: | 2.0% (66) |
| Ohio: | 0.9% (5,422) |
| Kettering: | 1.9% (63) |
| Ohio: | 7.8% (44,796) |
| Kettering: | 1.8% (59) |
| Ohio: | 0.5% (2,620) |
| Kettering: | 1.6% (54) |
| Ohio: | 0.6% (3,669) |
| Kettering: | 1.5% (50) |
| Ohio: | 0.1% (408) |
Place of birth for U.S.-born residents:
- This state: 40,669
- Other state: 12,625
- Northeast: 2,372
- Midwest: 3,795
- South: 4,654
- West: 1,839
86.9% of Kettering residents lived in the same house 1 years ago.
Out of people who lived in different houses, 37.8% lived in this county.
Out of people who lived in different counties, 61.9% lived in Ohio.
| Kettering: | 86.9% |
| State average: | 87.8% |
Education attainment for males 25 years and older:
- No schooling: 105
- Nursery to 4th grade: 0
- 5th and 6th grade: 23
- 7th and 8th grade: 60
- 9th grade: 143
- 10th grade: 196
- 11th grade: 38
- 12th grade, no diploma: 211
- High school graduate (or equivalency): 4,292
- Less than 1 year of college: 1,532
- Some college more than 1 year, no degree: 2,955
- Associate degree: 1,909
- Bachelor's degree: 4,653
- Master's degree: 2,894
- Professional school degree: 576
- Doctorate degree: 448

Education attainment for females 25 years and older:
- No schooling: 155
- Nursery to 4th grade: 53
- 5th and 6th grade: 74
- 7th and 8th grade: 67
- 9th grade: 52
- 10th grade: 100
- 11th grade: 143
- 12th grade, no diploma: 192
- High school graduate (or equivalency): 4,243
- Less than 1 year of college: 2,053
- Some college more than 1 year, no degree: 3,008
- Associate degree: 2,219
- Bachelor's degree: 5,450
- Master's degree: 3,711
- Professional school degree: 320
- Doctorate degree: 125


Housing units in structures:
- One, detached: 19,308
- One, attached: 1,235
- Two: 545
- 3 or 4: 2,850
- 5 to 9: 1,425
- 10 to 19: 1,060
- 20 to 49: 548
- 50 or more: 758
- Mobile homes: 105
- Boats, RVs, vans, etc.: 6
Median worth of mobile homes: $59,658
Housing units lacking complete kitchen facilities in 2022: 1.3%
House/condo owner moved in on average 10 years ago
Renter moved in on average 2 years ago

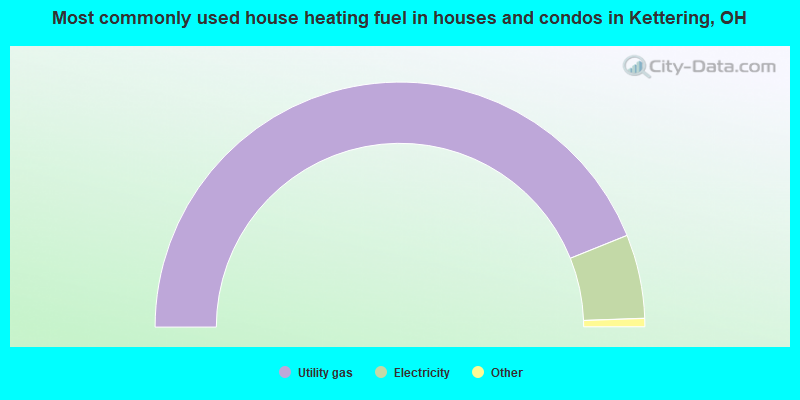
- 87.9%Utility gas
- 11.1%Electricity
- 0.6%Bottled, tank, or LP gas
- 0.2%Fuel oil, kerosene, etc.
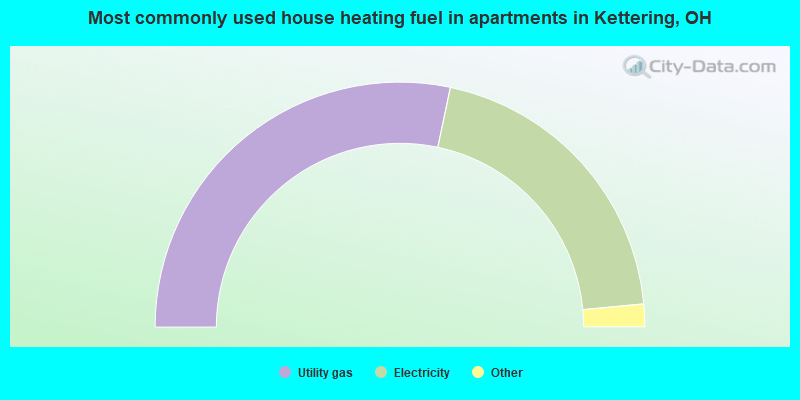
- 56.6%Utility gas
- 40.4%Electricity
- 2.1%Bottled, tank, or LP gas
- 0.8%No fuel used
Private vs. public school enrollment:
| Here: | 12.2% |
| Ohio: | 16.0% |
| Here: | 12.1% |
| Ohio: | 13.1% |
| Here: | 20.0% |
| Ohio: | 22.3% |


