Keene, TX (Texas) Houses and Residents
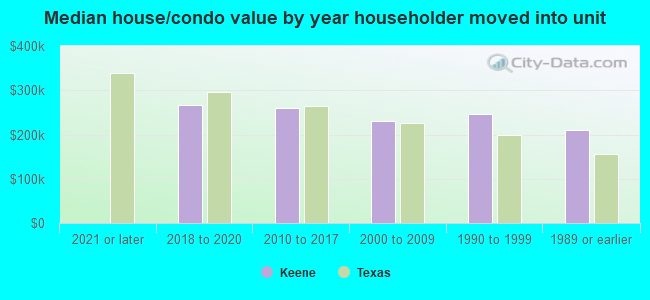
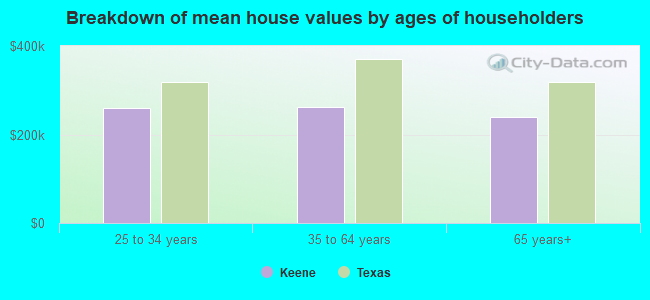
| Keene: | $260,096 |
| Texas: | $275,400 |
Total population: 6,153 (Urban population: 4,795 (all inside urban clusters), Rural population: 81 (all nonfarm))
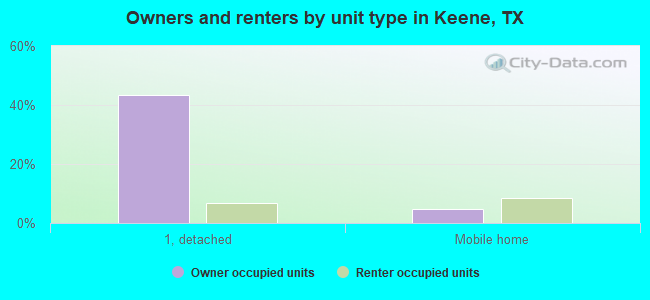
Houses: 2,532 (2,240 occupied: 1,104 owner occupied, 1,152 renter occupied)
| % of renters here: | 51% |
| State: | 38% |
Housing density: 902 houses/condos per square mile
Median price asked for vacant for-sale houses and condos in 2022 in this county: $309,070.
Median contract rent in 2022: $771 (lower quartile is $581, upper quartile is $942)
Median rent asked for vacant for-rent units in 2022: $787
Median gross rent in Keene, TX in 2022: $988
Housing units in Keene with a mortgage: 683 (17 second mortgage, 0 home equity loan, 6 both second mortgage and home equity loan)
Houses without a mortgage: 0
Median household income for houses/condos with a mortgage: $88,556
Median household income for apartments without a mortgage: $43,211
Median monthly housing costs: $1,053
Compare current foreclosures near Keene, TX:
| Photo | Address | Area | Beds / Baths | Price | Details |
|---|---|---|---|---|---|

|
#1
Pecan St
Keene, TX 76059
|
- sq. feet
|
- baths - beds |
show details | |

|
#2
Oakwood Dr
Keene, TX 76059
|
2,080 sq. feet
|
- baths - beds |
show details | |

|
#3
N Ray St
Alvarado, TX 76009
|
1,001 sq. feet
|
1 baths 3 beds |
show details | |

|
#4
Chambers Creek Dr
Fort Worth, TX 76140
|
1,833 sq. feet
|
2 baths 3 beds |
show details | |

|
#5
Flagstaff Run
Fort Worth, TX 76140
|
1,518 sq. feet
|
2 baths 3 beds |
show details | |

|
#6
Collins Rd
Burleson, TX 76028
|
- sq. feet
|
2 baths 3 beds |
show details | |

|
#7
Spring Branch Dr
Cleburne, TX 76033
|
1,513 sq. feet
|
2 baths 3 beds |
show details | |

|
#8
Presidents Way
Venus, TX 76084
|
- sq. feet
|
3 baths 5 beds |
show details | |

|
#9
Mckittrick Ln
Godley, TX 76044
|
2,015 sq. feet
|
2 baths 4 beds |
show details | |

|
#10
Cedar Oaks Rd
Grandview, TX 76050
|
- sq. feet
|
2 baths 2 beds |
show details |
| Photo | Address | Area | Beds / Baths | Price | Details |
|---|---|---|---|---|---|

|
#11
Angler Dr
Crowley, TX 76036
|
2,036 sq. feet
|
2 baths 3 beds |
show details | |

|
#12
Raptor Road
Alvarado, TX 76009
|
- sq. feet
|
2 baths 4 beds |
show details | |

|
#13
Stone Creek Dr
Mansfield, TX 76063
|
1,700 sq. feet
|
2 baths 3 beds |
show details | |

|
#14
Ridge Dr N
Cleburne, TX 76033
|
2,128 sq. feet
|
2 baths 4 beds |
show details | |

|
#15
Mayberry Ln
Fort Worth, TX 76123
|
3,468 sq. feet
|
3 baths 5 beds |
show details | |

|
#16
Apollo Dr
Joshua, TX 76058
|
1,680 sq. feet
|
2 baths 3 beds |
show details | |

|
#17
Ridgehill Ct
Burleson, TX 76028
|
2,044 sq. feet
|
2 baths 3 beds |
show details | |

|
#18
Sweet Flag Lane
Fort Worth, TX 76123
|
2,816 sq. feet
|
2 baths 4 beds |
show details | |

|
#19
Meadow Gln
Crowley, TX 76036
|
2,058 sq. feet
|
2 baths 3 beds |
show details | |

|
#20
Barkridge Trl
Burleson, TX 76028
|
2,032 sq. feet
|
2 baths 3 beds |
show details |
| Photo | Address | Area | Beds / Baths | Price | Details |
|---|---|---|---|---|---|

|
#21
Ridgewood Dr
Joshua, TX 76058
|
2,372 sq. feet
|
3 baths 3 beds |
show details | |

|
#22
Ghost Ridge Dr
Venus, TX 76084
|
1,456 sq. feet
|
2 baths 3 beds |
show details | |

|
#23
Downing Ln
Cleburne, TX 76031
|
3,661 sq. feet
|
3 baths 5 beds |
show details | |

|
#24
Norrell Rd
Venus, TX 76084
|
2,128 sq. feet
|
2 baths 4 beds |
show details | |

|
#25
Navarro St
Crowley, TX 76036
|
1,918 sq. feet
|
2 baths 3 beds |
show details | |

|
#26
Lake Shore Ct
Crowley, TX 76036
|
1,998 sq. feet
|
2 baths 4 beds |
show details | |

|
#27
Grand Gulf Rd
Fort Worth, TX 76123
|
2,105 sq. feet
|
2 baths 3 beds |
show details | |

|
#28
Heberle Dr
Burleson, TX 76028
|
1,931 sq. feet
|
2 baths 3 beds |
show details | |

|
#29
Retta Mansfield Rd
Mansfield, TX 76063
|
1,080 sq. feet
|
1 baths 3 beds |
show details | |

|
#30
Vera Dr
Burleson, TX 76028
|
1,894 sq. feet
|
2 baths 4 beds |
show details |
| Photo | Address | Area | Beds / Baths | Price | Details |
|---|---|---|---|---|---|

|
#31
Horse Creek Rd
Crowley, TX 76036
|
2,631 sq. feet
|
3 baths 4 beds |
show details | |

|
#32
Saint Vincent Rd
Fort Worth, TX 76123
|
1,778 sq. feet
|
2 baths 3 beds |
show details | |

|
#33
Anna Lea Ln
Burleson, TX 76028
|
3,285 sq. feet
|
2 baths 3 beds |
show details | |

|
#34
Blazing Star Trl
Burleson, TX 76028
|
2,182 sq. feet
|
2 baths 4 beds |
show details | |

|
#35
Double Oak Ln
Fort Worth, TX 76123
|
3,386 sq. feet
|
3 baths 4 beds |
show details | |

|
#36
Skelly St
Crowley, TX 76036
|
1,287 sq. feet
|
2 baths 3 beds |
show details | |

|
#37
Queens Brook Ct
Fort Worth, TX 76140
|
1,439 sq. feet
|
2 baths 3 beds |
show details | |

|
#38
Barberry Tree Cv
Crowley, TX 76036
|
3,648 sq. feet
|
2 baths 5 beds |
show details | |

|
#39
Riverbed Dr
Crowley, TX 76036
|
3,649 sq. feet
|
3 baths 5 beds |
show details | |

|
#40
Pheasant Run
Crowley, TX 76036
|
2,352 sq. feet
|
2 baths 3 beds |
show details |
| Photo | Address | Area | Beds / Baths | Price | Details |
|---|---|---|---|---|---|

|
#41
Meadowlark Cir
Crowley, TX 76036
|
1,407 sq. feet
|
2 baths 3 beds |
show details | |

|
#42
Thomas Crossing Dr
Burleson, TX 76028
|
4,054 sq. feet
|
3 baths 4 beds |
show details | |

|
#43
Ardenwood Dr
Fort Worth, TX 76123
|
4,154 sq. feet
|
4 baths 6 beds |
show details | |

|
#44
Cypress Gardens Dr
Fort Worth, TX 76123
|
2,490 sq. feet
|
2 baths 3 beds |
show details | |

|
#45
Brownford Dr
Burleson, TX 76028
|
1,447 sq. feet
|
2 baths 3 beds |
show details | |

|
#46
Cloverglen Ln
Fort Worth, TX 76123
|
1,813 sq. feet
|
2 baths 3 beds |
show details | |

|
#47
Busch Gardens Dr
Fort Worth, TX 76123
|
1,801 sq. feet
|
2 baths 3 beds |
show details | |

|
#48
E Fm 1187
Burleson, TX 76028
|
2,836 sq. feet
|
3 baths 4 beds |
show details | |

|
#49
Clearbrook Dr
Fort Worth, TX 76123
|
1,959 sq. feet
|
2 baths 3 beds |
show details | |

|
Check over 1 million property listings on Foreclosure.com!
|
browse all offers | |||

Latest news about housing in Keene, TX collected exclusively by city-data.com from local newspapers, TV, and radio stations


Median year apartment built: 1989
Household type by relationship:
Households: 6,903- Male householders: 979 (226 living alone), Female householders: 1,277 (385 living alone)
1,212 spouses (1,200 opposite-sex spouses), 90 unmarried partners, (90 opposite-sex unmarried partners), 1,884 children (1,849 natural, 25 adopted, 9 stepchildren), 110 grandchildren, 86 brothers or sisters, 278 parents, 0 foster children, 185 other relatives, 295 non-relatives
- In group quarters: 502
Size of family households: 511 2-persons, 348 3-persons, 352 4-persons, 209 5-persons, 70 6-persons, 3 7-or-more-persons.
Size of nonfamily households: 700 1-person, 68 2-persons, 21 4-persons, 8 6-persons.
1,347 married couples with children.
121 single-parent households (33 men, 88 women).
71.8% of residents of Keene speak English at home.
25.3% of residents speak Spanish at home (75% speak English very well, 12% speak English well, 13% speak English not well, 1% don't speak English at all).
2.3% of residents speak Asian or Pacific Island language at home (20% speak English very well, 80% speak English well).
Foreign born population: 970 (14.1%)
(49.7% of them are naturalized citizens)
| Here: | 6.3 |
| State: | 6.3 |
| Here: | 3.7 |
| State: | 4.0 |
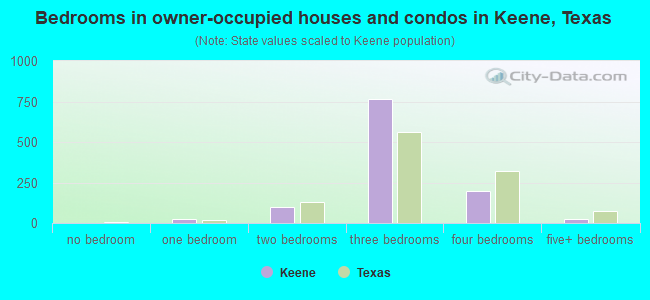
- Bedrooms in owner-occupied houses and condos in Keene, Texas
- 0no bedroom
- 241 bedroom
- 972 bedrooms
- 7663 bedrooms
- 1954 bedrooms
- 225+ bedrooms
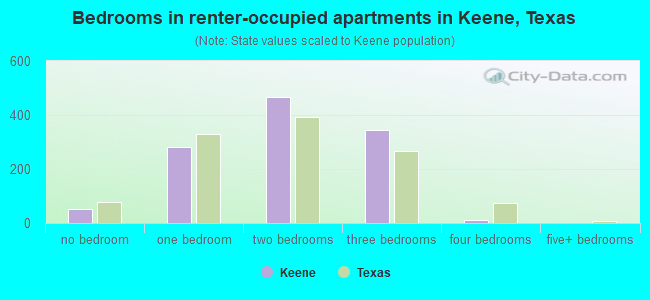
- Bedrooms in renter-occupied apartments in Keene, Texas
- 52no bedroom
- 2801 bedroom
- 4652 bedrooms
- 3453 bedrooms
- 114 bedrooms
- 05+ bedrooms
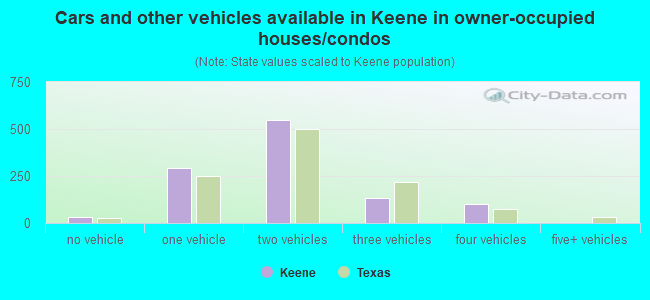
- Cars and other vehicles available in Keene in owner-occupied houses/condos
- 31no vehicle
- 2931 vehicle
- 5482 vehicles
- 1313 vehicles
- 1024 vehicles
- 05+ vehicles
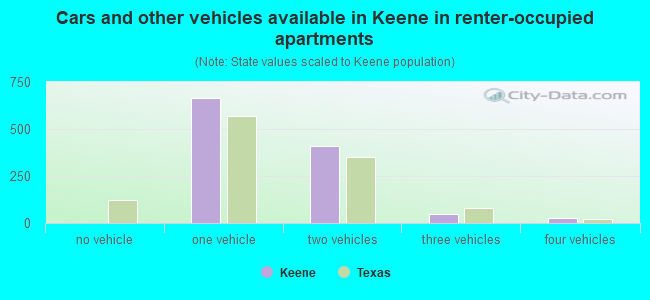
- Cars and other vehicles available in Keene in renter-occupied apartments
- 0no vehicle
- 6641 vehicle
- 4082 vehicles
- 493 vehicles
- 274 vehicles
- 55+ vehicles
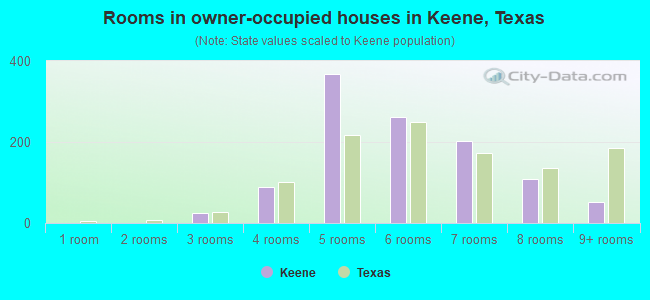
- Rooms in owner-occupied houses in Keene, Texas
- 01 room
- 02 rooms
- 243 rooms
- 894 rooms
- 3675 rooms
- 2616 rooms
- 2027 rooms
- 1098 rooms
- 529+ rooms
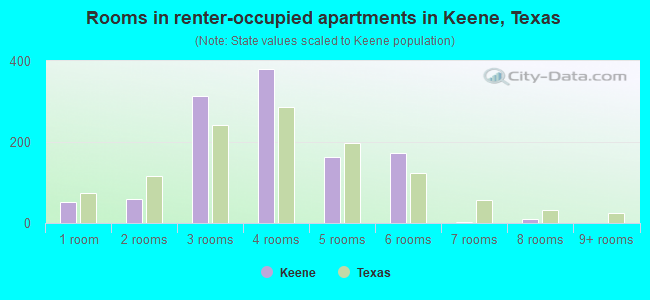
- Rooms in renter-occupied apartments in Keene, Texas
- 521 room
- 592 rooms
- 3143 rooms
- 3804 rooms
- 1625 rooms
- 1726 rooms
- 37 rooms
- 118 rooms
- 09+ rooms
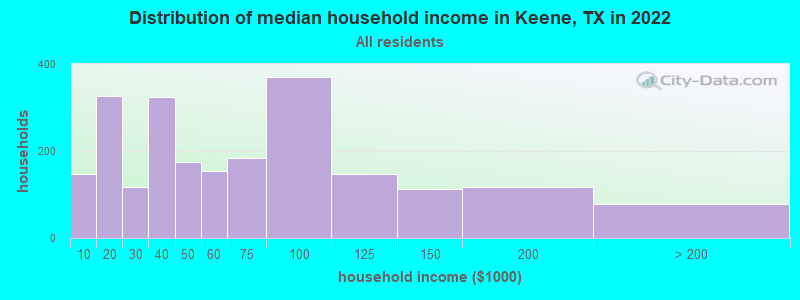
Keene, TX household income distribution

- 148Less than $10,000
- 327$10,000 to $19,999
- 118$20,000 to $29,999
- 323$30,000 to $39,999
- 175$40,000 to $49,999
- 153$50,000 to $59,999
- 183$60,000 to $74,999
- 371$75,000 to $99,999
- 147$100,000 to $124,999
- 113$125,000 to $149,999
- 117$150,000 to $199,999
- 79$200,000 or more
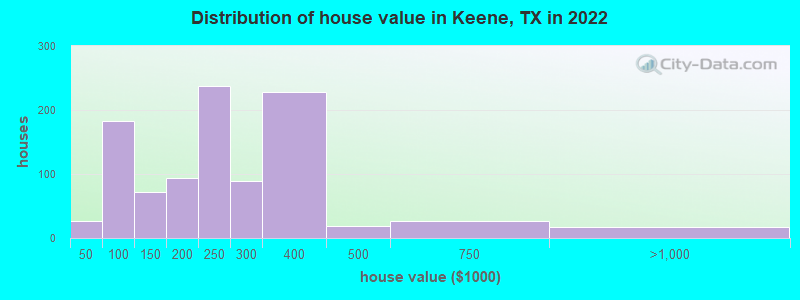
Home value of owner - occupied houses in 2022 in Keene, TX
-
- 11$20,000 to $24,999
- 15$25,000 to $29,999
- 12$50,000 to $59,999
- 38$60,000 to $69,999
- 42$70,000 to $79,999
- 83$80,000 to $89,999
- 6$90,000 to $99,999
- 31$100,000 to $124,999
- 40$125,000 to $149,999
- 61$150,000 to $174,999
- 31$175,000 to $199,999
- 236$200,000 to $249,999
- 89$250,000 to $299,999
- 227$300,000 to $399,999
- 17$400,000 to $499,999
- 26$500,000 to $749,999
- 17$750,000 to $999,999
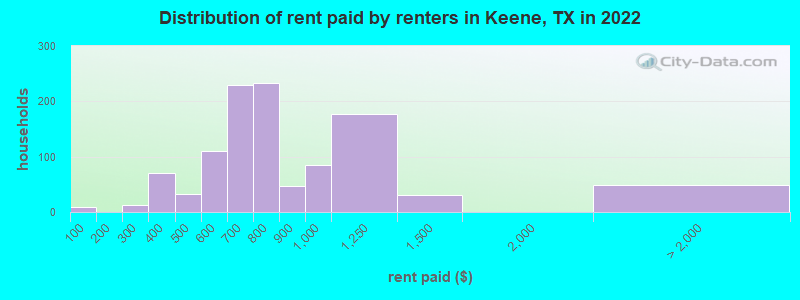
Rent paid by renters in 2022 in Keene, TX
-
- 9Less than $100
- 12$250 to $299
- 69$350 to $399
- 31$450 to $499
- 46$500 to $549
- 64$550 to $599
- 152$600 to $649
- 77$650 to $699
- 50$700 to $749
- 182$750 to $799
- 47$800 to $899
- 84$900 to $999
- 176$1,000 to $1,249
- 29$1,250 to $1,499
- 39$2,000 to $2,499
- 9No cash rent
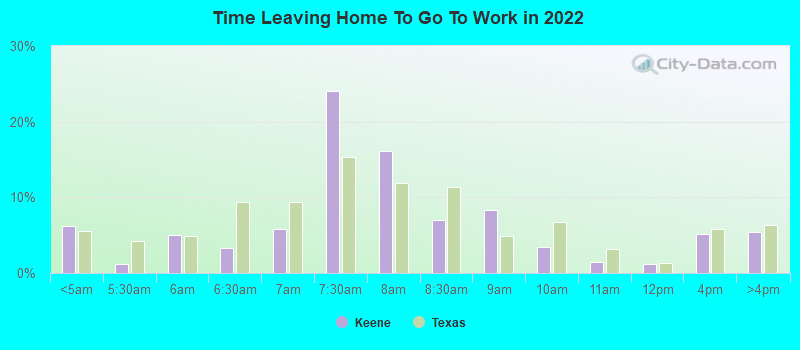
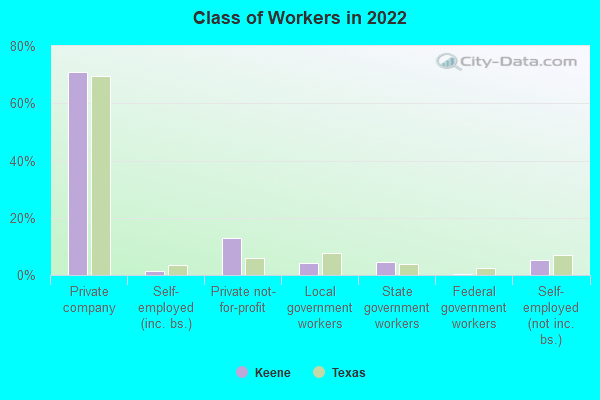
Percentage of workers working in this county: 69.9%
Number of people working at home: 174 (5.7% of all workers)
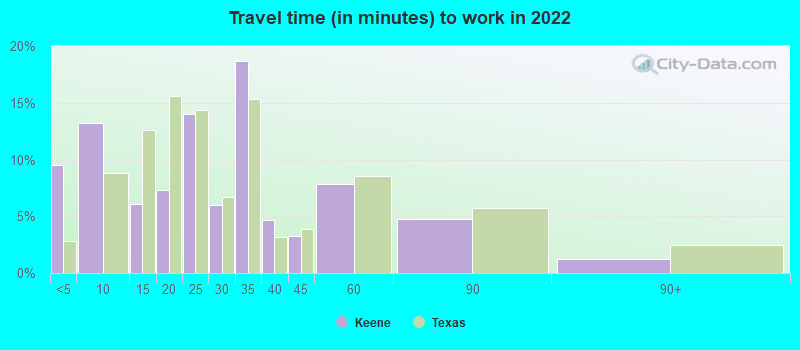
Travel time to work (commute)
- Less than 5 minutes: 227
- 5 to 9 minutes: 225
- 10 to 14 minutes: 364
- 15 to 19 minutes: 295
- 20 to 24 minutes: 253
- 25 to 29 minutes: 51
- 30 to 34 minutes: 676
- 35 to 39 minutes: 78
- 40 to 44 minutes: 78
- 45 to 59 minutes: 339
- 60 to 89 minutes: 138
- 90 or more minutes: 24
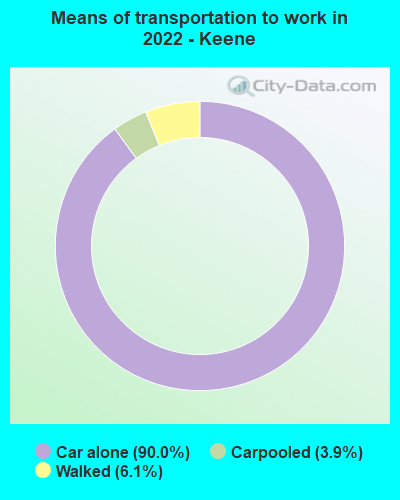
Means of transportation to work:
- Drove a car alone: 1,237 (78.2%)
- Carpooled: 58 (3.7%)
- Walked: 89 (5.6%)
- Worked at home: 174 (11.0%)
- Unemployment by race in 2022
- Unemployment rate for White non-Hispanic residents
- 7.4%Males
- 2.3%Females
- Unemployment rate for Black residents
- 32.1%Females
- Unemployment rate for Asian residents
- 41.0%Males
- Unemployment rate for Hispanic or Latino residents
- 0.8%Males
- 0.7%Females
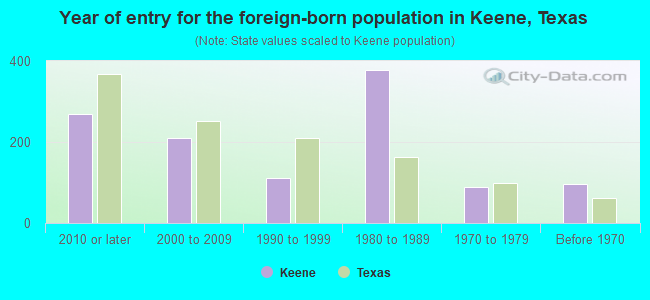
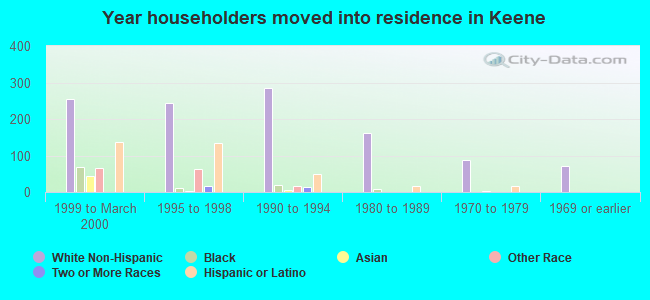
- Year of entry for the foreign-born population in Keene, Texas
- 2702010 or later
- 2102000 to 2009
- 1111990 to 1999
- 3771980 to 1989
- 901970 to 1979
- 96Before 1970
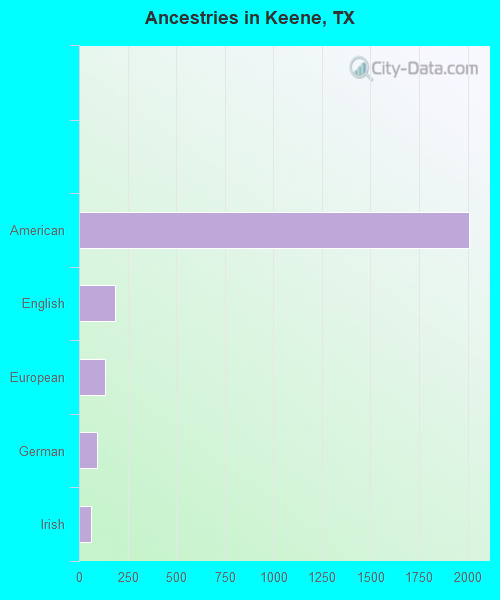
First ancestries reported:
- American: 2,010 (40.8%)
- English: 185 (3.8%)
- European: 133 (2.7%)
- German: 92 (1.9%)
- Irish: 60 (1.2%)
- Jamaican: 15 (0.3%)
- Polish: 12 (0.2%)
- Serbian: 11 (0.2%)
- British: 9 (0.2%)
- Norwegian: 9 (0.2%)
- Scottish: 8 (0.2%)
- Swedish: 7 (0.1%)
- Nigerian: 6 (0.1%)
- African: 6 (0.1%)
- Trinidadian and Tobagonian: 5 (0.1%)
- Bahamian: 4 (0.08%)
- Belizean: 1 (0.02%)
- West Indian: 1 (0.02%)
Most common places of birth for foreign-born residents (%):
| Keene: | 45.8% (303) |
| Texas: | 48.4% (2,411,723) |
| Keene: | 26.9% (178) |
| Texas: | 2.1% (103,148) |
| Keene: | 3.9% (26) |
| Texas: | 0.0% (274) |
| Keene: | 3.5% (23) |
| Texas: | 0.2% (9,838) |
| Keene: | 2.6% (17) |
| Texas: | 0.4% (21,746) |
| Keene: | 2.3% (15) |
| Texas: | 1.5% (72,413) |
| Keene: | 1.8% (12) |
| Texas: | 0.0% (1,871) |
| Keene: | 1.7% (11) |
| Texas: | 0.2% (9,654) |
| Keene: | 1.5% (10) |
| Texas: | 0.0% (2,124) |
| Keene: | 1.5% (10) |
| Texas: | 2.3% (115,558) |
| Keene: | 1.5% (10) |
| Texas: | 0.4% (17,748) |
Place of birth for U.S.-born residents:
- This state: 3,959
- Other state: 1,869
- Northeast: 395
- Midwest: 389
- South: 476
- West: 521
92.9% of Keene residents lived in the same house 1 years ago.
Out of people who lived in different houses, 30.2% lived in this county.
Out of people who lived in different counties, 73.8% lived in Texas.
| Keene: | 92.9% |
| State average: | 85.7% |
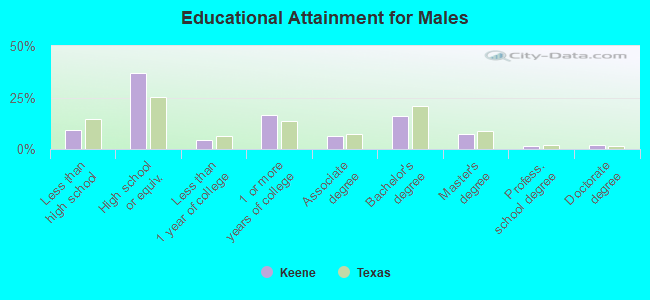
Education attainment for males 25 years and older:
- No schooling: 0
- Nursery to 4th grade: 0
- 5th and 6th grade: 0
- 7th and 8th grade: 33
- 9th grade: 48
- 10th grade: 19
- 11th grade: 28
- 12th grade, no diploma: 40
- High school graduate (or equivalency): 666
- Less than 1 year of college: 75
- Some college more than 1 year, no degree: 292
- Associate degree: 116
- Bachelor's degree: 284
- Master's degree: 134
- Professional school degree: 23
- Doctorate degree: 37
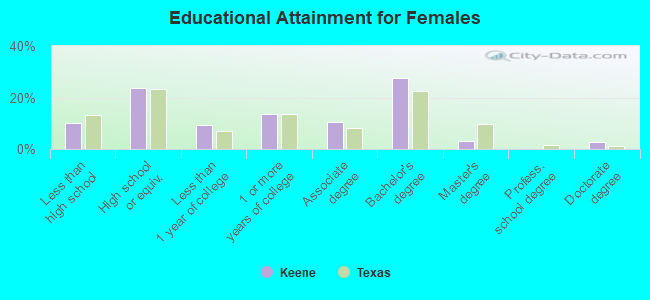
Education attainment for females 25 years and older:
- No schooling: 0
- Nursery to 4th grade: 0
- 5th and 6th grade: 49
- 7th and 8th grade: 17
- 9th grade: 0
- 10th grade: 102
- 11th grade: 26
- 12th grade, no diploma: 19
- High school graduate (or equivalency): 507
- Less than 1 year of college: 201
- Some college more than 1 year, no degree: 296
- Associate degree: 224
- Bachelor's degree: 589
- Master's degree: 63
- Professional school degree: 0
- Doctorate degree: 57


Housing units in structures:
- One, detached: 1,261
- One, attached: 118
- Two: 70
- 3 or 4: 310
- 5 to 9: 176
- 10 to 19: 63
- 20 to 49: 27
- 50 or more: 43
- Mobile homes: 416
- Boats, RVs, vans, etc.: 43
Median worth of mobile homes: $98,575
Housing units lacking complete kitchen facilities in 2022: 2.9%
House/condo owner moved in on average 8 years ago
Renter moved in on average 4 years ago
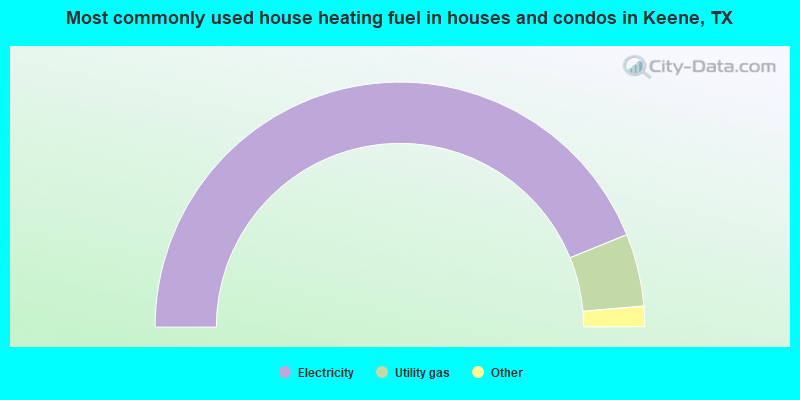
- 87.9%Electricity
- 9.6%Utility gas
- 1.6%No fuel used
- 1.0%Bottled, tank, or LP gas
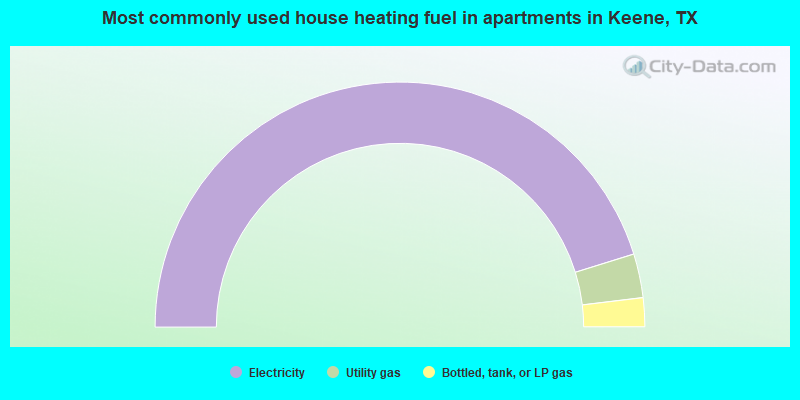
- 90.3%Electricity
- 5.8%Utility gas
- 3.8%Bottled, tank, or LP gas
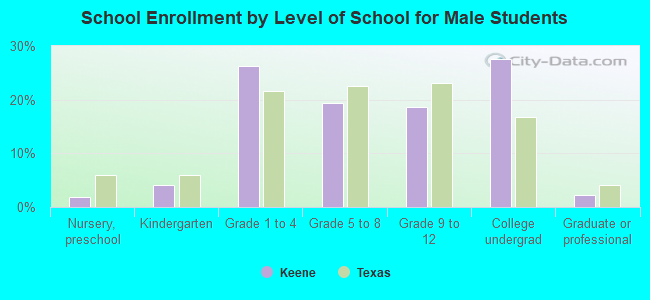
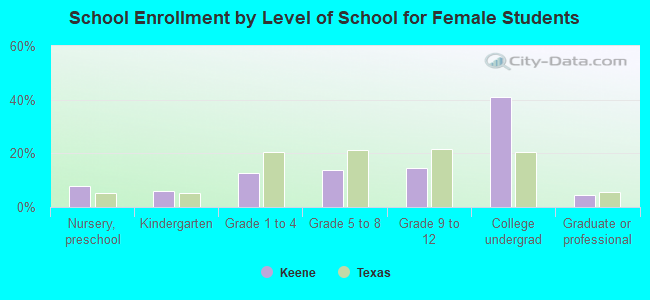
Private vs. public school enrollment:
| Here: | 7.3% |
| Texas: | 8.8% |
| Here: | 19.6% |
| Texas: | 8.0% |
| Here: | 55.4% |
| Texas: | 16.2% |