Johnson City, TN (Tennessee) Houses and Residents
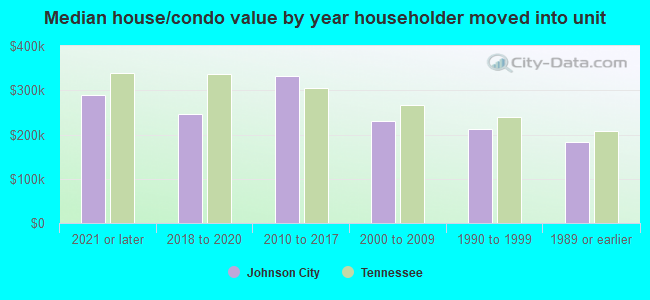
| Johnson City: | $251,700 |
| Tennessee: | $284,800 |
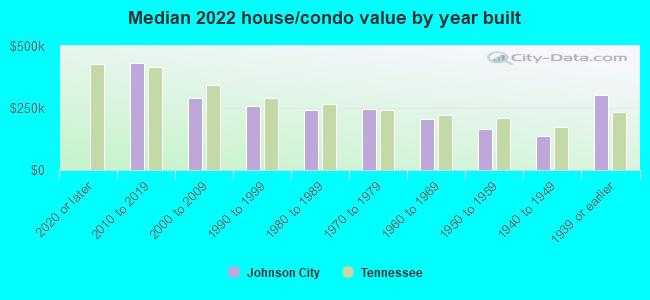
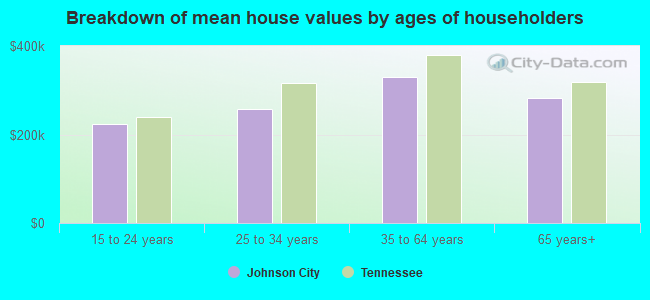
Mean price in 2022:
Detached houses: $345,084
Here: $345,084 State: $374,382 Townhouses or other attached units: $273,896
Here: $273,896 State: $354,101 In 2-unit structures: $180,937
Here: $180,937 State: $247,693 In 3-to-4-unit structures: $74,614
Here: $74,614 State: $239,060 In 5-or-more-unit structures: $141,197
Here: $141,197 State: $317,434 Mobile homes: $44,858
Here: $44,858 State: $101,421
Total population: 65,813 (Urban population: 54,240, Rural population: 1,083 (21 farm, 1,062 nonfarm))
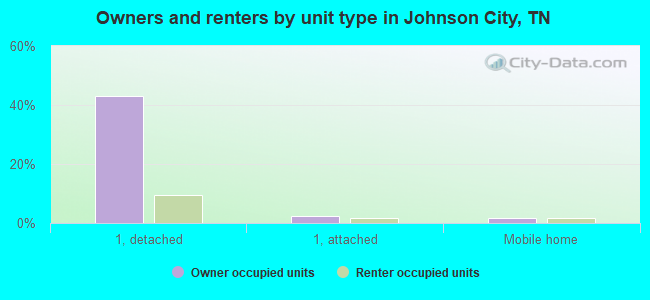
Houses: 33,078 (29,977 occupied: 15,744 owner occupied, 14,233 renter occupied)
| % of renters here: | 47% |
| State: | 33% |
Housing density: 842 houses/condos per square mile
Median price asked for vacant for-sale houses and condos in 2022: $249,951.
Median contract rent in 2022: $777 (lower quartile is $583, upper quartile is $1,018)
Median rent asked for vacant for-rent units in 2022: $2,642
Median gross rent in Johnson City, TN in 2022: $913
Housing units in Johnson City with a mortgage: 9,104 (739 second mortgage, 0 home equity loan, 739 both second mortgage and home equity loan)
Houses without a mortgage: 388
Median household income for houses/condos with a mortgage: $86,238
Median household income for apartments without a mortgage: $72,006
Median monthly housing costs: $912
Compare current foreclosures in Johnson City, TN:
| Photo | Address | Area | Beds / Baths | Price | Details |
|---|---|---|---|---|---|

|
#1
Idlewylde Cir
Johnson City, TN 37601
|
- sq. feet
|
1 baths 3 beds |
show details | |

|
#2
Miller Hill Rd
Johnson City, TN 37601
|
- sq. feet
|
- baths - beds |
$93,600
|
show details |

|
#3
Milligan Hwy
Johnson City, TN 37601
|
1,895 sq. feet
|
1 baths - beds |
show details | |

|
#4
Buckingham Dr
Johnson City, TN 37604
|
1,648 sq. feet
|
2 baths - beds |
show details | |

|
#5
Whispering Pines Rd
Johnson City, TN 37601
|
- sq. feet
|
2 baths 3 beds |
show details | |

|
#6
Oak St
Johnson City, TN 37615
|
820 sq. feet
|
1 baths - beds |
show details | |

|
#7
Suncrest St
Johnson City, TN 37615
|
1,270 sq. feet
|
1 baths - beds |
show details | |

|
#8
Whittling Wood Dr, C O James Warlick
Johnson City, TN 37601
|
2,186 sq. feet
|
2 baths - beds |
show details | |

|
#9
W Poplar St
Johnson City, TN 37604
|
1,030 sq. feet
|
1 baths - beds |
show details | |

|
#10
Polk Ave
Johnson City, TN 37604
|
1,020 sq. feet
|
1 baths - beds |
show details |
| Photo | Address | Area | Beds / Baths | Price | Details |
|---|---|---|---|---|---|

|
#11
Westwood St
Johnson City, TN 37604
|
1,632 sq. feet
|
1 baths - beds |
show details | |

|
#12
Louise St
Johnson City, TN 37601
|
1,092 sq. feet
|
1 baths - beds |
show details | |

|
#13
Sparks Rd
Johnson City, TN 37601
|
1,368 sq. feet
|
1 baths - beds |
show details | |

|
#14
Jackson Ave
Johnson City, TN 37604
|
1,176 sq. feet
|
1 baths - beds |
show details | |

|
#15
Gray Station Rd
Johnson City, TN 37615
|
784 sq. feet
|
1 baths - beds |
show details | |

|
#16
Woodbury Dr
Johnson City, TN 37615
|
1,075 sq. feet
|
1 baths - beds |
show details | |

|
#17
Woodside Dr
Johnson City, TN 37604
|
3,792 sq. feet
|
2 baths - beds |
show details | |

|
#18
Ballard Rd
Johnson City, TN 37604
|
1,403 sq. feet
|
2 baths - beds |
show details | |

|
#19
Blazerview Rd
Johnson City, TN 37615
|
1,268 sq. feet
|
2 baths - beds |
show details | |

|
#20
Fairridge Rd
Johnson City, TN 37604
|
1,596 sq. feet
|
3 baths - beds |
show details |
| Photo | Address | Area | Beds / Baths | Price | Details |
|---|---|---|---|---|---|

|
#21
Pardee St
Johnson City, TN 37601
|
945 sq. feet
|
1 baths - beds |
show details | |

|
#22
Glendale Dr
Johnson City, TN 37604
|
2,132 sq. feet
|
1 baths - beds |
show details | |

|
#23
Indian Ridge Rd
Johnson City, TN 37604
|
768 sq. feet
|
1 baths - beds |
show details | |

|
#24
Faith Cir
Johnson City, TN 37604
|
936 sq. feet
|
1 baths - beds |
show details | |

|
#25
Tee Ct
Johnson City, TN 37601
|
1,464 sq. feet
|
2 baths - beds |
show details | |

|
#26
E Lakeview Dr
Johnson City, TN 37601
|
945 sq. feet
|
1 baths - beds |
show details | |

|
#27
Castlewood Ct
Johnson City, TN 37601
|
1,798 sq. feet
|
2 baths - beds |
show details | |

|
#28
Long St
Johnson City, TN 37601
|
1,204 sq. feet
|
1 baths - beds |
show details | |

|
#29
Boring Chapel Rd
Johnson City, TN 37615
|
2,178 sq. feet
|
2 baths - beds |
show details | |

|
#30
Lowridge Rd
Johnson City, TN 37604
|
1,392 sq. feet
|
1 baths - beds |
show details |
| Photo | Address | Area | Beds / Baths | Price | Details |
|---|---|---|---|---|---|

|
#31
Mckinley Rd
Johnson City, TN 37604
|
2,498 sq. feet
|
2 baths - beds |
show details | |

|
#32
Lindsay Ln
Johnson City, TN 37615
|
1,862 sq. feet
|
2 baths - beds |
show details | |

|
#33
Cedar St
Johnson City, TN 37601
|
1,456 sq. feet
|
2 baths - beds |
show details | |

|
#34
Sunrise Valley Dr
Johnson City, TN 37604
|
2,145 sq. feet
|
2 baths - beds |
show details | |

|
#35
Douglas Dr
Johnson City, TN 37604
|
3,036 sq. feet
|
3 baths - beds |
show details | |

|
#36
Molton Cir
Johnson City, TN 37615
|
1,025 sq. feet
|
1 baths - beds |
show details | |

|
#37
Northeast Dr
Johnson City, TN 37601
|
816 sq. feet
|
1 baths - beds |
show details | |

|
#38
Bowers St
Johnson City, TN 37601
|
1,250 sq. feet
|
2 baths - beds |
show details | |

|
#39
Cresland Dr
Johnson City, TN 37601
|
1,334 sq. feet
|
1 baths - beds |
show details | |

|
#40
N North St
Johnson City, TN 37604
|
876 sq. feet
|
1 baths - beds |
show details |
| Photo | Address | Area | Beds / Baths | Price | Details |
|---|---|---|---|---|---|

|
#41
Sheffield Ct
Johnson City, TN 37604
|
1,971 sq. feet
|
2 baths - beds |
show details | |

|
#42
Sun St
Johnson City, TN 37615
|
1,232 sq. feet
|
1 baths - beds |
show details | |

|
#43
Cindy Anne Dr
Johnson City, TN 37615
|
2,042 sq. feet
|
2 baths - beds |
show details | |

|
#44
Granbrook Dr
Johnson City, TN 37601
|
1,215 sq. feet
|
1 baths - beds |
show details | |

|
#45
Colorado St
Johnson City, TN 37601
|
1,040 sq. feet
|
2 baths - beds |
show details | |

|
#46
Suncrest Dr
Johnson City, TN 37615
|
2,080 sq. feet
|
2 baths - beds |
show details | |

|
#47
Clearview Dr
Johnson City, TN 37604
|
975 sq. feet
|
1 baths - beds |
show details | |

|
#48
Ivy Ct
Johnson City, TN 37615
|
- sq. feet
|
- baths - beds |
show details | |

|
#49
Peoples St Apt 405
Johnson City, TN 37604
|
- sq. feet
|
- baths - beds |
show details | |

|
Check over 1 million property listings on Foreclosure.com!
|
browse all offers | |||


Median year apartment built: 1988
Household type by relationship:
Households: 71,444- Male householders: 14,008 (3,737 living alone), Female householders: 15,969 (6,388 living alone)
11,873 spouses (11,411 opposite-sex spouses), 2,921 unmarried partners, (2,864 opposite-sex unmarried partners), 16,099 children (14,510 natural, 499 adopted, 1,090 stepchildren), 553 grandchildren, 403 brothers or sisters, 881 parents, 0 foster children, 853 other relatives, 4,218 non-relatives
- In group quarters: 3,666
Size of family households: 7,751 2-persons, 4,601 3-persons, 2,522 4-persons, 1,350 5-persons, 352 6-persons, 59 7-or-more-persons.
Size of nonfamily households: 10,125 1-person, 2,102 2-persons, 498 3-persons, 513 4-persons, 67 5-persons, 37 6-persons.
7,529 married couples with children.
3,448 single-parent households (396 men, 3,052 women).
92.5% of residents of Johnson City speak English at home.
3.6% of residents speak Spanish at home (40% speak English very well, 13% speak English well, 28% speak English not well, 19% don't speak English at all).
1.5% of residents speak other Indo-European language at home (84% speak English very well, 10% speak English well, 5% speak English not well).
0.8% of residents speak Asian or Pacific Island language at home (68% speak English very well, 25% speak English well, 3% speak English not well, 4% don't speak English at all).
1.6% of residents speak other language at home (77% speak English very well, 18% speak English well, 5% speak English not well).
Foreign born population: 4,314 (6.0%)
(43.3% of them are naturalized citizens)
| Here: | 6.8 |
| State: | 6.5 |
| Here: | 4.2 |
| State: | 4.4 |
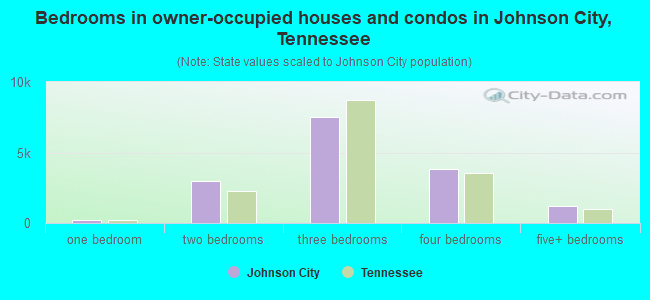
- Bedrooms in owner-occupied houses and condos in Johnson City, Tennessee
- 0no bedroom
- 2381 bedroom
- 2,9492 bedrooms
- 7,4923 bedrooms
- 3,8604 bedrooms
- 1,2055+ bedrooms
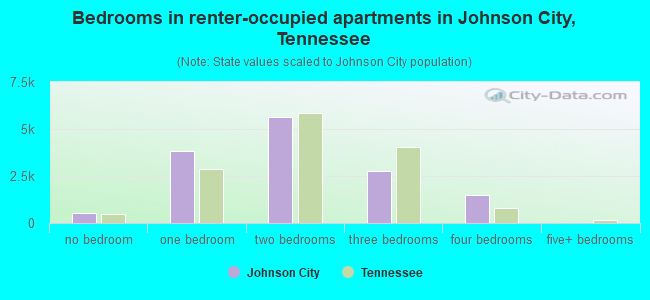
- Bedrooms in renter-occupied apartments in Johnson City, Tennessee
- 512no bedroom
- 3,8331 bedroom
- 5,6242 bedrooms
- 2,7723 bedrooms
- 1,4924 bedrooms
- 05+ bedrooms
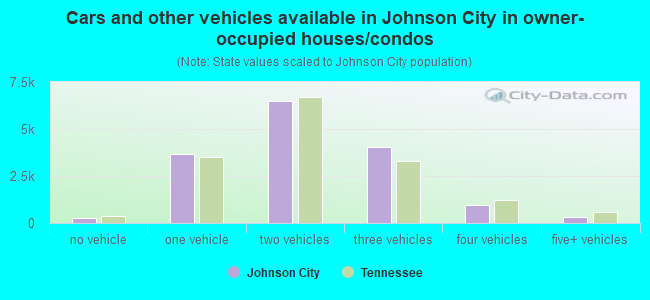
- Cars and other vehicles available in Johnson City in owner-occupied houses/condos
- 256no vehicle
- 3,6511 vehicle
- 6,4882 vehicles
- 4,0673 vehicles
- 9534 vehicles
- 3295+ vehicles
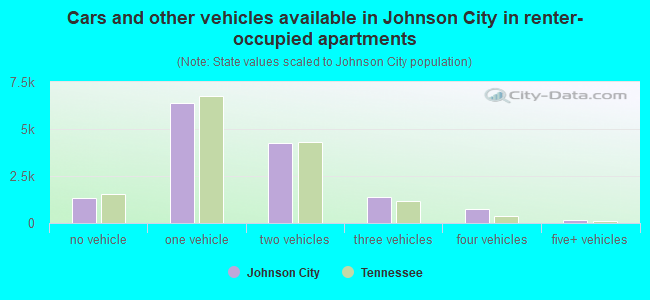
- Cars and other vehicles available in Johnson City in renter-occupied apartments
- 1,315no vehicle
- 6,3861 vehicle
- 4,2742 vehicles
- 1,3693 vehicles
- 7494 vehicles
- 1405+ vehicles
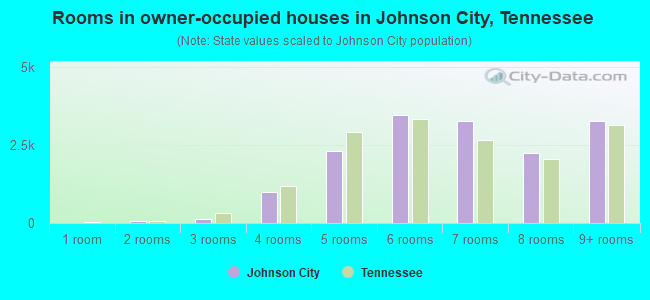
- Rooms in owner-occupied houses in Johnson City, Tennessee
- 01 room
- 542 rooms
- 1303 rooms
- 9954 rooms
- 2,3105 rooms
- 3,4686 rooms
- 3,2767 rooms
- 2,2508 rooms
- 3,2619+ rooms
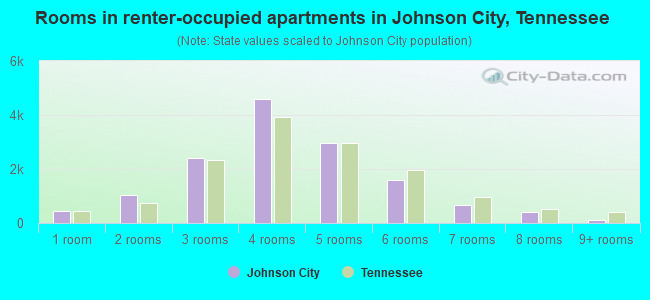
- Rooms in renter-occupied apartments in Johnson City, Tennessee
- 4511 room
- 1,0472 rooms
- 2,3903 rooms
- 4,6104 rooms
- 2,9535 rooms
- 1,6026 rooms
- 6647 rooms
- 4158 rooms
- 1019+ rooms
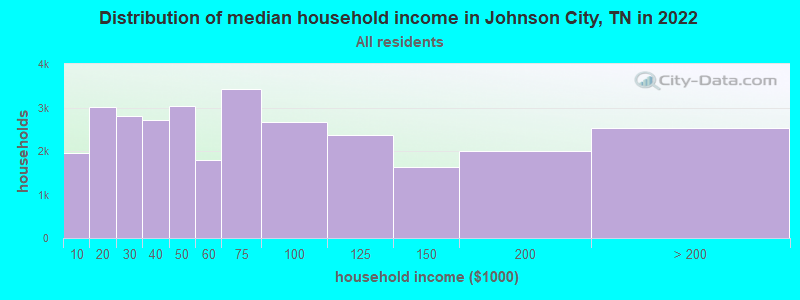
Johnson City, TN household income distribution

- 1,950Less than $10,000
- 3,014$10,000 to $19,999
- 2,809$20,000 to $29,999
- 2,724$30,000 to $39,999
- 3,039$40,000 to $49,999
- 1,803$50,000 to $59,999
- 3,416$60,000 to $74,999
- 2,674$75,000 to $99,999
- 2,379$100,000 to $124,999
- 1,636$125,000 to $149,999
- 2,000$150,000 to $199,999
- 2,533$200,000 or more
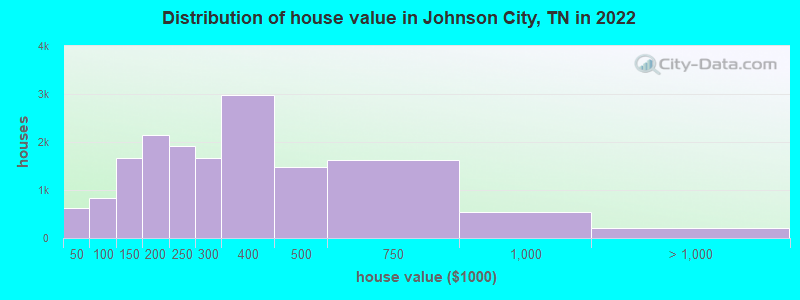
Home value of owner - occupied houses in 2022 in Johnson City, TN
-
- 214Less than $10,000
- 160$10,000 to $14,999
- 160$15,000 to $19,999
- 52$20,000 to $24,999
- 5$30,000 to $34,999
- 37$35,000 to $39,999
- 133$50,000 to $59,999
- 110$60,000 to $69,999
- 215$70,000 to $79,999
- 239$80,000 to $89,999
- 124$90,000 to $99,999
- 795$100,000 to $124,999
- 865$125,000 to $149,999
- 1,128$150,000 to $174,999
- 1,007$175,000 to $199,999
- 1,908$200,000 to $249,999
- 1,657$250,000 to $299,999
- 2,986$300,000 to $399,999
- 1,472$400,000 to $499,999
- 1,629$500,000 to $749,999
- 552$750,000 to $999,999
- 157$1,000,000 to $1,499,999
- 36$1,500,000 to $1,999,999
- 7$2,000,000 or more
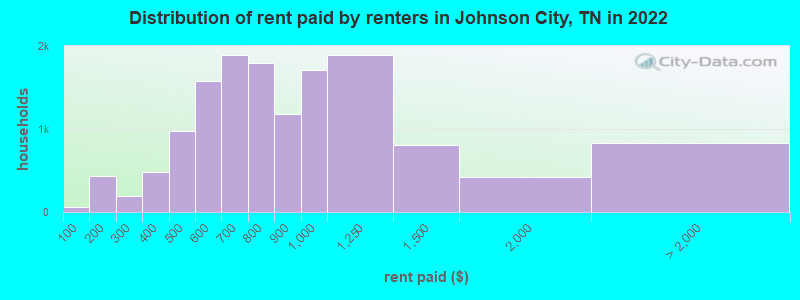
Rent paid by renters in 2022 in Johnson City, TN
-
- 61Less than $100
- 433$150 to $199
- 188$200 to $249
- 290$300 to $349
- 190$350 to $399
- 495$400 to $449
- 480$450 to $499
- 848$500 to $549
- 734$550 to $599
- 1,223$600 to $649
- 672$650 to $699
- 791$700 to $749
- 1,001$750 to $799
- 1,178$800 to $899
- 1,709$900 to $999
- 1,886$1,000 to $1,249
- 804$1,250 to $1,499
- 417$1,500 to $1,999
- 464$2,000 to $2,499
- 39$3,500 or more
- 330No cash rent
Percentage of workers working in this county: 77.4%
Number of people working at home: 4,119 (11.7% of all workers)
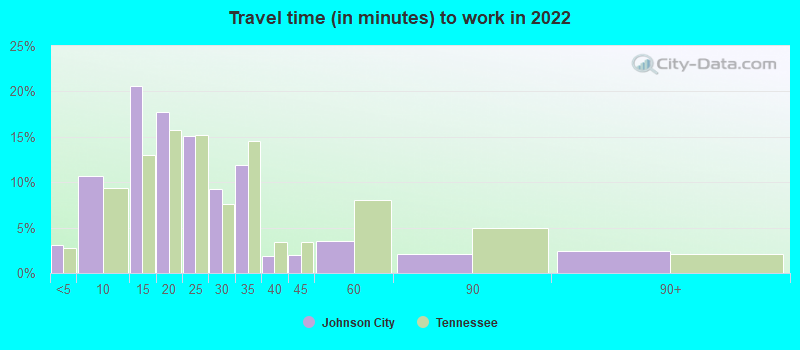
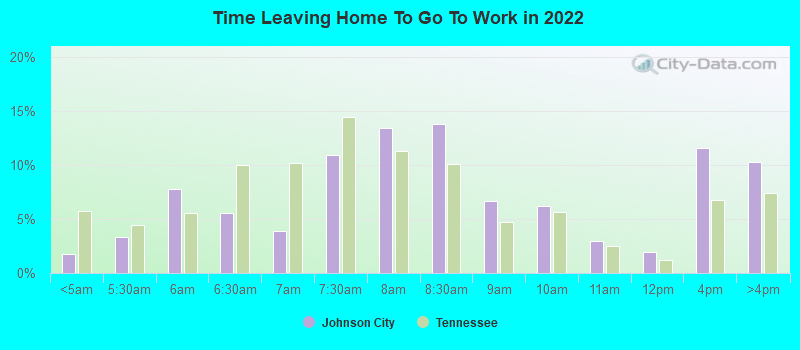
Travel time to work (commute)
- Less than 5 minutes: 1,125
- 5 to 9 minutes: 5,042
- 10 to 14 minutes: 8,813
- 15 to 19 minutes: 6,354
- 20 to 24 minutes: 3,872
- 25 to 29 minutes: 1,901
- 30 to 34 minutes: 3,151
- 35 to 39 minutes: 203
- 40 to 44 minutes: 636
- 45 to 59 minutes: 752
- 60 to 89 minutes: 523
- 90 or more minutes: 680
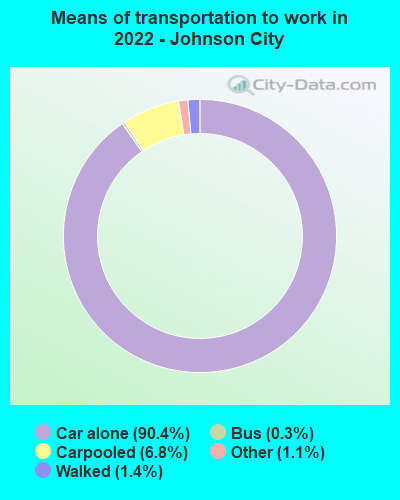
Means of transportation to work:
- Drove a car alone: 48,811 (81.7%)
- Carpooled: 3,903 (6.5%)
- Bus: 155 (0.3%)
- Long-distance train or commuter rail: 7 (0.0%)
- Taxi: 705 (1.2%)
- Bicycle: 39 (0.1%)
- Walked: 756 (1.3%)
- Worked at home: 4,119 (6.9%)
- Unemployment by race in 2022
- Unemployment rate for White non-Hispanic residents
- 3.3%Males
- 3.4%Females
- Unemployment rate for Black residents
- 7.6%Males
- 1.2%Females
- Unemployment rate for Asian residents
- 0.8%Males
- Unemployment rate for other race residents
- 46.2%Females
- Unemployment rate for two or more race residents
- 17.0%Males
- 12.0%Females
- Unemployment rate for Hispanic or Latino residents
- 2.7%Males
- 17.6%Females
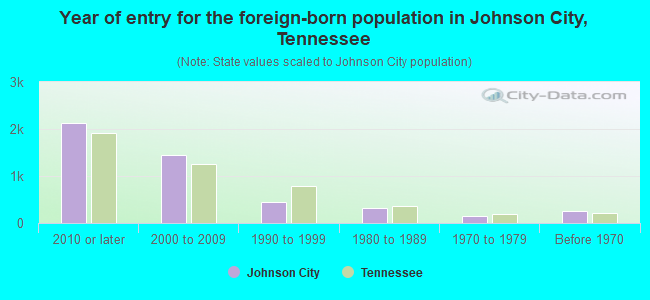
- Year of entry for the foreign-born population in Johnson City, Tennessee
- 2,1192010 or later
- 1,4472000 to 2009
- 4401990 to 1999
- 3111980 to 1989
- 1571970 to 1979
- 250Before 1970
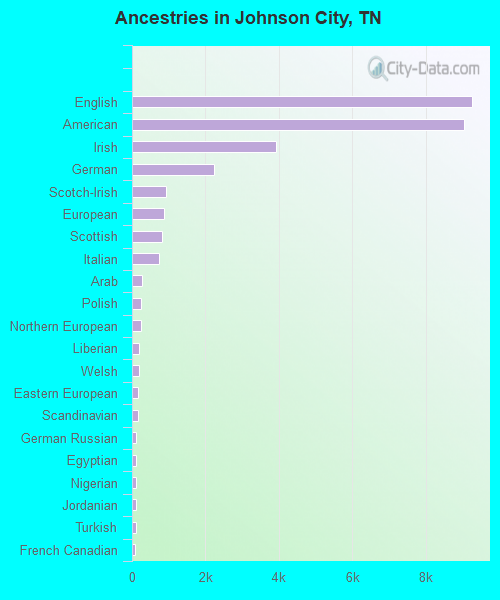
First ancestries reported:
- English: 9,261 (23.5%)
- American: 9,047 (23.0%)
- Irish: 3,934 (10.0%)
- German: 2,236 (5.7%)
- Scotch-Irish: 932 (2.4%)
- European: 873 (2.2%)
- Scottish: 807 (2.1%)
- Italian: 735 (1.9%)
- Arab: 263 (0.7%)
- Polish: 258 (0.7%)
- Northern European: 243 (0.6%)
- Liberian: 180 (0.5%)
- Welsh: 178 (0.5%)
- Eastern European: 169 (0.4%)
- Scandinavian: 157 (0.4%)
- German Russian: 112 (0.3%)
- Egyptian: 110 (0.3%)
- Nigerian: 107 (0.3%)
- Jordanian: 105 (0.3%)
- Turkish: 99 (0.3%)
- French Canadian: 90 (0.2%)
- Dutch: 83 (0.2%)
- Ghanaian: 82 (0.2%)
- Romanian: 82 (0.2%)
- Norwegian: 81 (0.2%)
- French: 67 (0.2%)
- British: 62 (0.2%)
- Swedish: 49 (0.1%)
- Canadian: 47 (0.1%)
- African: 46 (0.1%)
- Swiss: 38 (0.10%)
- Danish: 37 (0.09%)
- Austrian: 36 (0.09%)
- Lebanese: 35 (0.09%)
- Zimbabwean: 35 (0.09%)
- Yugoslavian: 32 (0.08%)
- Australian: 25 (0.06%)
- Hungarian: 22 (0.06%)
- Greek: 22 (0.06%)
- Albanian: 21 (0.05%)
- Ukrainian: 21 (0.05%)
- Haitian: 17 (0.04%)
- Brazilian: 16 (0.04%)
- Bulgarian: 14 (0.04%)
- Portuguese: 12 (0.03%)
- Czechoslovakian: 11 (0.03%)
- West Indian: 10 (0.03%)
- Russian: 8 (0.02%)
- Iranian: 8 (0.02%)
- Slovene: 7 (0.02%)
Most common places of birth for foreign-born residents (%):
| Johnson City: | 12.8% (555) |
| Tennessee: | 23.0% (86,435) |
| Johnson City: | 8.7% (378) |
| Tennessee: | 3.3% (12,582) |
| Johnson City: | 8.3% (359) |
| Tennessee: | 4.6% (17,433) |
| Johnson City: | 7.2% (312) |
| Tennessee: | 6.1% (23,079) |
| Johnson City: | 4.7% (202) |
| Tennessee: | 0.3% (980) |
| Johnson City: | 4.7% (201) |
| Tennessee: | 1.2% (4,587) |
| Johnson City: | 4.1% (177) |
| Tennessee: | 0.3% (948) |
| Johnson City: | 3.7% (159) |
| Tennessee: | 2.7% (10,313) |
| Johnson City: | 3.5% (153) |
| Tennessee: | 0.2% (783) |
| Johnson City: | 3.4% (147) |
| Tennessee: | 1.6% (5,936) |
| Johnson City: | 3.2% (139) |
| Tennessee: | 2.7% (10,295) |
| Johnson City: | 3.0% (130) |
| Tennessee: | 1.2% (4,662) |
| Johnson City: | 2.5% (107) |
| Tennessee: | 5.7% (21,286) |
| Johnson City: | 2.3% (100) |
| Tennessee: | 0.8% (3,098) |
| Johnson City: | 2.3% (98) |
| Tennessee: | 0.3% (991) |
| Johnson City: | 2.2% (95) |
| Tennessee: | 0.4% (1,593) |
| Johnson City: | 2.1% (89) |
| Tennessee: | 0.3% (1,027) |
| Johnson City: | 2.0% (86) |
| Tennessee: | 1.0% (3,809) |
| Johnson City: | 1.7% (75) |
| Tennessee: | 0.4% (1,521) |
| Johnson City: | 1.6% (69) |
| Tennessee: | 0.2% (671) |
| Johnson City: | 1.5% (65) |
| Tennessee: | 0.1% (471) |
| Johnson City: | 1.5% (65) |
| Tennessee: | 0.5% (2,053) |
Place of birth for U.S.-born residents:
- This state: 37,644
- Other state: 28,399
- Northeast: 3,515
- Midwest: 4,544
- South: 17,783
- West: 2,557
77.3% of Johnson City residents lived in the same house 1 years ago.
Out of people who lived in different houses, 26.4% lived in this county.
Out of people who lived in different counties, 40.9% lived in Tennessee.
| Johnson City: | 77.3% |
| State average: | 87.0% |
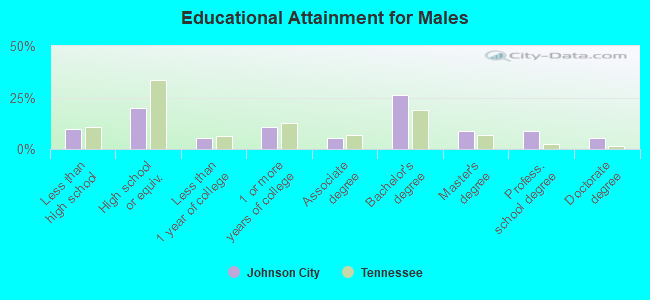
Education attainment for males 25 years and older:
- No schooling: 55
- Nursery to 4th grade: 246
- 5th and 6th grade: 239
- 7th and 8th grade: 346
- 9th grade: 255
- 10th grade: 349
- 11th grade: 463
- 12th grade, no diploma: 94
- High school graduate (or equivalency): 4,161
- Less than 1 year of college: 1,107
- Some college more than 1 year, no degree: 2,201
- Associate degree: 1,122
- Bachelor's degree: 5,495
- Master's degree: 1,858
- Professional school degree: 1,879
- Doctorate degree: 1,086
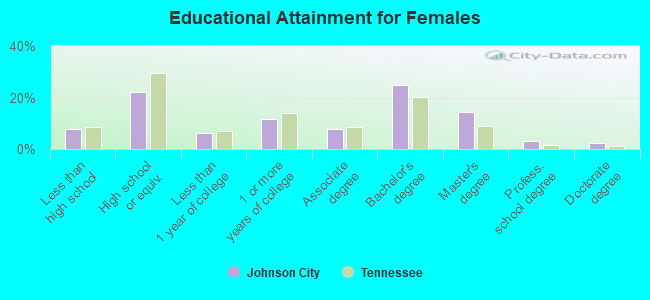
Education attainment for females 25 years and older:
- No schooling: 65
- Nursery to 4th grade: 105
- 5th and 6th grade: 275
- 7th and 8th grade: 94
- 9th grade: 331
- 10th grade: 584
- 11th grade: 273
- 12th grade, no diploma: 312
- High school graduate (or equivalency): 5,786
- Less than 1 year of college: 1,579
- Some college more than 1 year, no degree: 2,992
- Associate degree: 2,043
- Bachelor's degree: 6,429
- Master's degree: 3,725
- Professional school degree: 768
- Doctorate degree: 595
Housing units in structures:
- One, detached: 16,368
- One, attached: 1,386
- Two: 1,814
- 3 or 4: 3,867
- 5 to 9: 2,828
- 10 to 19: 2,788
- 20 to 49: 569
- 50 or more: 1,622
- Mobile homes: 1,836
Median worth of mobile homes: $109,900
Housing units lacking complete kitchen facilities in 2022: 4.1%
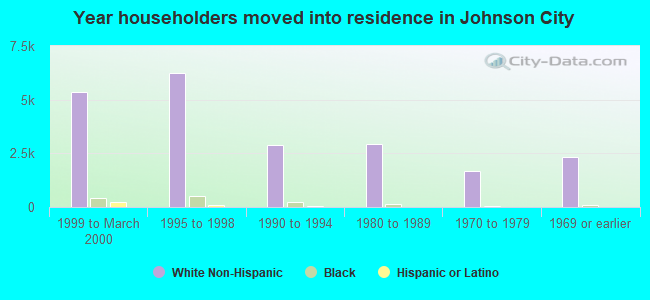
House/condo owner moved in on average 9 years ago
Renter moved in on average 2 years ago
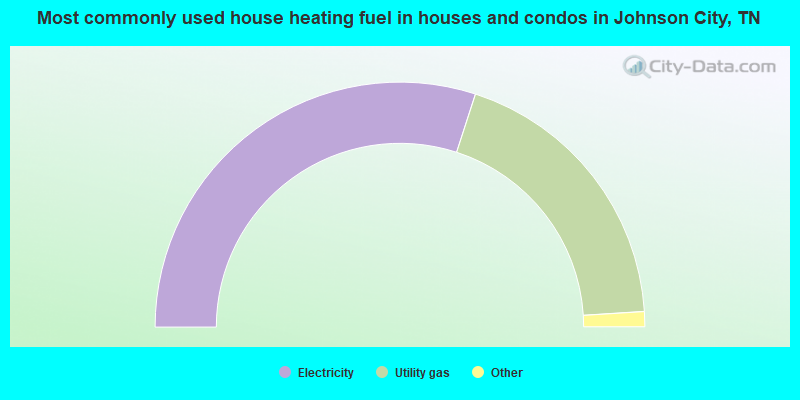
- 60.0%Electricity
- 38.0%Utility gas
- 1.2%Bottled, tank, or LP gas
- 0.2%No fuel used
- 0.2%Other fuel
- 0.2%Wood
- 0.2%Coal or coke
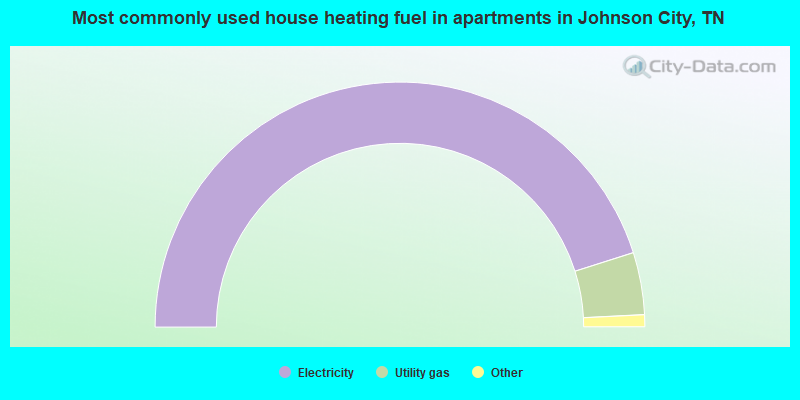
- 90.2%Electricity
- 8.2%Utility gas
- 0.7%Bottled, tank, or LP gas
- 0.4%No fuel used
- 0.2%Coal or coke
- 0.2%Wood
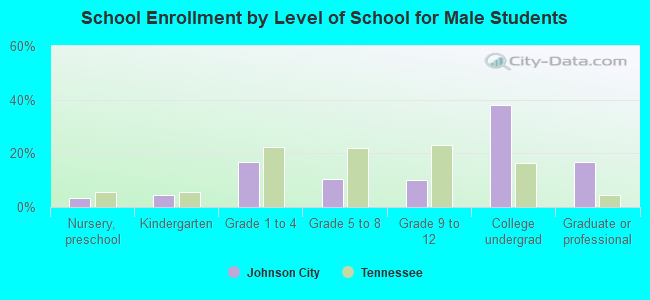
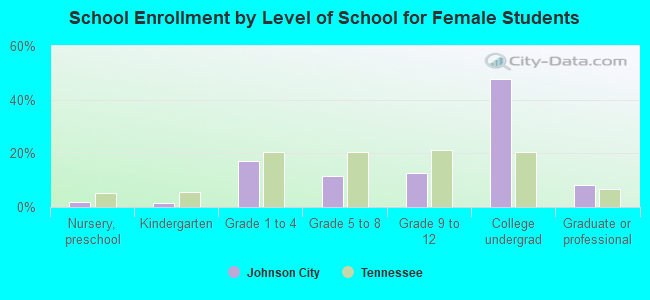
Private vs. public school enrollment:
| Here: | 11.5% |
| Tennessee: | 15.0% |
| Here: | 14.8% |
| Tennessee: | 16.2% |
| Here: | 6.7% |
| Tennessee: | 23.5% |