James Island, SC (South Carolina) Houses and Residents
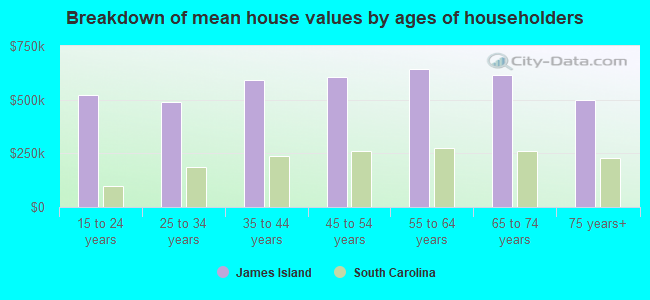
| James Island: | $557,292 |
| South Carolina: | $254,600 |
Total population: 37,514 (Urban population: 33,147, Rural population: 725 (8 farm, 717 nonfarm))
Houses: 15,523 (14,295 occupied: 10,262 owner occupied, 4,033 renter occupied)
| % of renters here: | 28% |
| State: | 28% |
Housing density: 368 houses/condos per square mile
Median price asked for vacant for-sale houses and condos in 2022 in this county: $781,312.
Median contract rent in 2022: $1,651 (lower quartile is $1,264, upper quartile is over $2,000)
Median rent asked for vacant for-rent units in 2022: $1,952
Median gross rent in James Island, SC in 2022: $1,720
Housing units in James Island with a mortgage: 6,543 (842 second mortgage, 982 home equity loan, 43 both second mortgage and home equity loan)
Houses without a mortgage: 2,697
Compare current foreclosures near James Island, SC:
| Photo | Address | Area | Beds / Baths | Price | Details |
|---|---|---|---|---|---|

|
#1
Hamlin Rd
Mount Pleasant, SC 29466
|
2,371 sq. feet
|
2 baths 4 beds |
$475,000
|
show details |

|
#2
Wood Ave
Charleston, SC 29414
|
1,475 sq. feet
|
1 baths 2 beds |
show details | |

|
#3
Barnes Dr
Johns Island, SC 29455
|
1,125 sq. feet
|
1 baths 3 beds |
show details | |

|
#4
Dillard Dr
Goose Creek, SC 29445
|
1,364 sq. feet
|
2 baths 3 beds |
show details | |

|
#5
Old London
Charleston, SC 29406
|
1,978 sq. feet
|
2 baths 4 beds |
show details | |

|
#6
Martin Luther King Blvd
Charleston, SC 29407
|
1,278 sq. feet
|
2 baths 3 beds |
show details | |

|
#7
Premier Ln
Mount Pleasant, SC 29466
|
1,023 sq. feet
|
1 baths 3 beds |
show details | |

|
#8
Red Birch Cir
North Charleston, SC 29418
|
1,728 sq. feet
|
2 baths 4 beds |
show details | |

|
#9
Sabalridge Dr
North Charleston, SC 29418
|
1,784 sq. feet
|
2 baths 4 beds |
show details | |

|
#10
Capri Dr
Charleston, SC 29407
|
2,181 sq. feet
|
4 baths 4 beds |
show details |
| Photo | Address | Area | Beds / Baths | Price | Details |
|---|---|---|---|---|---|

|
#11
Cutchin Ct
Charleston, SC 29414
|
3,772 sq. feet
|
3 baths 3 beds |
show details | |

|
#12
Mosstree Rd
North Charleston, SC 29405
|
2,020 sq. feet
|
2 baths 3 beds |
show details | |

|
#13
Fort Johnson Rd
Charleston, SC 29412
|
1,856 sq. feet
|
2 baths 4 beds |
show details | |

|
#14
Brigadoon Pl
Charleston, SC 29414
|
3,024 sq. feet
|
3 baths 4 beds |
show details | |

|
#15
Southside Dr
North Charleston, SC 29418
|
1,345 sq. feet
|
2 baths 3 beds |
show details | |

|
#16
Elba Dr
North Charleston, SC 29418
|
1,251 sq. feet
|
2 baths 3 beds |
show details | |

|
#17
Elba Dr
North Charleston, SC 29418
|
1,251 sq. feet
|
2 baths 3 beds |
show details | |

|
#18
Gaillard Ln
North Charleston, SC 29405
|
1,247 sq. feet
|
1 baths 3 beds |
show details | |

|
#19
Westview St
North Charleston, SC 29418
|
1,284 sq. feet
|
2 baths 3 beds |
show details | |

|
#20
Little Smith Rd
Wadmalaw Island, SC 29487
|
2,536 sq. feet
|
3 baths 4 beds |
show details |
| Photo | Address | Area | Beds / Baths | Price | Details |
|---|---|---|---|---|---|

|
#21
Darcy Ct
Charleston, SC 29414
|
1,513 sq. feet
|
2 baths 3 beds |
show details | |

|
#22
Ventura Pl
Mount Pleasant, SC 29464
|
1,660 sq. feet
|
2 baths 2 beds |
show details | |

|
#23
Morse Ave
Johns Island, SC 29455
|
1,066 sq. feet
|
1 baths 3 beds |
show details | |

|
#24
Fort Johnson Rd
Charleston, SC 29412
|
1,288 sq. feet
|
3 baths 6 beds |
show details | |

|
#25
Glenkirk Dr
Charleston, SC 29414
|
2,225 sq. feet
|
2 baths 4 beds |
show details | |

|
#26
Williams Ave
North Charleston, SC 29405
|
1,108 sq. feet
|
1 baths 3 beds |
show details | |

|
#27
Toura Ln
Charleston, SC 29414
|
1,724 sq. feet
|
2 baths 3 beds |
show details | |

|
#28
James Bay Rd
Johns Island, SC 29455
|
2,319 sq. feet
|
1 baths 3 beds |
show details | |

|
#29
Paran Oaks Dr
Charleston, SC 29414
|
2,804 sq. feet
|
2 baths 5 beds |
show details | |

|
#30
Highgate Ct
North Charleston, SC 29418
|
1,237 sq. feet
|
1 baths 2 beds |
show details |
| Photo | Address | Area | Beds / Baths | Price | Details |
|---|---|---|---|---|---|

|
#31
Gaynor Ave
North Charleston, SC 29405
|
716 sq. feet
|
1 baths 2 beds |
show details | |

|
#32
Arant St
North Charleston, SC 29405
|
1,148 sq. feet
|
1 baths 2 beds |
show details | |

|
#33
Par 25
Charleston, SC 29414
|
1,500 sq. feet
|
2 baths 3 beds |
show details | |

|
#34
Alston Rd
Mount Pleasant, SC 29464
|
883 sq. feet
|
1 baths 2 beds |
show details | |

|
#35
Abraham Ave
North Charleston, SC 29405
|
1,096 sq. feet
|
1 baths 2 beds |
show details | |

|
#36
Hainsworth Dr
Charleston, SC 29414
|
1,554 sq. feet
|
2 baths 3 beds |
show details | |

|
#37
S Shirley Dr
North Charleston, SC 29418
|
1,170 sq. feet
|
1 baths 2 beds |
show details | |

|
#38
Marilyn Dr
North Charleston, SC 29418
|
1,512 sq. feet
|
1 baths 3 beds |
show details | |

|
#39
Twelve Oak Dr
Charleston, SC 29414
|
2,190 sq. feet
|
2 baths 4 beds |
show details | |

|
#40
Mcroy St
North Charleston, SC 29418
|
1,892 sq. feet
|
2 baths 3 beds |
show details |
| Photo | Address | Area | Beds / Baths | Price | Details |
|---|---|---|---|---|---|

|
#41
E Crossing Ln
Mount Pleasant, SC 29466
|
1,277 sq. feet
|
2 baths 3 beds |
show details | |

|
#42
Fair Spring Dr
Charleston, SC 29414
|
3,238 sq. feet
|
3 baths 4 beds |
show details | |

|
#43
Main Rd
Johns Island, SC 29455
|
1,372 sq. feet
|
2 baths 4 beds |
show details | |

|
#44
Sanders Rd
Charleston, SC 29414
|
1,792 sq. feet
|
2 baths 3 beds |
show details | |

|
#45
Mathis Ferry Rd # C
Mount Pleasant, SC 29464
|
1,155 sq. feet
|
1 baths 3 beds |
show details | |

|
#46
Cambridge Ave
North Charleston, SC 29405
|
924 sq. feet
|
1 baths 3 beds |
show details | |

|
#47
Burton Ln
North Charleston, SC 29405
|
1,228 sq. feet
|
2 baths 3 beds |
show details | |

|
#48
Island Estates Dr
Johns Island, SC 29455
|
1,120 sq. feet
|
2 baths 3 beds |
show details | |

|
#49
Burton Ln
North Charleston, SC 29405
|
936 sq. feet
|
1 baths 3 beds |
show details | |

|
Check over 1 million property listings on Foreclosure.com!
|
browse all offers | |||


Household type by relationship:
Households: 339,878- In family households: 260,825 (52,732 male householders, 32,960 female householders)
58,381 spouses, 86,929 children (81,693 natural, 2,087 adopted, 3,149 stepchildren), 9,294 grandchildren, 4,579 brothers or sisters, 2,489 parents, foster children, 4,937 other relatives, 7,104 non-relatives
- In nonfamily households: 79,053 (26,920 male householders (18,842 living alone)), 31,697 female householders (24,643 living alone)), 20,436 nonrelatives
- In group quarters: 10,331 (3,018 institutionalized population)
39,884 married couples with children.
23,388 single-parent households (3,063 men, 20,325 women).
95.0% of residents of James Island speak English at home.
2.0% of residents speak Spanish at home (70% speak English very well, 21% speak English well, 8% speak English not well).
2.5% of residents speak other Indo-European language at home (81% speak English very well, 9% speak English well, 9% speak English not well, 1% don't speak English at all).
0.4% of residents speak Asian or Pacific Island language at home (27% speak English very well, 55% speak English well, 18% speak English not well).
0.1% of residents speak other language at home (100% speak English very well).
Foreign born population: 1,775 (3.9%)
(63.5% of them are naturalized citizens)
| Here: | 6.7 |
| State: | 6.4 |
| Here: | 4.1 |
| State: | 4.5 |
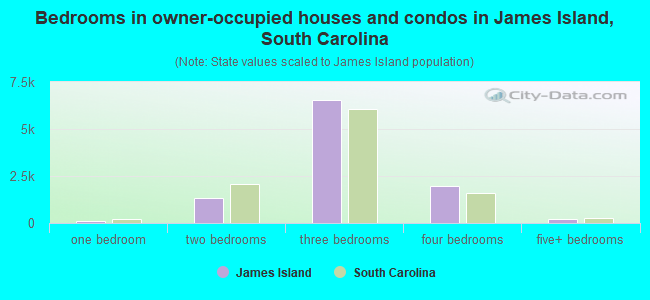
- Bedrooms in owner-occupied houses and condos in James Island, South Carolina
- 8no bedroom
- 1191 bedroom
- 1,3472 bedrooms
- 6,5583 bedrooms
- 1,9944 bedrooms
- 2365+ bedrooms
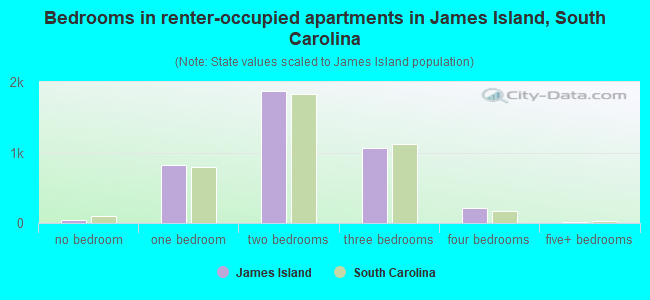
- Bedrooms in renter-occupied apartments in James Island, South Carolina
- 43no bedroom
- 8211 bedroom
- 1,8732 bedrooms
- 1,0643 bedrooms
- 2164 bedrooms
- 165+ bedrooms
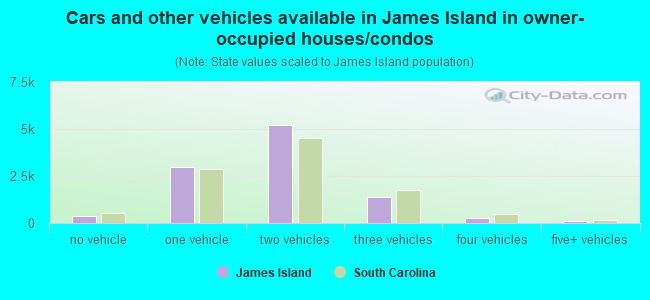
- Cars and other vehicles available in James Island in owner-occupied houses/condos
- 353no vehicle
- 2,9551 vehicle
- 5,2362 vehicles
- 1,3723 vehicles
- 2644 vehicles
- 825+ vehicles
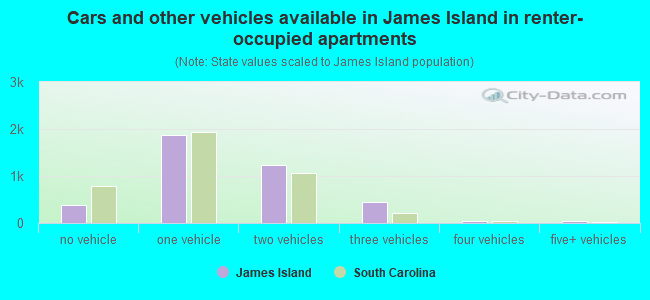
- Cars and other vehicles available in James Island in renter-occupied apartments
- 387no vehicle
- 1,8671 vehicle
- 1,2252 vehicles
- 4553 vehicles
- 474 vehicles
- 525+ vehicles
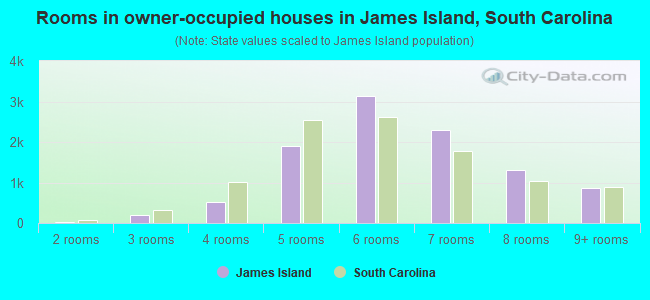
- Rooms in owner-occupied houses in James Island, South Carolina
- 01 room
- 292 rooms
- 2053 rooms
- 5284 rooms
- 1,9045 rooms
- 3,1376 rooms
- 2,2947 rooms
- 1,3088 rooms
- 8579+ rooms
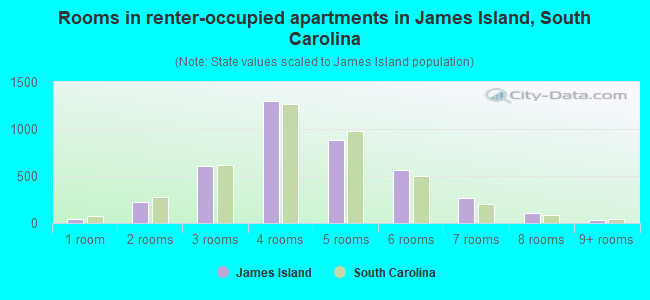
- Rooms in renter-occupied apartments in James Island, South Carolina
- 431 room
- 2232 rooms
- 6053 rooms
- 1,2974 rooms
- 8885 rooms
- 5656 rooms
- 2707 rooms
- 1058 rooms
- 379+ rooms
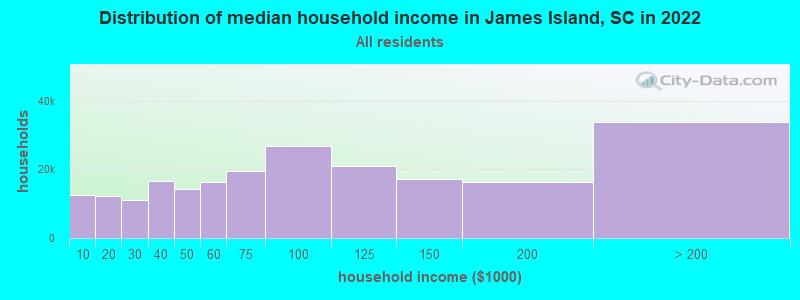
James Island, SC household income distribution

- 12,441Less than $10,000
- 12,341$10,000 to $19,999
- 11,116$20,000 to $29,999
- 16,541$30,000 to $39,999
- 14,203$40,000 to $49,999
- 16,394$50,000 to $59,999
- 19,537$60,000 to $74,999
- 26,676$75,000 to $99,999
- 20,908$100,000 to $124,999
- 17,282$125,000 to $149,999
- 16,359$150,000 to $199,999
- 33,813$200,000 or more
Percentage of workers working in this county: 91.7%
Number of people working at home: 4,762 (17.5% of all workers)
Travel time to work (commute)
- Less than 5 minutes: 376
- 5 to 9 minutes: 1,501
- 10 to 14 minutes: 2,946
- 15 to 19 minutes: 3,785
- 20 to 24 minutes: 2,999
- 25 to 29 minutes: 1,170
- 30 to 34 minutes: 2,552
- 35 to 39 minutes: 376
- 40 to 44 minutes: 369
- 45 to 59 minutes: 609
- 60 to 89 minutes: 329
- 90 or more minutes: 236
Means of transportation to work:
- Drove a car alone: 14,768 (83.2%)
- Carpooled: 2,052 (11.6%)
- Bus or trolley bus: 37 (0.2%)
- Subway or elevated: 15 (0.1%)
- Taxi: 31 (0.2%)
- Motorcycle: 23 (0.1%)
- Bicycle: 57 (0.3%)
- Walked: 120 (0.7%)
- Other means: 145 (0.8%)
- Worked at home: 504 (2.8%)
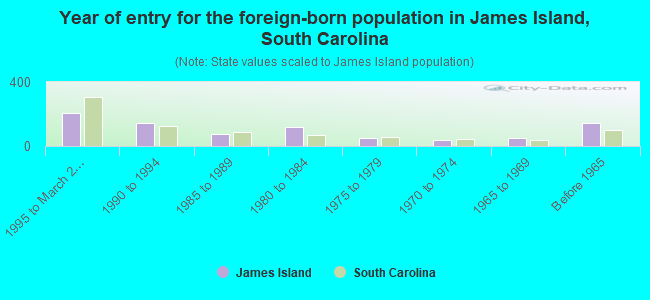
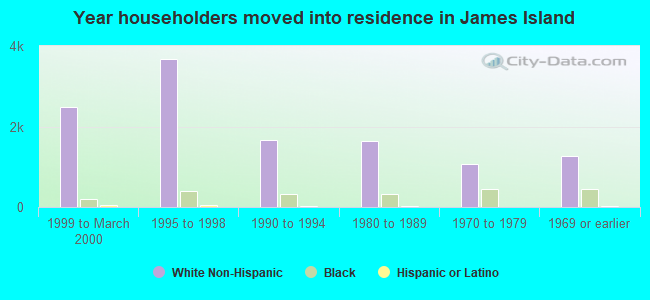
- Year of entry for the foreign-born population in James Island, South Carolina
- 2081995 to March 2000
- 1451990 to 1994
- 781985 to 1989
- 1161980 to 1984
- 521975 to 1979
- 361970 to 1974
- 531965 to 1969
- 141Before 1965
Most common places of birth for foreign-born residents (%):
| James Island: | 13.4% (111) |
| South Carolina: | 5.9% (6,890) |
| James Island: | 12.4% (103) |
| South Carolina: | 6.8% (7,873) |
| James Island: | 7.4% (61) |
| South Carolina: | 4.8% (5,512) |
| James Island: | 5.9% (49) |
| South Carolina: | 1.8% (2,125) |
| James Island: | 5.4% (45) |
| South Carolina: | 1.3% (1,526) |
| James Island: | 4.8% (40) |
| South Carolina: | 0.8% (977) |
| James Island: | 4.5% (37) |
| South Carolina: | 0.3% (399) |
| James Island: | 4.2% (35) |
| South Carolina: | 0.4% (519) |
| James Island: | 3.6% (30) |
| South Carolina: | 0.7% (777) |
| James Island: | 3.0% (25) |
| South Carolina: | 0.5% (540) |
| James Island: | 2.9% (24) |
| South Carolina: | 1.4% (1,599) |
| James Island: | 2.5% (21) |
| South Carolina: | 2.7% (3,098) |
| James Island: | 2.4% (20) |
| South Carolina: | 1.0% (1,130) |
| James Island: | 2.4% (20) |
| South Carolina: | 0.5% (628) |
| James Island: | 2.3% (19) |
| South Carolina: | 0.6% (662) |
| James Island: | 2.2% (18) |
| South Carolina: | 4.4% (5,108) |
| James Island: | 2.2% (18) |
| South Carolina: | 0.3% (292) |
| James Island: | 2.2% (18) |
| South Carolina: | 0.4% (413) |
| James Island: | 2.1% (17) |
| South Carolina: | 0.3% (333) |
| James Island: | 1.9% (16) |
| South Carolina: | 0.8% (875) |
Place of birth for U.S.-born residents:
- This state: 18,318
- Other state: 14,399
- Northeast: 4,060
- Midwest: 2,291
- South: 7,315
- West: 733
56% of James Island residents lived in the same house 5 years ago.
Out of people who lived in different houses, 55% lived in this county.
Out of people who lived in different counties, 31% lived in South Carolina.
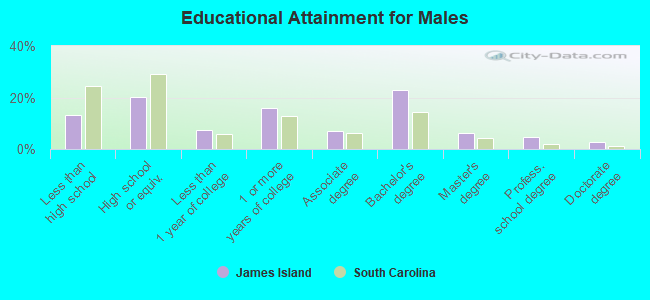
Education attainment for males 25 years and older:
- No schooling: 100
- Nursery to 4th grade: 54
- 5th and 6th grade: 84
- 7th and 8th grade: 224
- 9th grade: 194
- 10th grade: 343
- 11th grade: 219
- 12th grade, no diploma: 234
- High school graduate (or equivalency): 2,252
- Less than 1 year of college: 810
- Some college more than 1 year, no degree: 1,788
- Associate degree: 765
- Bachelor's degree: 2,559
- Master's degree: 691
- Professional school degree: 540
- Doctorate degree: 305
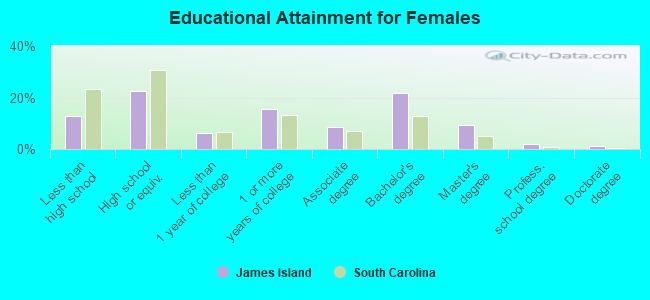
Education attainment for females 25 years and older:
- No schooling: 52
- Nursery to 4th grade: 80
- 5th and 6th grade: 60
- 7th and 8th grade: 317
- 9th grade: 203
- 10th grade: 229
- 11th grade: 299
- 12th grade, no diploma: 383
- High school graduate (or equivalency): 2,849
- Less than 1 year of college: 771
- Some college more than 1 year, no degree: 1,963
- Associate degree: 1,100
- Bachelor's degree: 2,774
- Master's degree: 1,185
- Professional school degree: 244
- Doctorate degree: 140


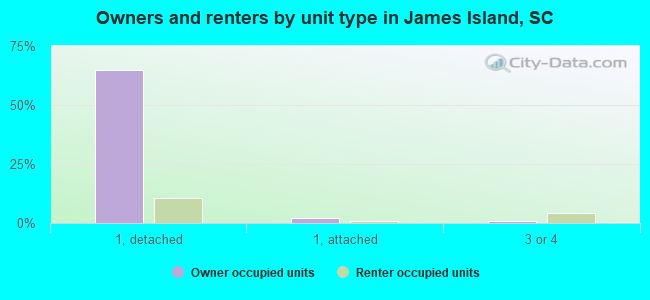
Housing units in structures:
- One, detached: 11,562
- One, attached: 483
- Two: 574
- 3 or 4: 852
- 5 to 9: 638
- 10 to 19: 380
- 20 to 49: 291
- 50 or more: 384
- Mobile homes: 349
- Boats, RVs, vans, etc.: 10
Median worth of mobile homes: $163,578
Housing units lacking complete kitchen facilities: 0.9%
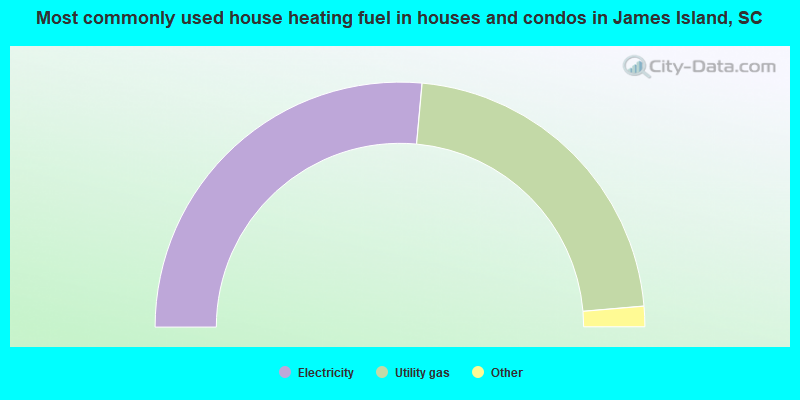
- 52.9%Electricity
- 44.4%Utility gas
- 1.5%Fuel oil, kerosene, etc.
- 0.9%Bottled, tank, or LP gas
- 0.3%Wood
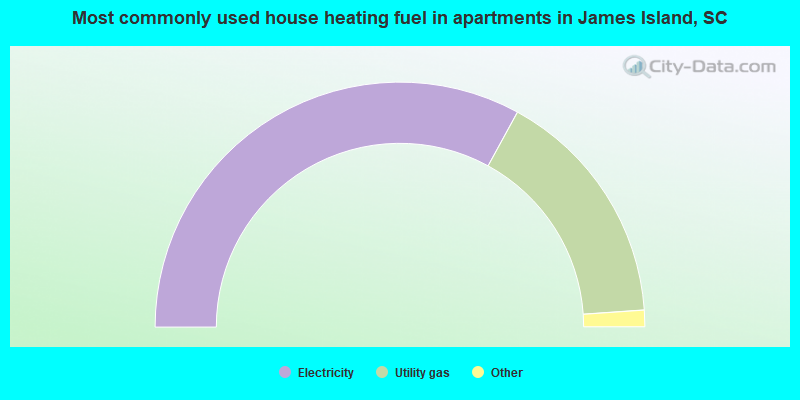
- 66.0%Electricity
- 31.9%Utility gas
- 0.8%Bottled, tank, or LP gas
- 0.7%Fuel oil, kerosene, etc.
- 0.4%Wood
- 0.3%No fuel used
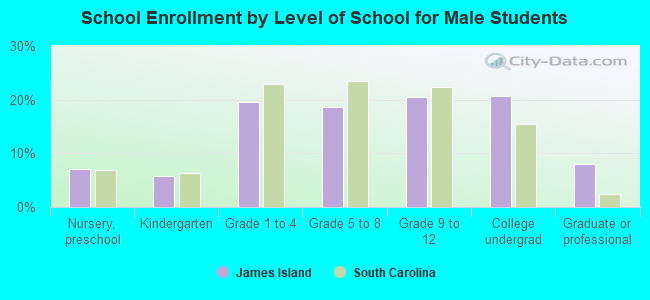
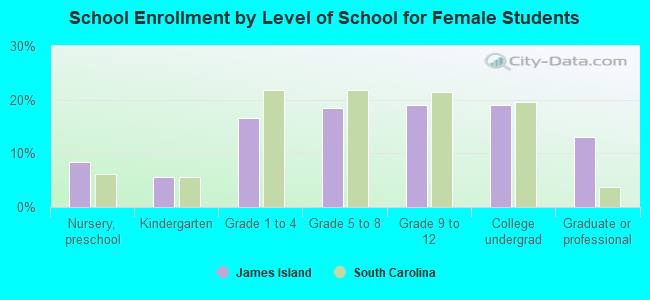
Private vs. public school enrollment:
| Here: | 20.4% |
| South Carolina: | 9.2% |
| Here: | 16.4% |
| South Carolina: | 8.1% |
| Here: | 12.8% |
| South Carolina: | 20.3% |