Indianapolis, IN (Indiana) Houses and Residents
Estimated median house or condo value in 2022: $216,700 (it was $96,600 in 2000 )
Indianapolis:
$216,700Indiana:
$208,700
Lower value quartile - upper value quartile: $144,500 - $309,500Mean price in 2022: Detached houses: $259,483 Here:
$259,483State:
$257,916
Townhouses or other attached units: $202,202 Here:
$202,202State:
$224,114
In 2-unit structures: $146,803 Here:
$146,803State:
$175,375
In 3-to-4-unit structures: $148,136 Here:
$148,136State:
$151,116
In 5-or-more-unit structures: $286,392 Here:
$286,392State:
$200,844
Mobile homes: $27,532 Here:
$27,532State:
$67,116
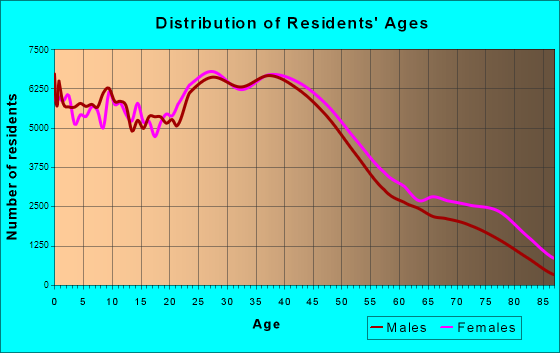
Total population: 848,788 (Urban population: 774,270, Rural population: 8,144 (273 farm, 7,871 nonfarm ))
Houses: 401,713 (367,073 occupied: 207,936 owner occupied, 159,137 renter occupied )
% of renters here:
43%State:
29%
Housing density: 1,111 houses/condos per square mile
Median price asked for vacant for-sale houses and condos in 2022: $194,978.
Median contract rent in 2022: $846 (lower quartile is $682, upper quartile is $1,124)
Median rent asked for vacant for-rent units in 2022: $1,120
Median gross rent in Indianapolis, IN in 2022: $1,039
Housing units in Indianapolis with a mortgage: 143,113 (12,112 second mortgage, 796 home equity loan, 9,882 both second mortgage and home equity loan )Houses without a mortgage: 2,781
Median household income for houses/condos with a mortgage: $95,099
Median household income for apartments without a mortgage: $66,441
Median monthly housing costs: $1,063
Data:
Median house or condo value ($)
Median house or condo value ($ change since 2000)
Median house or condo value ($) - White
Median house or condo value ($) - Black or African American
Median house or condo value ($) - Asian
Median house or condo value ($) - Hispanic or Latino
Median house or condo value ($) - American Indian and Alaska Native
Median house or condo value ($) - Multirace
Median house or condo value ($) - Other Race
Median price asked for mobile homes ($)
Household density (households per square mile)
Mean house or condo value by units in structure - 1, detached ($)
Mean house or condo value by units in structure - 1, attached ($)
Mean house or condo value by units in structure - 2 ($)
Mean house or condo value by units in structure by units in structure - 3 or 4 ($)
Mean house or condo value by units in structure - 5 or more ($)
Mean house or condo value by units in structure - Boat, RV, van, etc. ($)
Mean house or condo value by units in structure - Mobile home ($)
Median contract rent ($)
Median contract rent - Lower quartile ($)
Median contract rent - Upper quartile ($)
Median gross rent ($)
Urban houses (%)
Rural houses (%)
Houses occupied (%)
Houses occupied (% change since 2000)
Houses owner occupied (%)
Houses owner occupied (% change since 2000)
Houses renter occupied (%)
Houses renter occupied (% change since 2000)
Vacant housing units - For rent (%)
Vacant housing units - For rent (% change since 2000)
Vacant housing units - For sale only (%)
Vacant housing units - For sale only (% change since 2000)
Vacant housing units - Rented or sold, not occupied (%)
Vacant housing units - Rented or sold, not occupied (% change since 2000)
Vacant housing units - For seasonal, recreational, or occasional use (%)
Vacant housing units - For seasonal, recreational, or occasional use (% change since 2000)
Vacant housing units - For migrant workers (%)
Vacant housing units - For migrant workers (% change since 2000)
Vacant housing units - Other vacant (%)
Vacant housing units - Other vacant (% change since 2000)
Median monthly housing costs ($)
Median household income for houses/condos with a mortgage ($)
Median household income for houses/condos without a mortgage ($)
Median household income ($)
Median household income ($) - White
Median household income ($) - Black or African American
Median household income ($) - Asian
Median household income ($) - Hispanic or Latino
Median household income ($) - American Indian and Alaska Native
Median household income ($) - Multirace
Median household income ($) - Other Race
Mortgage status - with mortgage (%)
Mortgage status - with second mortgage (%)
Mortgage status - with home equity loan (%)
Mortgage status - with both second mortgage and home equity loan (%)
Mortgage status - without a mortgage (%)
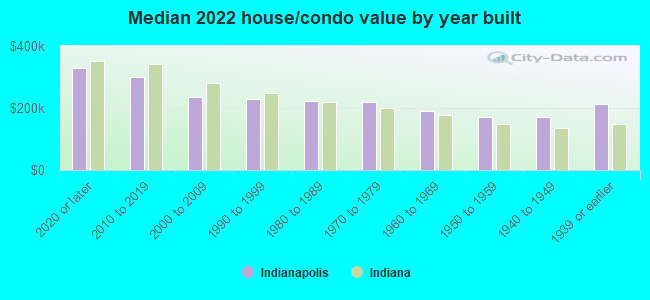
Median year house/condo built
Median year apartment built
Household type by relationship - Male householder living alone (%)
Household type by relationship - Male householder not living alone (%)
Household type by relationship - Female householder living alone (%)
Household type by relationship - Female householder not living alone (%)
Household type by relationship - Opposite-Sex spouse (%)
Household type by relationship - Same-Sex spouse (%)
Household type by relationship - Opposite-Sex unmarried partner (%)
Household type by relationship - Same-Sex unmarried partner (%)
Household type by relationship - In group quarters (%)
Size of family households - 2-person household (%)
Size of family households - 3-person household (%)
Size of family households - 4-person household (%)
Size of family households - 5-person household (%)
Size of family households - 6-person household (%)
Size of family households - 7-or-more-person household (%)
Size of nonfamily households - 1-person household (%)
Size of nonfamily households - 2-person household (%)
Size of nonfamily households - 3-person household (%)
Size of nonfamily households - 4-person household (%)
Size of nonfamily households - 5-person household (%)
Size of nonfamily households - 6-person household (%)
Size of nonfamily households - 7-or-moreperson household (%)
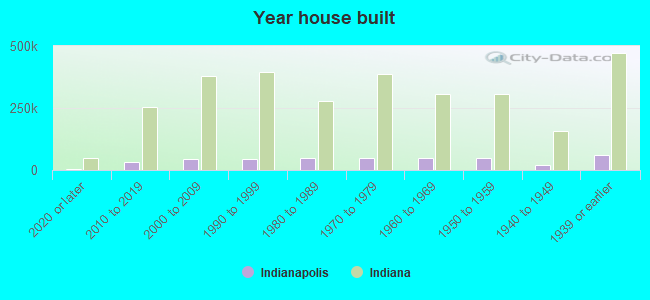
Year house built - Built 2010 or later (%)
Year house built - Built 2000 to 2009 (%)
Year house built - Built 1990 to 1999 (%)
Year house built - Built 1980 to 1989 (%)
Year house built - Built 1970 to 1979 (%)
Year house built - Built 1960 to 1969 (%)
Year house built - Built 1950 to 1959 (%)
Year house built - Built 1940 to 1949 (%)
Year house built - Built 1939 or earlier (%)
Median number of rooms in houses and condos
Median number of rooms in apartments
Median number of bedrooms in owner occupied houses
Mean number of bedrooms in owner occupied houses
Median number of bedrooms in renter occupied houses
Mean number of bedrooms in renter occupied houses
Median number of vehichles in owner occupied houses
Mean number of vehichles in owner occupied houses
Median number of vehichles in renter occupied houses
Mean number of vehichles in renter occupied houses
Rooms in owner-occupied houses - 1 room (%)
Rooms in owner-occupied houses - 2 rooms (%)
Rooms in owner-occupied houses - 3 rooms (%)
Rooms in owner-occupied houses - 4 rooms (%)
Rooms in owner-occupied houses - 5 rooms (%)
Rooms in owner-occupied houses - 6 rooms (%)
Rooms in owner-occupied houses - 7 rooms (%)
Rooms in owner-occupied houses - 8 rooms (%)
Rooms in owner-occupied houses - 9+ rooms (%)
Rooms in renter-occupied houses - 1 room (%)
Rooms in renter-occupied houses - 2 rooms (%)
Rooms in renter-occupied houses - 3 rooms (%)
Rooms in renter-occupied houses - 4 rooms (%)
Rooms in renter-occupied houses - 5 rooms (%)
Rooms in renter-occupied houses - 6 rooms (%)
Rooms in renter-occupied houses - 7 rooms (%)
Rooms in renter-occupied houses - 8 rooms (%)
Rooms in renter-occupied houses - 9+ rooms (%)
Bedrooms in owner-occupied houses - no bedrooms (%)
Bedrooms in owner-occupied houses - 1 bedroom (%)
Bedrooms in owner-occupied houses - 2 bedrooms (%)
Bedrooms in owner-occupied houses - 3 bedrooms (%)
Bedrooms in owner-occupied houses - 4 bedrooms (%)
Bedrooms in owner-occupied houses - 5+ bedrooms (%)
Bedrooms in renter-occupied houses - no bedrooms (%)
Bedrooms in renter-occupied houses - 1 bedroom (%)
Bedrooms in renter-occupied houses - 2 bedrooms (%)
Bedrooms in renter-occupied houses - 3 bedrooms (%)
Bedrooms in renter-occupied houses - 4 bedrooms (%)
Bedrooms in renter-occupied houses - 5+ bedrooms (%)
Vehicles available in owner-occupied houses - no vehicle available (%)
Vehicles available in owner-occupied houses - 1 vehicle available(%)
Vehicles available in owner-occupied houses - 2 Vehicles available (%)
Vehicles available in owner-occupied houses - 3 Vehicles available (%)
Vehicles available in owner-occupied houses - 4 Vehicles available (%)
Vehicles available in owner-occupied houses - 5+ Vehicles available (%)
Vehicles available in renter-occupied houses - no vehicle available (%)
Vehicles available in renter-occupied houses - 1 vehicle available (%)
Vehicles available in renter-occupied houses - 2 Vehicles available (%)
Vehicles available in renter-occupied houses - 3 Vehicles available (%)
Vehicles available in renter-occupied houses - 4 Vehicles available (%)
Vehicles available in renter-occupied houses - 5+ Vehicles available (%)
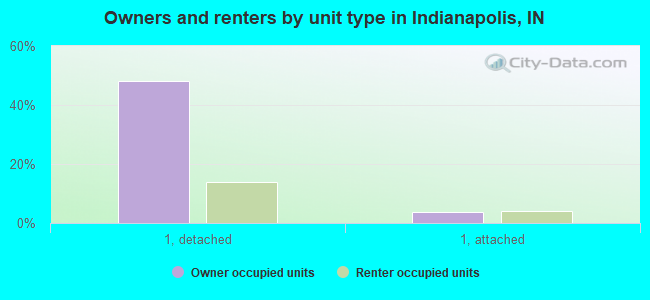
Housing units in structures - 1, detached (%)
Housing units in structures - 1, attached (%)
Housing units in structures - 2 (%)
Housing units in structures - 3 or 4 (%)
Housing units in structures - 5 to 9 (%)
Housing units in structures - 10 to 19 (%)
Housing units in structures - 20 to 49 (%)
Housing units in structures - 50 or more (%)
Housing units in structures - Mobile home (%)
Housing units in structures - Boat, RV, van, etc. (%)
Housing units in structures - Owners - 1, detached (%)
Housing units in structures - Owners - 1, attached (%)
Housing units in structures - Owners - 2 (%)
Housing units in structures - Owners - 3 or 4 (%)
Housing units in structures - Owners - 5 to 9 (%)
Housing units in structures - Owners - 10 to 19 (%)
Housing units in structures - Owners - 20 to 49 (%)
Housing units in structures - Owners - 50 or more (%)
Housing units in structures - Owners - Mobile home (%)
Housing units in structures - Owners - Boat, RV, van, etc. (%)
Housing units in structures - Renters - 1, detached (%)
Housing units in structures - Renters - 1, attached (%)
Housing units in structures - Renters - 2 (%)
Housing units in structures - Renters - 3 or 4 (%)
Housing units in structures - Renters - 5 to 9 (%)
Housing units in structures - Renters - 10 to 19 (%)
Housing units in structures - Renters - 20 to 49 (%)
Housing units in structures - Renters - 50 or more (%)
Housing units in structures - Renters - Mobile home (%)
Housing units in structures - Renters - Boat, RV, van, etc. (%)
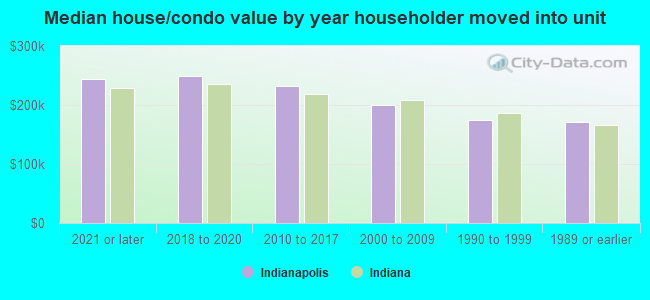
House/condo owner moved in on average (years ago)
Renter moved in on average (years ago)
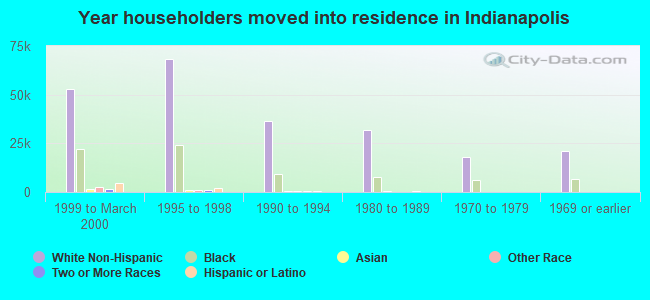
Year householder moved into unit - Moved in 1999 to March 2000 (%)
Year householder moved into unit - Moved in 1999 to March 2000 (%) - White
Year householder moved into unit - Moved in 1999 to March 2000 (%) - Black or African American
Year householder moved into unit - Moved in 1999 to March 2000 (%) - Asian
Year householder moved into unit - Moved in 1999 to March 2000 (%) - Hispanic or Latino
Year householder moved into unit - Moved in 1999 to March 2000 (%) - American Indian and Alaska Native
Year householder moved into unit - Moved in 1999 to March 2000 (%) - Multirace
Year householder moved into unit - Moved in 1999 to March 2000 (%) - Other Race
Year householder moved into unit - Moved in 1995 to 1998 (%)
Year householder moved into unit - Moved in 1995 to 1998 (%) - White
Year householder moved into unit - Moved in 1995 to 1998 (%) - Black or African American
Year householder moved into unit - Moved in 1995 to 1998 (%) - Asian
Year householder moved into unit - Moved in 1995 to 1998 (%) - Hispanic or Latino
Year householder moved into unit - Moved in 1995 to 1998 (%) - American Indian and Alaska Native
Year householder moved into unit - Moved in 1995 to 1998 (%) - Multirace
Year householder moved into unit - Moved in 1995 to 1998 (%) - Other Race
Year householder moved into unit - Moved in 1990 to 1994 (%)
Year householder moved into unit - Moved in 1990 to 1994 (%) - White
Year householder moved into unit - Moved in 1990 to 1994 (%) - Black or African American
Year householder moved into unit - Moved in 1990 to 1994 (%) - Asian
Year householder moved into unit - Moved in 1990 to 1994 (%) - Hispanic or Latino
Year householder moved into unit - Moved in 1990 to 1994 (%) - American Indian and Alaska Native
Year householder moved into unit - Moved in 1990 to 1994 (%) - Multirace
Year householder moved into unit - Moved in 1990 to 1994 (%) - Other Race
Year householder moved into unit - Moved in 1980 to 1989 (%)
Year householder moved into unit - Moved in 1980 to 1989 (%) - White
Year householder moved into unit - Moved in 1980 to 1989 (%) - Black or African American
Year householder moved into unit - Moved in 1980 to 1989 (%) - Asian
Year householder moved into unit - Moved in 1980 to 1989 (%) - Hispanic or Latino
Year householder moved into unit - Moved in 1980 to 1989 (%) - American Indian and Alaska Native
Year householder moved into unit - Moved in 1980 to 1989 (%) - Multirace
Year householder moved into unit - Moved in 1980 to 1989 (%) - Other Race
Year householder moved into unit - Moved in 1970 to 1979 (%)
Year householder moved into unit - Moved in 1970 to 1979 (%) - White
Year householder moved into unit - Moved in 1970 to 1979 (%) - Black or African American
Year householder moved into unit - Moved in 1970 to 1979 (%) - Asian
Year householder moved into unit - Moved in 1970 to 1979 (%) - Hispanic or Latino
Year householder moved into unit - Moved in 1970 to 1979 (%) - American Indian and Alaska Native
Year householder moved into unit - Moved in 1970 to 1979 (%) - Multirace
Year householder moved into unit - Moved in 1970 to 1979 (%) - Other Race
Year householder moved into unit - Moved in 1969 or earlier (%)
Year householder moved into unit - Moved in 1969 or earlier (%) - White
Year householder moved into unit - Moved in 1969 or earlier (%) - Black or African American
Year householder moved into unit - Moved in 1969 or earlier (%) - Asian
Year householder moved into unit - Moved in 1969 or earlier (%) - Hispanic or Latino
Year householder moved into unit - Moved in 1969 or earlier (%) - American Indian and Alaska Native
Year householder moved into unit - Moved in 1969 or earlier (%) - Multirace
Year householder moved into unit - Moved in 1969 or earlier (%) - Other Race
Housing units lacking complete plumbing facilities (%)
Housing units lacking complete kitchen facilities (%)
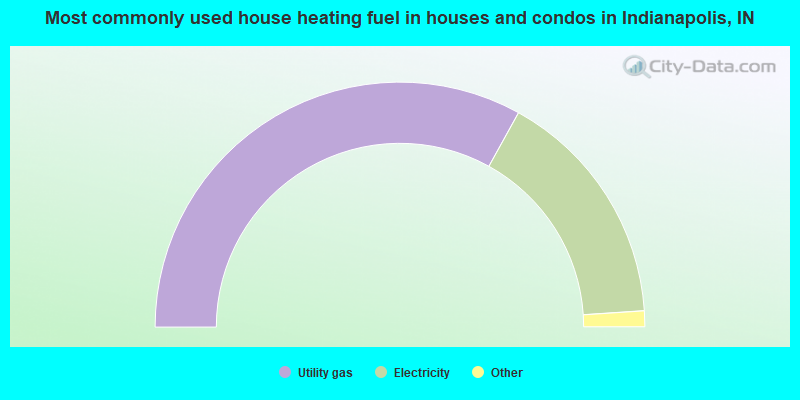
House heating fuel used in houses and condos - Utility gas (%)
House heating fuel used in houses and condos - Bottled, tank, or LP gas (%)
House heating fuel used in houses and condos - Electricity (%)
House heating fuel used in houses and condos - Fuel oil, kerosene, etc. (%)
House heating fuel used in houses and condos - Coal or coke (%)
House heating fuel used in houses and condos - Wood (%)
House heating fuel used in houses and condos - Solar energy (%)
House heating fuel used in houses and condos - Other fuel (%)
House heating fuel used in houses and condos - No fuel used (%)
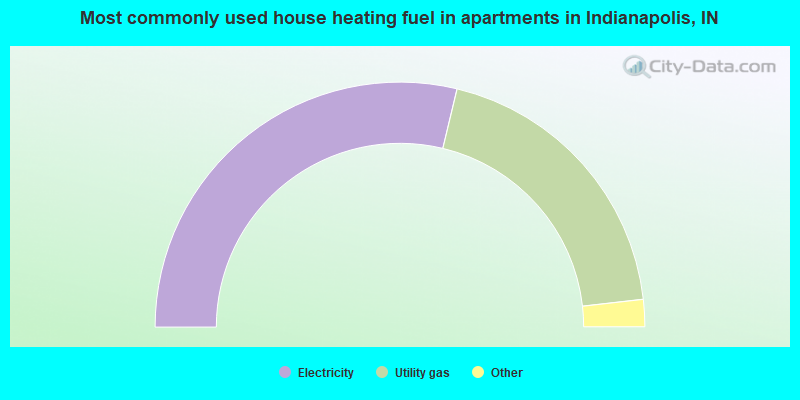
House heating fuel used in apartments - Utility gas (%)
House heating fuel used in apartments - Bottled, tank, or LP gas (%)
House heating fuel used in apartments - Electricity (%)
House heating fuel used in apartments - Fuel oil, kerosene, etc. (%)
House heating fuel used in apartments - Coal or coke (%)
House heating fuel used in apartments - Wood (%)
House heating fuel used in apartments - Solar energy (%)
House heating fuel used in apartments - Other fuel (%)
House heating fuel used in apartments - No fuel used (%)
Latest news about housing in Indianapolis, IN collected exclusively by city-data.com from local newspapers, TV, and radio stations
Median year house/condo built: 1971Median year apartment built: 1979Household type by relationship:
Households: 876,564
Male householders: 172,696 (61,278 living alone ), Female householders: 194,377 (67,290 living alone )136,013 spouses (133,396 opposite-sex spouses ), 30,122 unmarried partners , (28,088 opposite-sex unmarried partners ), 246,153 children (227,026 natural , 6,486 adopted , 12,641 stepchildren ), 20,988 grandchildren , 9,870 brothers or sisters , 12,260 parents , 928 foster children , 13,869 other relatives , 22,971 non-relatives In group quarters: 16,317
Size of family households: 95,418 2-persons , 50,237 3-persons , 32,136 4-persons , 17,426 5-persons , 6,859 6-persons , 5,307 7-or-more-persons .
Size of nonfamily households: 128,568 1-person , 27,286 2-persons , 2,373 3-persons , 610 4-persons , 326 5-persons , 432 6-persons , 95 7-or-more-persons .
118,820 married couples with children. single-parent households (11,254 men , 57,843 women ).
82.7% of residents of Indianapolis speak English at home. of residents speak Spanish at home (50% speak English very well , 19% speak English well , 24% speak English not well , 6% don't speak English at all ).of residents speak other Indo-European language at home (58% speak English very well , 24% speak English well , 10% speak English not well , 8% don't speak English at all ).of residents speak Asian or Pacific Island language at home (50% speak English very well , 24% speak English well , 22% speak English not well , 4% don't speak English at all ).of residents speak other language at home (63% speak English very well , 26% speak English well , 10% speak English not well , 1% don't speak English at all ).
Foreign born population: 106,617 (12.2%)of them are naturalized citizens )
Median number of rooms in houses and condos:
Median number of rooms in apartments
Owner-occupied Renter-occupied
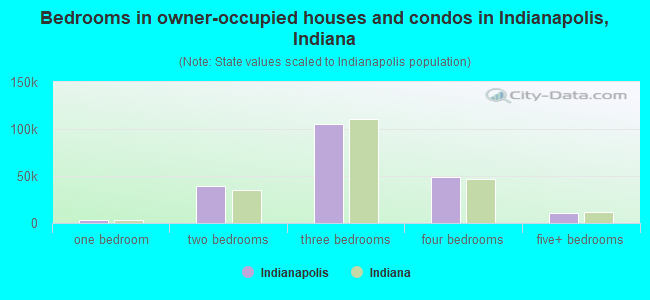
Bedrooms in owner-occupied houses and condos in Indianapolis, Indiana
563 no bedroom 2,735 1 bedroom 39,423 2 bedrooms 105,311 3 bedrooms 49,030 4 bedrooms 10,874 5+ bedrooms
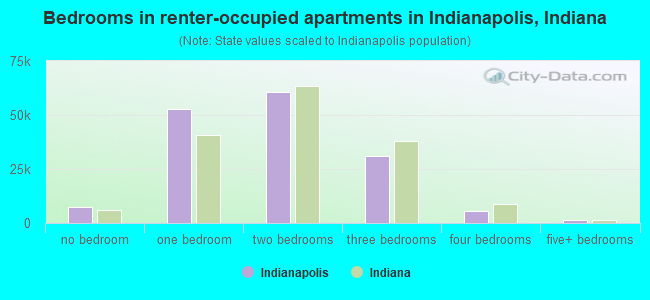
Bedrooms in renter-occupied apartments in Indianapolis, Indiana
7,376 no bedroom 52,866 1 bedroom 60,766 2 bedrooms 31,116 3 bedrooms 5,655 4 bedrooms 1,358 5+ bedrooms
Owner-occupied Renter-occupied
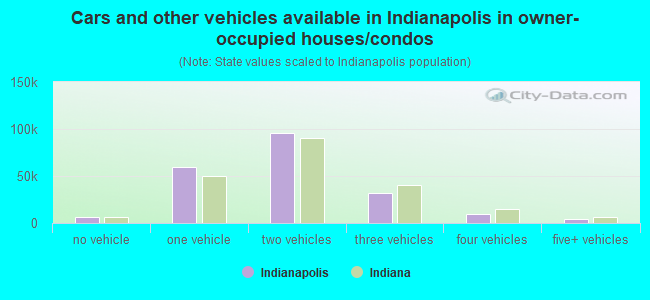
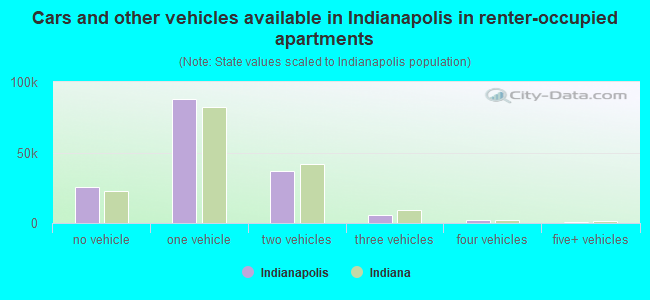
Cars and other vehicles available in Indianapolis in owner-occupied houses/condos
6,525 no vehicle 59,903 1 vehicle 96,119 2 vehicles 32,005 3 vehicles 9,319 4 vehicles 4,065 5+ vehicles
Cars and other vehicles available in Indianapolis in renter-occupied apartments
25,667 no vehicle 88,238 1 vehicle 36,600 2 vehicles 5,676 3 vehicles 2,020 4 vehicles 936 5+ vehicles
Owner-occupied Renter-occupied
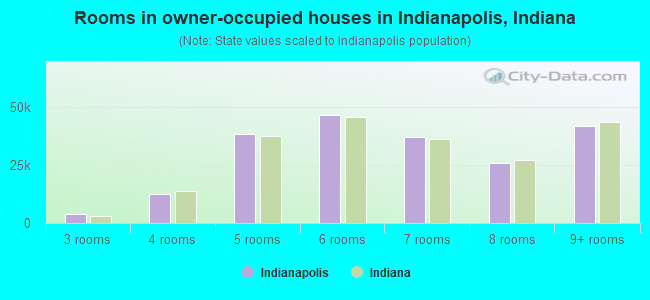
Rooms in owner-occupied houses in Indianapolis, Indiana
386 1 room 183 2 rooms 3,974 3 rooms 12,718 4 rooms 38,651 5 rooms 46,671 6 rooms 37,219 7 rooms 26,132 8 rooms 42,002 9+ rooms
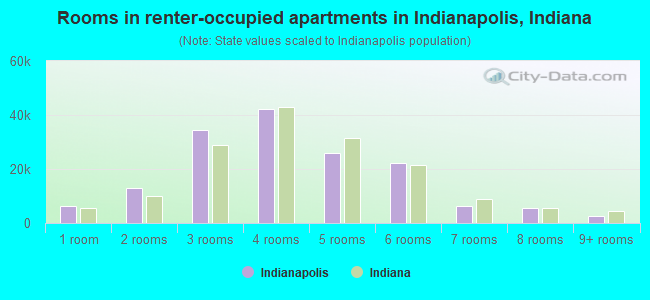
Rooms in renter-occupied apartments in Indianapolis, Indiana
6,406 1 room 12,904 2 rooms 34,533 3 rooms 42,234 4 rooms 25,880 5 rooms 22,323 6 rooms 6,457 7 rooms 5,740 8 rooms 2,660 9+ rooms
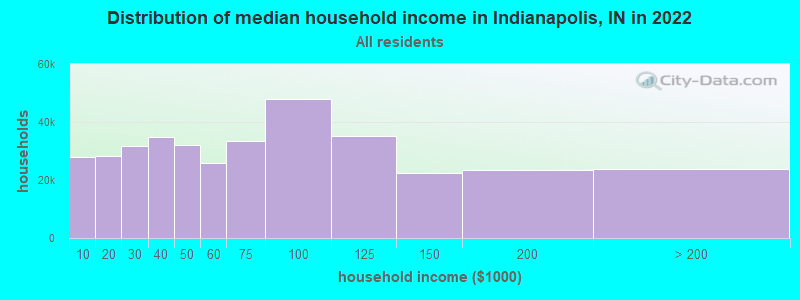
Indianapolis, IN household income distribution 27,956 Less than $10,00028,430 $10,000 to $19,99931,577 $20,000 to $29,99934,935 $30,000 to $39,99931,964 $40,000 to $49,99925,934 $50,000 to $59,99933,620 $60,000 to $74,99947,904 $75,000 to $99,99935,134 $100,000 to $124,99922,507 $125,000 to $149,99923,283 $150,000 to $199,99923,829 $200,000 or more
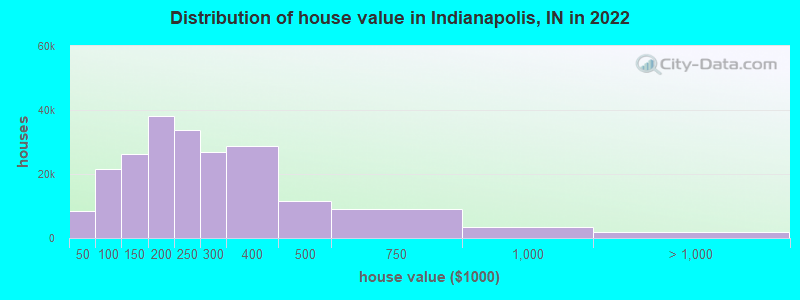
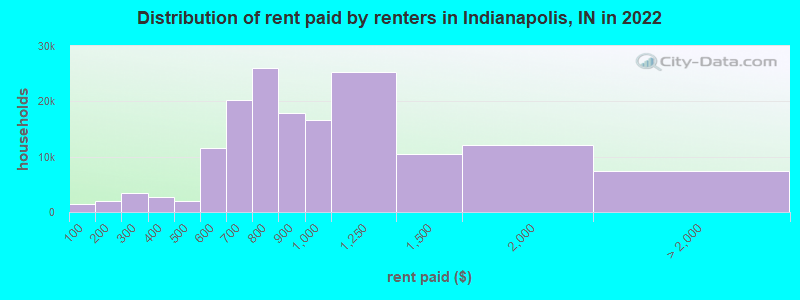
Home value of owner - occupied houses in 2022 in Indianapolis, IN 1,704 Less than $10,000667 $10,000 to $14,9991,380 $15,000 to $19,999607 $20,000 to $24,9991,084 $25,000 to $29,999709 $30,000 to $34,999667 $35,000 to $39,9991,473 $40,000 to $49,9992,273 $50,000 to $59,9993,204 $60,000 to $69,9995,029 $70,000 to $79,9995,572 $80,000 to $89,9993,869 $90,000 to $99,99914,556 $100,000 to $124,99911,805 $125,000 to $149,99922,326 $150,000 to $174,99915,793 $175,000 to $199,99933,640 $200,000 to $249,99926,869 $250,000 to $299,99928,699 $300,000 to $399,99911,607 $400,000 to $499,9999,022 $500,000 to $749,9993,375 $750,000 to $999,9991,011 $1,000,000 to $1,499,999356 $1,500,000 to $1,999,999639 $2,000,000 or moreRent paid by renters in 2022 in Indianapolis, IN 1,430 Less than $100874 $100 to $1491,147 $150 to $1992,613 $200 to $249772 $250 to $2991,098 $300 to $3491,700 $350 to $3991,048 $400 to $449977 $450 to $4994,846 $500 to $5496,757 $550 to $5997,636 $600 to $64912,544 $650 to $69913,458 $700 to $74912,499 $750 to $79917,904 $800 to $89916,608 $900 to $99925,294 $1,000 to $1,24910,399 $1,250 to $1,49912,054 $1,500 to $1,9992,083 $2,000 to $2,499818 $2,500 to $2,999217 $3,000 to $3,499468 $3,500 or more3,893 No cash rent
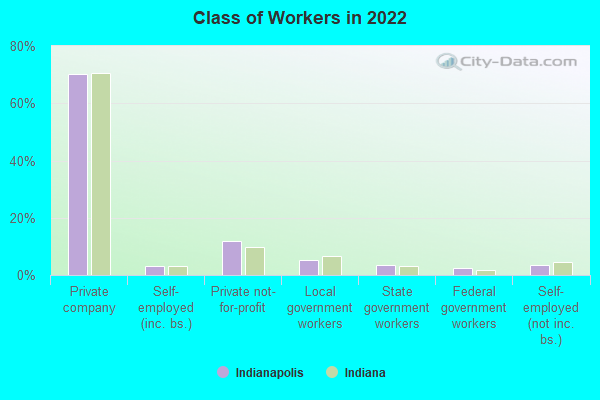
Percentage of workers working in this county: 80.3%Number of people working at home: 62,781 (14.2% of all workers )
Travel time to work (commute)
Less than 5 minutes: 9,1875 to 9 minutes: 28,37910 to 14 minutes: 44,70515 to 19 minutes: 62,92320 to 24 minutes: 67,40525 to 29 minutes: 42,50330 to 34 minutes: 65,24535 to 39 minutes: 14,33940 to 44 minutes: 11,44045 to 59 minutes: 18,26760 to 89 minutes: 8,91690 or more minutes: 7,087
Means of transportation to work:
Drove a car alone: 420,312 (75.7%)Carpooled: 50,737 (9.1%)Bus : 4,831 (0.9%)Subway or elevated rail : 54 (0.0%)Ferryboat: 323 (0.1%)Taxi: 6,087 (1.1%)Bicycle: 2,394 (0.4%)Walked: 7,917 (1.4%)Worked at home: 62,781 (11.3%)
Unemployment by race in 2022
Unemployment rate for White non-Hispanic residents 3.4% Males2.3% FemalesUnemployment rate for Black residents 10.7% Males7.2% FemalesUnemployment rate for American Indian and Alaska Native residents 0.8% Males5.7% FemalesUnemployment rate for Asian residents 6.5% Males3.7% FemalesUnemployment rate for other race residents 2.8% Males4.7% FemalesUnemployment rate for two or more race residents 9.9% Males5.8% FemalesUnemployment rate for Hispanic or Latino residents 2.9% Males7.5% Females
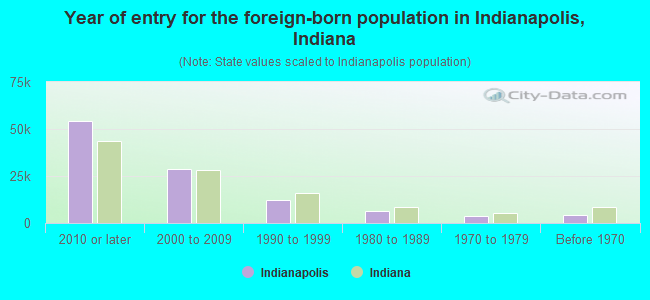
Year of entry for the foreign-born population in Indianapolis, Indiana
54,200 2010 or later 28,494 2000 to 2009 12,363 1990 to 1999 6,218 1980 to 1989 3,745 1970 to 1979 4,283 Before 1970
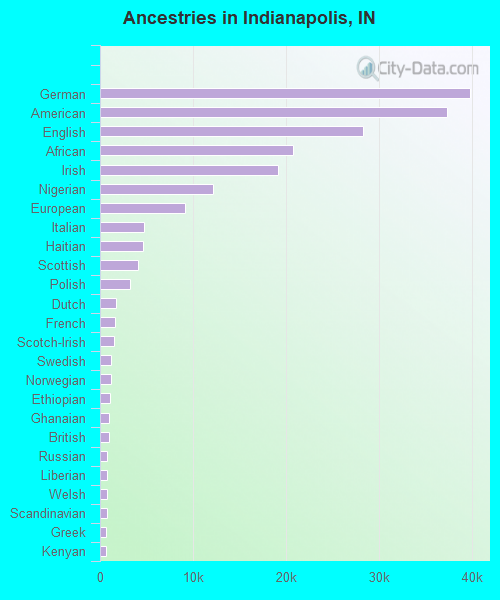
First ancestries reported:
German: 39,864 (8.7%)
American: 37,384 (8.2%)
English: 28,266 (6.2%)
African: 20,778 (4.5%)
Irish: 19,129 (4.2%)
Nigerian: 12,137 (2.7%)
European: 9,178 (2.0%)
Italian: 4,768 (1.0%)
Haitian: 4,588 (1.0%)
Scottish: 4,067 (0.9%)
Polish: 3,227 (0.7%)
Dutch: 1,704 (0.4%)
French: 1,653 (0.4%)
Scotch-Irish: 1,510 (0.3%)
Swedish: 1,228 (0.3%)
Norwegian: 1,135 (0.2%)
Ethiopian: 1,075 (0.2%)
Ghanaian: 1,016 (0.2%)
British: 1,007 (0.2%)
Russian: 775 (0.2%)
Liberian: 761 (0.2%)
Welsh: 719 (0.2%)
Scandinavian: 707 (0.2%)
Greek: 681 (0.1%)
Kenyan: 679 (0.1%)
Northern European: 636 (0.1%)
Eastern European: 583 (0.1%)
French Canadian: 560 (0.1%)
Iranian: 529 (0.1%)
Lebanese: 460 (0.1%)
Jamaican: 445 (0.10%)
Romanian: 430 (0.09%)
Ukrainian: 414 (0.09%)
Senegalese: 413 (0.09%)
Serbian: 376 (0.08%)
Danish: 357 (0.08%)
Hungarian: 337 (0.07%)
Swiss: 329 (0.07%)
Latvian: 283 (0.06%)
Brazilian: 255 (0.06%)
Portuguese: 224 (0.05%)
Syrian: 221 (0.05%)
Jordanian: 215 (0.05%)
Canadian: 215 (0.05%)
Iraqi: 212 (0.05%)
Sudanese: 208 (0.05%)
Czech: 198 (0.04%)
Yugoslavian: 189 (0.04%)
Belgian: 189 (0.04%)
Barbadian: 186 (0.04%)
Slovak: 180 (0.04%)
Slovene: 175 (0.04%)
Croatian: 172 (0.04%)
Afghan: 160 (0.04%)
Israeli: 160 (0.04%)
Somali: 159 (0.03%)
Austrian: 150 (0.03%)
South African: 137 (0.03%)
Lithuanian: 125 (0.03%)
Macedonian: 116 (0.03%)
Egyptian: 102 (0.02%)
Slavic: 99 (0.02%)
West Indian: 99 (0.02%)
Turkish: 97 (0.02%)
Palestinian: 91 (0.02%)
Pennsylvania German: 91 (0.02%)
Arab: 74 (0.02%)
Armenian: 69 (0.02%)
Zimbabwean: 58 (0.01%)
Czechoslovakian: 55 (0.01%)
Moroccan: 53 (0.01%)
Guyanese: 43 (0.01%)
Cypriot: 38 (0.01%)
Finnish: 38 (0.01%)
Luxembourger: 37 (0.01%)
Ugandan: 35 (0.01%)
Bulgarian: 34 (0.01%)
Australian: 32 (0.01%)
Basque: 29 (0.01%)
Estonian: 27 (0.01%)
Sierra Leonean: 25 (0.01%)
U.S. Virgin Islander: 25 (0.01%)
Belizean: 23 (0.01%)
Most common places of birth for foreign-born residents (%): Mexico Indianapolis:
25.3% (25,170)Indiana:
27.0% (101,996)
Nigeria Indianapolis:
10.3% (10,247)Indiana:
3.3% (12,337)
Burma (Myanmar) Indianapolis:
9.2% (9,185)Indiana:
4.3% (16,289)
India Indianapolis:
6.0% (6,017)Indiana:
8.5% (32,127)
Haiti Indianapolis:
4.0% (4,003)Indiana:
1.2% (4,484)
Honduras Indianapolis:
4.0% (3,940)Indiana:
1.6% (5,892)
Guatemala Indianapolis:
2.6% (2,589)Indiana:
2.3% (8,656)
Dominican Republic Indianapolis:
2.6% (2,586)Indiana:
0.6% (2,421)
El Salvador Indianapolis:
2.2% (2,237)Indiana:
2.2% (8,253)
Philippines Indianapolis:
1.7% (1,644)Indiana:
3.1% (11,851)
China, excluding Hong Kong and Taiwan Indianapolis:
1.6% (1,576)Indiana:
5.3% (19,877)
Place of birth for U.S.-born residents:
This state: 552,723Other state: 207,267Northeast: 24,995Midwest: 91,773South: 69,944West: 20,555 84.3% of Indianapolis residents lived in the same house 1 years ago.
Out of people who lived in different houses, 37.1% lived in this county.
Out of people who lived in different counties, 57.0% lived in Indiana.
Indianapolis:
84.3%State average:
87.1%
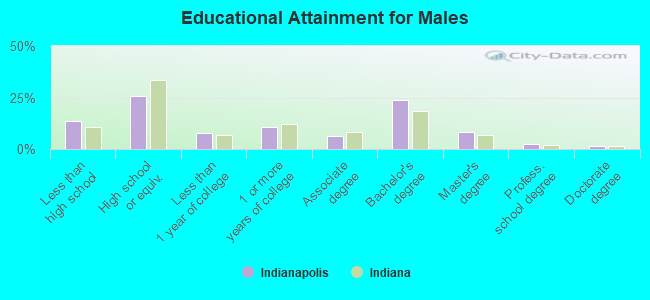
Education attainment for males 25 years and older:
No schooling: 8,606Nursery to 4th grade: 8155th and 6th grade: 2,8847th and 8th grade: 3,8499th grade: 2,06210th grade: 6,02311th grade: 4,48312th grade, no diploma: 8,379High school graduate (or equivalency): 71,294Less than 1 year of college: 21,163Some college more than 1 year, no degree: 29,299Associate degree: 17,867Bachelor's degree: 66,137Master's degree: 22,957Professional school degree: 7,271Doctorate degree: 3,477
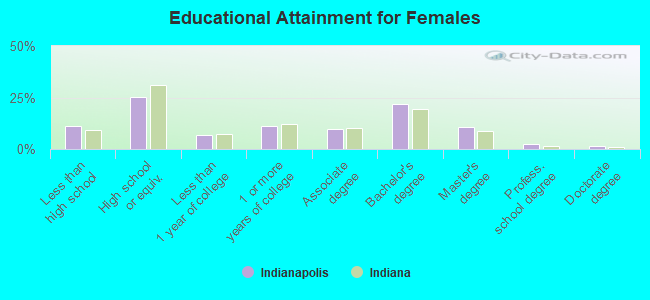
Education attainment for females 25 years and older:
No schooling: 6,376Nursery to 4th grade: 4075th and 6th grade: 1,5937th and 8th grade: 4,1469th grade: 1,98510th grade: 5,74911th grade: 6,36612th grade, no diploma: 7,513High school graduate (or equivalency): 75,685Less than 1 year of college: 20,950Some college more than 1 year, no degree: 33,390Associate degree: 29,662Bachelor's degree: 65,326Master's degree: 31,711Professional school degree: 6,882Doctorate degree: 3,860
Housing units in structures:
One, detached: 231,109One, attached: 32,300Two: 8,1743 or 4: 26,7715 to 9: 34,90710 to 19: 24,01920 to 49: 16,09450 or more: 22,667Mobile homes: 5,593Boats, RVs, vans, etc.: 79Median worth of mobile homes: $38,800
Housing units lacking complete plumbing facilities in 2022: 1.0%Housing units lacking complete kitchen facilities in 2022: 1.6%House/condo owner moved in on average 10 years ago
Renter moved in on average 2 years ago
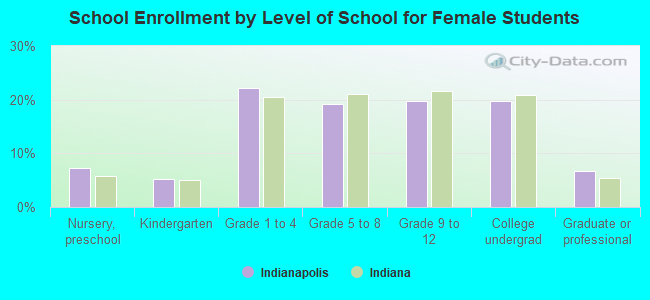
Private vs. public school enrollment:
Students in private schools in grades 1 to 8 (elementary and middle school): 13,005 Students in private schools in grades 9 to 12 (high school): 6,557 Students in private undergraduate colleges: 11,530