Idaho Falls, ID (Idaho) Houses and Residents
Estimated median house or condo value in 2022: $334,600 (it was $88,700 in 2000 )
Idaho Falls:
$334,600Idaho:
$432,500
Lower value quartile - upper value quartile: $226,400 - $441,800Mean price in 2022: Detached houses: $330,997 Here:
$330,997State:
$527,539
Townhouses or other attached units: $332,559 Here:
$332,559State:
$416,749
In 2-unit structures: $166,725 Here:
$166,725State:
$523,641
In 3-to-4-unit structures: $183,069 Here:
$183,069State:
$384,926
In 5-or-more-unit structures: $296,933 Here:
$296,933State:
$590,418
Mobile homes: $66,687 Here:
$66,687State:
$150,232
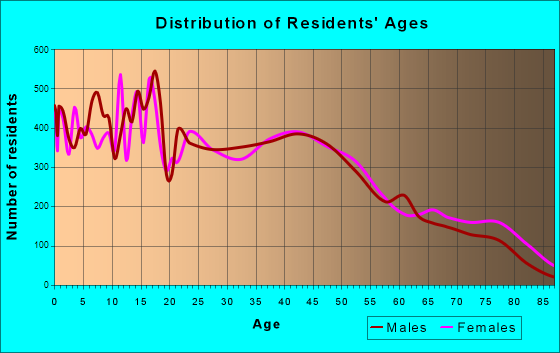
Total population: 58,691 (Urban population: 50,442, Rural population: 42 (all nonfarm) )
Houses: 26,507 (24,337 occupied: 17,025 owner occupied, 7,312 renter occupied )
% of renters here:
30%State:
28%
Housing density: 1,553 houses/condos per square mile
Median price asked for vacant for-sale houses and condos in 2022: $602,966.
Median contract rent in 2022: $861 (lower quartile is $627, upper quartile is $1,185)
Median rent asked for vacant for-rent units in 2022: $1,552
Median gross rent in Idaho Falls, ID in 2022: $994
Housing units in Idaho Falls with a mortgage: 10,602 (991 second mortgage, 0 home equity loan, 670 both second mortgage and home equity loan )Houses without a mortgage: 236
Median household income for houses/condos with a mortgage: $95,804
Median household income for apartments without a mortgage: $62,208
Median monthly housing costs: $993
Data:
Median house or condo value ($)
Median house or condo value ($ change since 2000)
Median house or condo value ($) - White
Median house or condo value ($) - Black or African American
Median house or condo value ($) - Asian
Median house or condo value ($) - Hispanic or Latino
Median house or condo value ($) - American Indian and Alaska Native
Median house or condo value ($) - Multirace
Median house or condo value ($) - Other Race
Median price asked for mobile homes ($)
Household density (households per square mile)
Mean house or condo value by units in structure - 1, detached ($)
Mean house or condo value by units in structure - 1, attached ($)
Mean house or condo value by units in structure - 2 ($)
Mean house or condo value by units in structure by units in structure - 3 or 4 ($)
Mean house or condo value by units in structure - 5 or more ($)
Mean house or condo value by units in structure - Boat, RV, van, etc. ($)
Mean house or condo value by units in structure - Mobile home ($)
Median contract rent ($)
Median contract rent - Lower quartile ($)
Median contract rent - Upper quartile ($)
Median gross rent ($)
Urban houses (%)
Rural houses (%)
Houses occupied (%)
Houses occupied (% change since 2000)
Houses owner occupied (%)
Houses owner occupied (% change since 2000)
Houses renter occupied (%)
Houses renter occupied (% change since 2000)
Vacant housing units - For rent (%)
Vacant housing units - For rent (% change since 2000)
Vacant housing units - For sale only (%)
Vacant housing units - For sale only (% change since 2000)
Vacant housing units - Rented or sold, not occupied (%)
Vacant housing units - Rented or sold, not occupied (% change since 2000)
Vacant housing units - For seasonal, recreational, or occasional use (%)
Vacant housing units - For seasonal, recreational, or occasional use (% change since 2000)
Vacant housing units - For migrant workers (%)
Vacant housing units - For migrant workers (% change since 2000)
Vacant housing units - Other vacant (%)
Vacant housing units - Other vacant (% change since 2000)
Median monthly housing costs ($)
Median household income for houses/condos with a mortgage ($)
Median household income for houses/condos without a mortgage ($)
Median household income ($)
Median household income ($) - White
Median household income ($) - Black or African American
Median household income ($) - Asian
Median household income ($) - Hispanic or Latino
Median household income ($) - American Indian and Alaska Native
Median household income ($) - Multirace
Median household income ($) - Other Race
Mortgage status - with mortgage (%)
Mortgage status - with second mortgage (%)
Mortgage status - with home equity loan (%)
Mortgage status - with both second mortgage and home equity loan (%)
Mortgage status - without a mortgage (%)
Median year house/condo built
Median year apartment built
Household type by relationship - Male householder living alone (%)
Household type by relationship - Male householder not living alone (%)
Household type by relationship - Female householder living alone (%)
Household type by relationship - Female householder not living alone (%)
Household type by relationship - Opposite-Sex spouse (%)
Household type by relationship - Same-Sex spouse (%)
Household type by relationship - Opposite-Sex unmarried partner (%)
Household type by relationship - Same-Sex unmarried partner (%)
Household type by relationship - In group quarters (%)
Size of family households - 2-person household (%)
Size of family households - 3-person household (%)
Size of family households - 4-person household (%)
Size of family households - 5-person household (%)
Size of family households - 6-person household (%)
Size of family households - 7-or-more-person household (%)
Size of nonfamily households - 1-person household (%)
Size of nonfamily households - 2-person household (%)
Size of nonfamily households - 3-person household (%)
Size of nonfamily households - 4-person household (%)
Size of nonfamily households - 5-person household (%)
Size of nonfamily households - 6-person household (%)
Size of nonfamily households - 7-or-moreperson household (%)
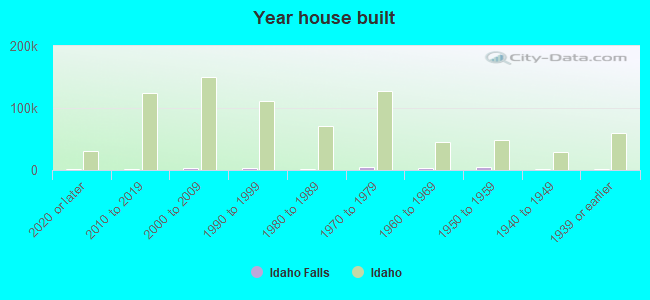
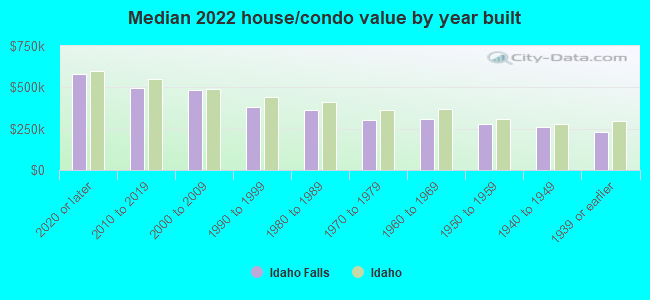
Year house built - Built 2010 or later (%)
Year house built - Built 2000 to 2009 (%)
Year house built - Built 1990 to 1999 (%)
Year house built - Built 1980 to 1989 (%)
Year house built - Built 1970 to 1979 (%)
Year house built - Built 1960 to 1969 (%)
Year house built - Built 1950 to 1959 (%)
Year house built - Built 1940 to 1949 (%)
Year house built - Built 1939 or earlier (%)
Median number of rooms in houses and condos
Median number of rooms in apartments
Median number of bedrooms in owner occupied houses
Mean number of bedrooms in owner occupied houses
Median number of bedrooms in renter occupied houses
Mean number of bedrooms in renter occupied houses
Median number of vehichles in owner occupied houses
Mean number of vehichles in owner occupied houses
Median number of vehichles in renter occupied houses
Mean number of vehichles in renter occupied houses
Rooms in owner-occupied houses - 1 room (%)
Rooms in owner-occupied houses - 2 rooms (%)
Rooms in owner-occupied houses - 3 rooms (%)
Rooms in owner-occupied houses - 4 rooms (%)
Rooms in owner-occupied houses - 5 rooms (%)
Rooms in owner-occupied houses - 6 rooms (%)
Rooms in owner-occupied houses - 7 rooms (%)
Rooms in owner-occupied houses - 8 rooms (%)
Rooms in owner-occupied houses - 9+ rooms (%)
Rooms in renter-occupied houses - 1 room (%)
Rooms in renter-occupied houses - 2 rooms (%)
Rooms in renter-occupied houses - 3 rooms (%)
Rooms in renter-occupied houses - 4 rooms (%)
Rooms in renter-occupied houses - 5 rooms (%)
Rooms in renter-occupied houses - 6 rooms (%)
Rooms in renter-occupied houses - 7 rooms (%)
Rooms in renter-occupied houses - 8 rooms (%)
Rooms in renter-occupied houses - 9+ rooms (%)
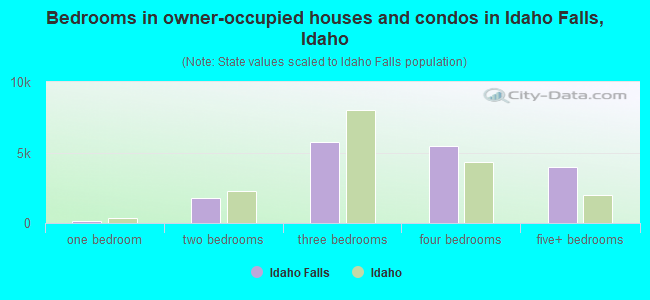
Bedrooms in owner-occupied houses - no bedrooms (%)
Bedrooms in owner-occupied houses - 1 bedroom (%)
Bedrooms in owner-occupied houses - 2 bedrooms (%)
Bedrooms in owner-occupied houses - 3 bedrooms (%)
Bedrooms in owner-occupied houses - 4 bedrooms (%)
Bedrooms in owner-occupied houses - 5+ bedrooms (%)
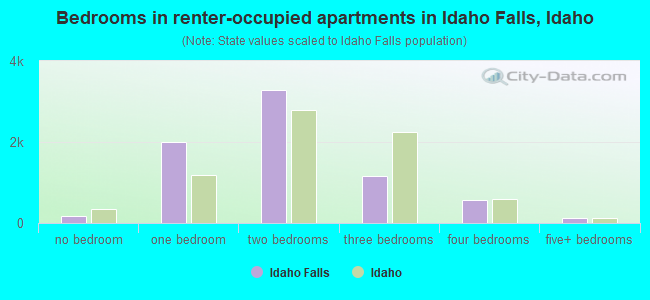
Bedrooms in renter-occupied houses - no bedrooms (%)
Bedrooms in renter-occupied houses - 1 bedroom (%)
Bedrooms in renter-occupied houses - 2 bedrooms (%)
Bedrooms in renter-occupied houses - 3 bedrooms (%)
Bedrooms in renter-occupied houses - 4 bedrooms (%)
Bedrooms in renter-occupied houses - 5+ bedrooms (%)
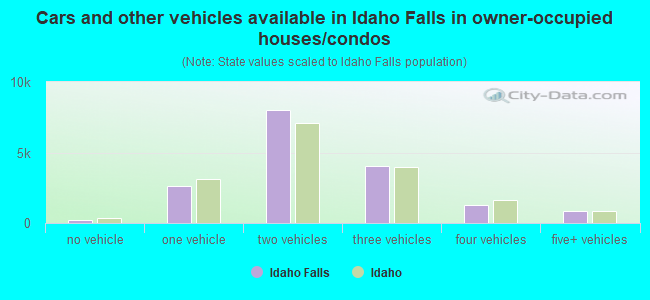
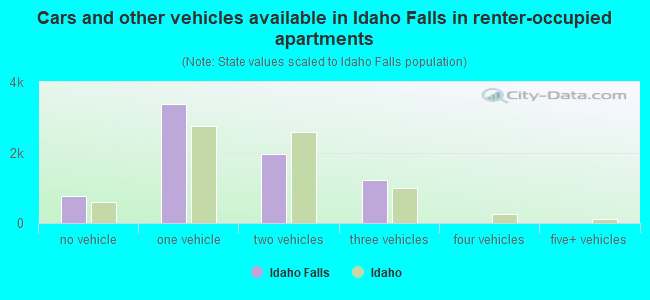
Vehicles available in owner-occupied houses - no vehicle available (%)
Vehicles available in owner-occupied houses - 1 vehicle available(%)
Vehicles available in owner-occupied houses - 2 Vehicles available (%)
Vehicles available in owner-occupied houses - 3 Vehicles available (%)
Vehicles available in owner-occupied houses - 4 Vehicles available (%)
Vehicles available in owner-occupied houses - 5+ Vehicles available (%)
Vehicles available in renter-occupied houses - no vehicle available (%)
Vehicles available in renter-occupied houses - 1 vehicle available (%)
Vehicles available in renter-occupied houses - 2 Vehicles available (%)
Vehicles available in renter-occupied houses - 3 Vehicles available (%)
Vehicles available in renter-occupied houses - 4 Vehicles available (%)
Vehicles available in renter-occupied houses - 5+ Vehicles available (%)
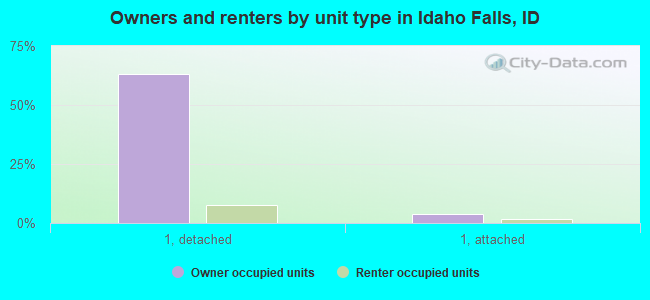
Housing units in structures - 1, detached (%)
Housing units in structures - 1, attached (%)
Housing units in structures - 2 (%)
Housing units in structures - 3 or 4 (%)
Housing units in structures - 5 to 9 (%)
Housing units in structures - 10 to 19 (%)
Housing units in structures - 20 to 49 (%)
Housing units in structures - 50 or more (%)
Housing units in structures - Mobile home (%)
Housing units in structures - Boat, RV, van, etc. (%)
Housing units in structures - Owners - 1, detached (%)
Housing units in structures - Owners - 1, attached (%)
Housing units in structures - Owners - 2 (%)
Housing units in structures - Owners - 3 or 4 (%)
Housing units in structures - Owners - 5 to 9 (%)
Housing units in structures - Owners - 10 to 19 (%)
Housing units in structures - Owners - 20 to 49 (%)
Housing units in structures - Owners - 50 or more (%)
Housing units in structures - Owners - Mobile home (%)
Housing units in structures - Owners - Boat, RV, van, etc. (%)
Housing units in structures - Renters - 1, detached (%)
Housing units in structures - Renters - 1, attached (%)
Housing units in structures - Renters - 2 (%)
Housing units in structures - Renters - 3 or 4 (%)
Housing units in structures - Renters - 5 to 9 (%)
Housing units in structures - Renters - 10 to 19 (%)
Housing units in structures - Renters - 20 to 49 (%)
Housing units in structures - Renters - 50 or more (%)
Housing units in structures - Renters - Mobile home (%)
Housing units in structures - Renters - Boat, RV, van, etc. (%)
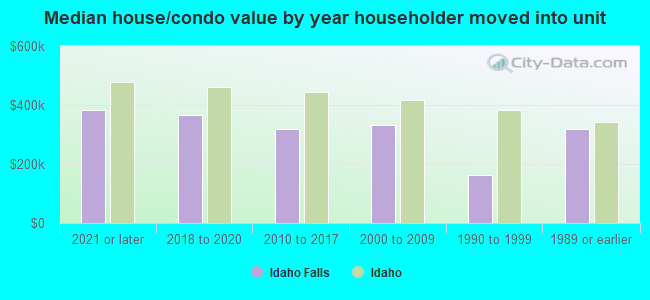
House/condo owner moved in on average (years ago)
Renter moved in on average (years ago)
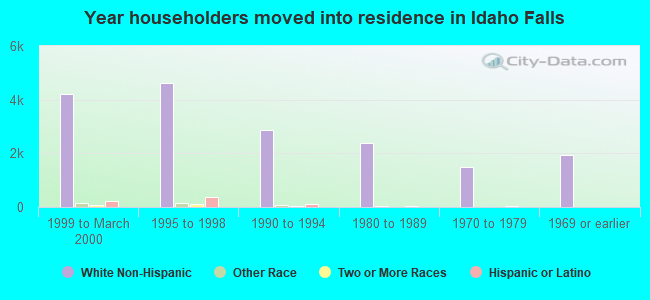
Year householder moved into unit - Moved in 1999 to March 2000 (%)
Year householder moved into unit - Moved in 1999 to March 2000 (%) - White
Year householder moved into unit - Moved in 1999 to March 2000 (%) - Black or African American
Year householder moved into unit - Moved in 1999 to March 2000 (%) - Asian
Year householder moved into unit - Moved in 1999 to March 2000 (%) - Hispanic or Latino
Year householder moved into unit - Moved in 1999 to March 2000 (%) - American Indian and Alaska Native
Year householder moved into unit - Moved in 1999 to March 2000 (%) - Multirace
Year householder moved into unit - Moved in 1999 to March 2000 (%) - Other Race
Year householder moved into unit - Moved in 1995 to 1998 (%)
Year householder moved into unit - Moved in 1995 to 1998 (%) - White
Year householder moved into unit - Moved in 1995 to 1998 (%) - Black or African American
Year householder moved into unit - Moved in 1995 to 1998 (%) - Asian
Year householder moved into unit - Moved in 1995 to 1998 (%) - Hispanic or Latino
Year householder moved into unit - Moved in 1995 to 1998 (%) - American Indian and Alaska Native
Year householder moved into unit - Moved in 1995 to 1998 (%) - Multirace
Year householder moved into unit - Moved in 1995 to 1998 (%) - Other Race
Year householder moved into unit - Moved in 1990 to 1994 (%)
Year householder moved into unit - Moved in 1990 to 1994 (%) - White
Year householder moved into unit - Moved in 1990 to 1994 (%) - Black or African American
Year householder moved into unit - Moved in 1990 to 1994 (%) - Asian
Year householder moved into unit - Moved in 1990 to 1994 (%) - Hispanic or Latino
Year householder moved into unit - Moved in 1990 to 1994 (%) - American Indian and Alaska Native
Year householder moved into unit - Moved in 1990 to 1994 (%) - Multirace
Year householder moved into unit - Moved in 1990 to 1994 (%) - Other Race
Year householder moved into unit - Moved in 1980 to 1989 (%)
Year householder moved into unit - Moved in 1980 to 1989 (%) - White
Year householder moved into unit - Moved in 1980 to 1989 (%) - Black or African American
Year householder moved into unit - Moved in 1980 to 1989 (%) - Asian
Year householder moved into unit - Moved in 1980 to 1989 (%) - Hispanic or Latino
Year householder moved into unit - Moved in 1980 to 1989 (%) - American Indian and Alaska Native
Year householder moved into unit - Moved in 1980 to 1989 (%) - Multirace
Year householder moved into unit - Moved in 1980 to 1989 (%) - Other Race
Year householder moved into unit - Moved in 1970 to 1979 (%)
Year householder moved into unit - Moved in 1970 to 1979 (%) - White
Year householder moved into unit - Moved in 1970 to 1979 (%) - Black or African American
Year householder moved into unit - Moved in 1970 to 1979 (%) - Asian
Year householder moved into unit - Moved in 1970 to 1979 (%) - Hispanic or Latino
Year householder moved into unit - Moved in 1970 to 1979 (%) - American Indian and Alaska Native
Year householder moved into unit - Moved in 1970 to 1979 (%) - Multirace
Year householder moved into unit - Moved in 1970 to 1979 (%) - Other Race
Year householder moved into unit - Moved in 1969 or earlier (%)
Year householder moved into unit - Moved in 1969 or earlier (%) - White
Year householder moved into unit - Moved in 1969 or earlier (%) - Black or African American
Year householder moved into unit - Moved in 1969 or earlier (%) - Asian
Year householder moved into unit - Moved in 1969 or earlier (%) - Hispanic or Latino
Year householder moved into unit - Moved in 1969 or earlier (%) - American Indian and Alaska Native
Year householder moved into unit - Moved in 1969 or earlier (%) - Multirace
Year householder moved into unit - Moved in 1969 or earlier (%) - Other Race
Housing units lacking complete plumbing facilities (%)
Housing units lacking complete kitchen facilities (%)
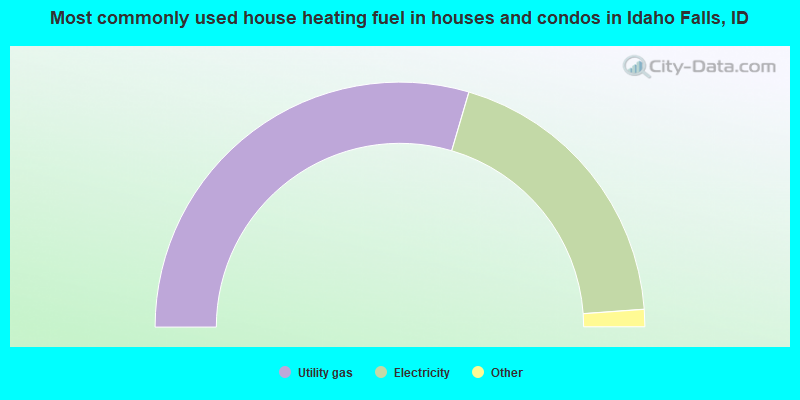
House heating fuel used in houses and condos - Utility gas (%)
House heating fuel used in houses and condos - Bottled, tank, or LP gas (%)
House heating fuel used in houses and condos - Electricity (%)
House heating fuel used in houses and condos - Fuel oil, kerosene, etc. (%)
House heating fuel used in houses and condos - Coal or coke (%)
House heating fuel used in houses and condos - Wood (%)
House heating fuel used in houses and condos - Solar energy (%)
House heating fuel used in houses and condos - Other fuel (%)
House heating fuel used in houses and condos - No fuel used (%)
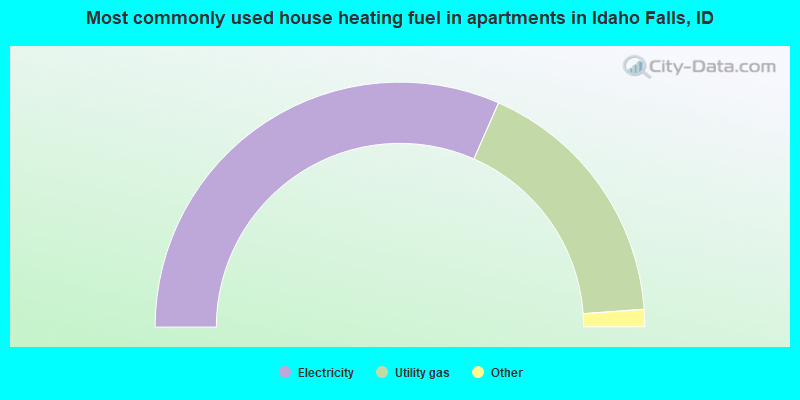
House heating fuel used in apartments - Utility gas (%)
House heating fuel used in apartments - Bottled, tank, or LP gas (%)
House heating fuel used in apartments - Electricity (%)
House heating fuel used in apartments - Fuel oil, kerosene, etc. (%)
House heating fuel used in apartments - Coal or coke (%)
House heating fuel used in apartments - Wood (%)
House heating fuel used in apartments - Solar energy (%)
House heating fuel used in apartments - Other fuel (%)
House heating fuel used in apartments - No fuel used (%)
Median year house/condo built: 1975Median year apartment built: 1979Household type by relationship:
Households: 67,718
Male householders: 10,870 (1,626 living alone ), Female householders: 13,467 (3,144 living alone )14,284 spouses (14,222 opposite-sex spouses ), 1,505 unmarried partners , (1,366 opposite-sex unmarried partners ), 20,502 children (19,828 natural , 56 adopted , 618 stepchildren ), 2,832 grandchildren , 291 brothers or sisters , 218 parents , 50 foster children , 565 other relatives , 1,842 non-relatives In group quarters: 1,292
Size of family households: 6,234 2-persons , 4,191 3-persons , 3,683 4-persons , 1,676 5-persons , 875 6-persons , 762 7-or-more-persons .
Size of nonfamily households: 4,770 1-person , 2,060 2-persons , 86 3-persons .
13,850 married couples with children. single-parent households (1,245 men , 1,332 women ).
88.9% of residents of Idaho Falls speak English at home. of residents speak Spanish at home (68% speak English very well , 15% speak English well , 15% speak English not well , 2% don't speak English at all ).of residents speak other Indo-European language at home (89% speak English very well , 6% speak English well , 5% speak English not well ).of residents speak Asian or Pacific Island language at home (72% speak English very well , 23% speak English well , 4% speak English not well ).of residents speak other language at home (87% speak English very well , 13% speak English well ).
Foreign born population: 2,875 (4.2%)of them are naturalized citizens )
Median number of rooms in houses and condos:
Median number of rooms in apartments
Owner-occupied Renter-occupied
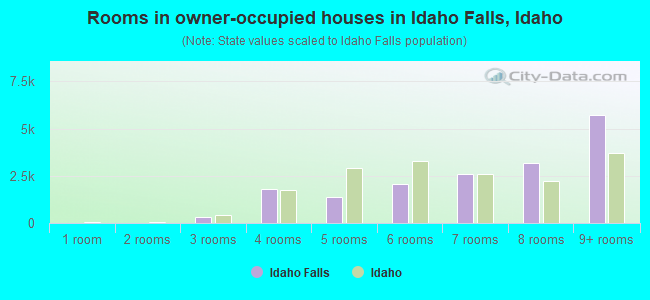
Rooms in owner-occupied houses in Idaho Falls, Idaho
0 1 room 0 2 rooms 312 3 rooms 1,811 4 rooms 1,373 5 rooms 2,052 6 rooms 2,602 7 rooms 3,160 8 rooms 5,715 9+ rooms
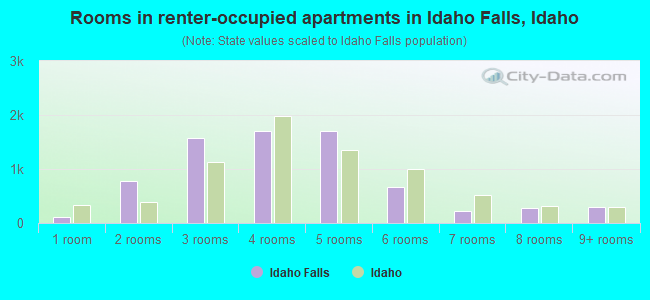
Rooms in renter-occupied apartments in Idaho Falls, Idaho
103 1 room 771 2 rooms 1,568 3 rooms 1,707 4 rooms 1,711 5 rooms 659 6 rooms 230 7 rooms 269 8 rooms 294 9+ rooms
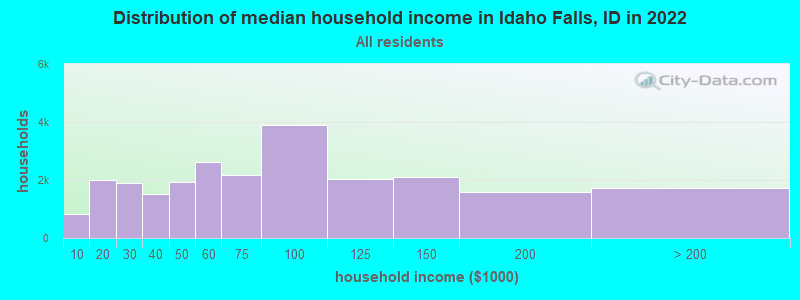
Idaho Falls, ID household income distribution 843 Less than $10,0001,992 $10,000 to $19,9991,890 $20,000 to $29,9991,511 $30,000 to $39,9991,941 $40,000 to $49,9992,618 $50,000 to $59,9992,180 $60,000 to $74,9993,909 $75,000 to $99,9992,022 $100,000 to $124,9992,100 $125,000 to $149,9991,593 $150,000 to $199,9991,738 $200,000 or more
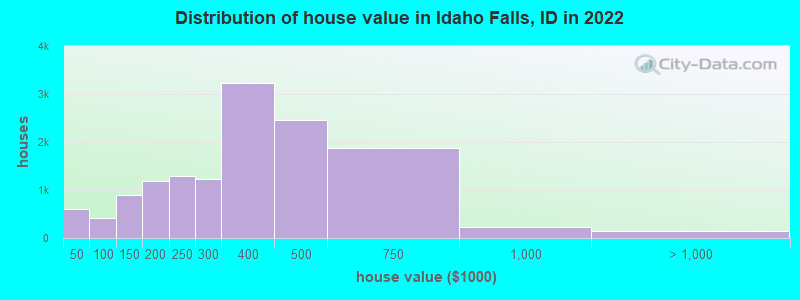
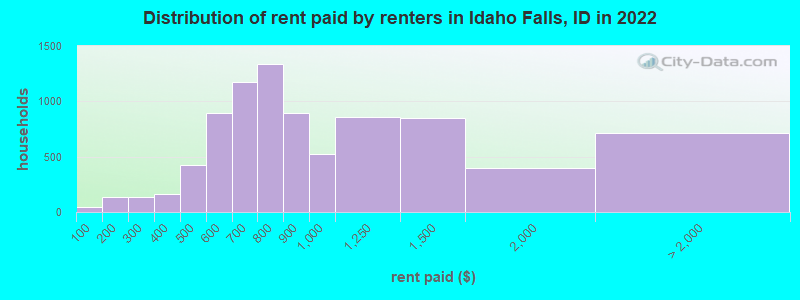
Home value of owner - occupied houses in 2022 in Idaho Falls, ID 98 Less than $10,00024 $10,000 to $14,99985 $15,000 to $19,99968 $20,000 to $24,99941 $25,000 to $29,999155 $30,000 to $34,99937 $35,000 to $39,99998 $40,000 to $49,99964 $50,000 to $59,99961 $70,000 to $79,999109 $80,000 to $89,99982 $90,000 to $99,999425 $100,000 to $124,999477 $125,000 to $149,999761 $150,000 to $174,999425 $175,000 to $199,9991,298 $200,000 to $249,9991,230 $250,000 to $299,9993,218 $300,000 to $399,9992,462 $400,000 to $499,9991,877 $500,000 to $749,999228 $750,000 to $999,99983 $1,000,000 to $1,499,99917 $1,500,000 to $1,999,99947 $2,000,000 or moreRent paid by renters in 2022 in Idaho Falls, ID 43 Less than $1006 $100 to $149132 $150 to $19937 $200 to $24996 $250 to $29966 $300 to $34996 $350 to $399137 $400 to $449290 $450 to $499575 $500 to $549319 $550 to $599693 $600 to $649478 $650 to $699569 $700 to $749767 $750 to $799894 $800 to $899521 $900 to $999856 $1,000 to $1,249850 $1,250 to $1,499397 $1,500 to $1,999244 $2,000 to $2,49984 $2,500 to $2,99984 $3,000 to $3,499169 $3,500 or more135 No cash rent
Percentage of workers working in this county: 85.6%Number of people working at home: 2,549 (8.4% of all workers )
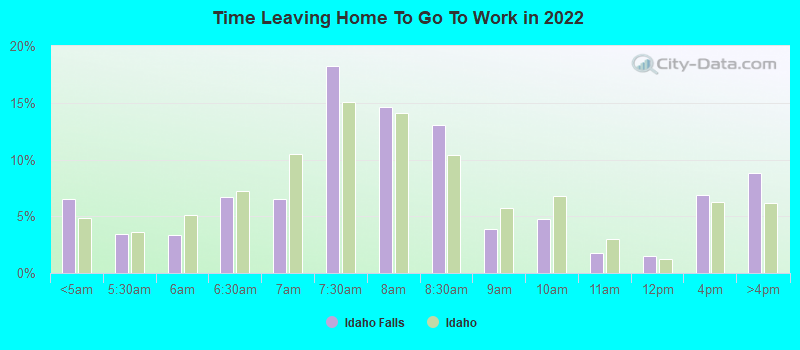
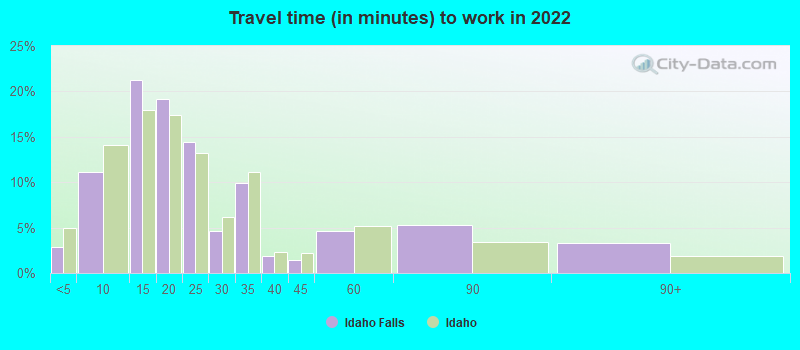
Travel time to work (commute)
Less than 5 minutes: 1,1405 to 9 minutes: 4,08710 to 14 minutes: 7,17415 to 19 minutes: 6,02120 to 24 minutes: 3,00325 to 29 minutes: 84830 to 34 minutes: 2,45935 to 39 minutes: 4540 to 44 minutes: 54445 to 59 minutes: 1,15160 to 89 minutes: 1,54190 or more minutes: 738
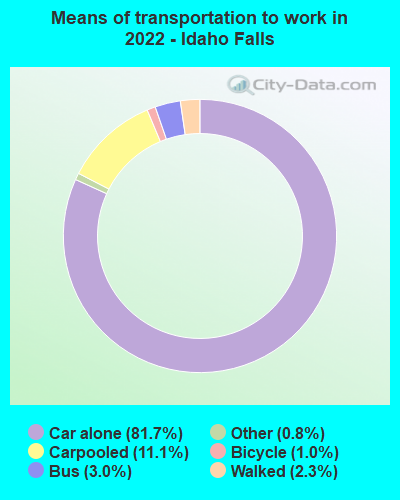
Means of transportation to work:
Drove a car alone: 33,594 (77.6%)Carpooled: 4,574 (10.6%)Bus : 1,233 (2.8%)Taxi: 341 (0.8%)Bicycle: 424 (1.0%)Walked: 939 (2.2%)Worked at home: 2,195 (5.1%)
Unemployment by race in 2022
Unemployment rate for White non-Hispanic residents 8.1% Males5.7% FemalesUnemployment rate for American Indian and Alaska Native residents 23.2% MalesUnemployment rate for other race residents 1.1% MalesUnemployment rate for two or more race residents 6.4% Males3.5% FemalesUnemployment rate for Hispanic or Latino residents 1.4% Males3.6% Females
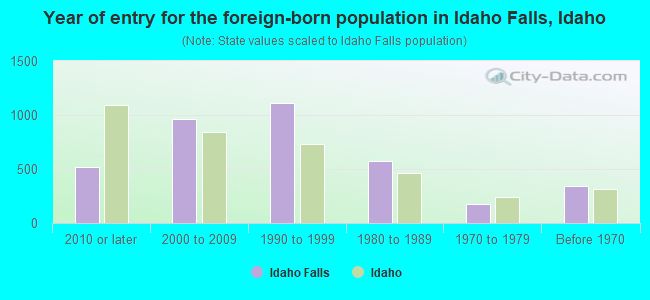
Year of entry for the foreign-born population in Idaho Falls, Idaho
517 2010 or later 966 2000 to 2009 1,114 1990 to 1999 570 1980 to 1989 175 1970 to 1979 343 Before 1970
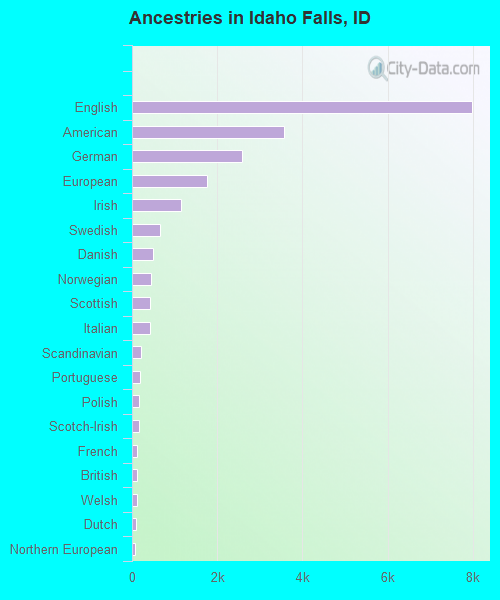
First ancestries reported:
English: 7,984 (25.0%)
American: 3,571 (11.2%)
German: 2,585 (8.1%)
European: 1,752 (5.5%)
Irish: 1,140 (3.6%)
Swedish: 669 (2.1%)
Danish: 501 (1.6%)
Norwegian: 456 (1.4%)
Scottish: 431 (1.4%)
Italian: 430 (1.3%)
Scandinavian: 210 (0.7%)
Portuguese: 191 (0.6%)
Polish: 173 (0.5%)
Scotch-Irish: 162 (0.5%)
French: 126 (0.4%)
British: 125 (0.4%)
Welsh: 118 (0.4%)
Dutch: 88 (0.3%)
Northern European: 73 (0.2%)
Greek: 65 (0.2%)
Canadian: 62 (0.2%)
Basque: 43 (0.1%)
Swiss: 41 (0.1%)
Hungarian: 29 (0.09%)
French Canadian: 25 (0.08%)
Finnish: 22 (0.07%)
Romanian: 22 (0.07%)
Czech: 21 (0.07%)
Russian: 21 (0.07%)
Ukrainian: 21 (0.07%)
Eastern European: 18 (0.06%)
Egyptian: 17 (0.05%)
Lebanese: 15 (0.05%)
Sierra Leonean: 14 (0.04%)
Belgian: 12 (0.04%)
Yugoslavian: 12 (0.04%)
Armenian: 10 (0.03%)
Brazilian: 9 (0.03%)
Serbian: 7 (0.02%)
Croatian: 6 (0.02%)
Slovak: 5 (0.02%)
Austrian: 5 (0.02%)
Bulgarian: 4 (0.01%)
African: 3 (0.01%) Most common places of birth for foreign-born residents (%): Mexico Idaho Falls:
60.5% (1,971)Idaho:
49.9% (53,107)
Guatemala Idaho Falls:
11.5% (374)Idaho:
1.9% (2,023)
China, excluding Hong Kong and Taiwan Idaho Falls:
4.2% (136)Idaho:
2.1% (2,219)
Canada Idaho Falls:
3.2% (103)Idaho:
5.2% (5,503)
Cuba Idaho Falls:
2.3% (74)Idaho:
0.2% (253)
Korea Idaho Falls:
2.0% (65)Idaho:
1.7% (1,802)
Venezuela Idaho Falls:
1.9% (63)Idaho:
0.4% (389)
Philippines Idaho Falls:
1.7% (54)Idaho:
2.1% (2,230)
Place of birth for U.S.-born residents:
This state: 35,669Other state: 28,741Northeast: 2,110Midwest: 2,855South: 3,766West: 20,010 82.6% of Idaho Falls residents lived in the same house 1 years ago.
Out of people who lived in different houses, 35.9% lived in this county.
Out of people who lived in different counties, 43.3% lived in Idaho.
Idaho Falls:
82.6%State average:
85.1%
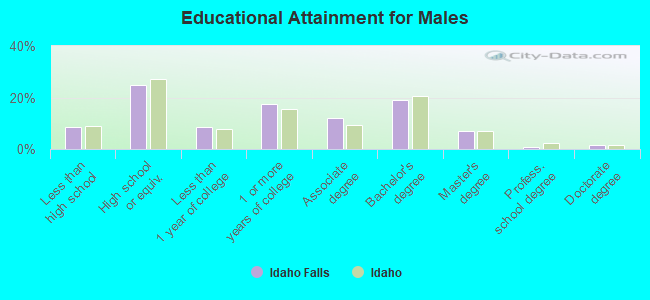
Education attainment for males 25 years and older:
No schooling: 255Nursery to 4th grade: 2995th and 6th grade: 2297th and 8th grade: 09th grade: 010th grade: 5711th grade: 83312th grade, no diploma: 314High school graduate (or equivalency): 5,670Less than 1 year of college: 1,914Some college more than 1 year, no degree: 3,967Associate degree: 2,794Bachelor's degree: 4,386Master's degree: 1,623Professional school degree: 165Doctorate degree: 365
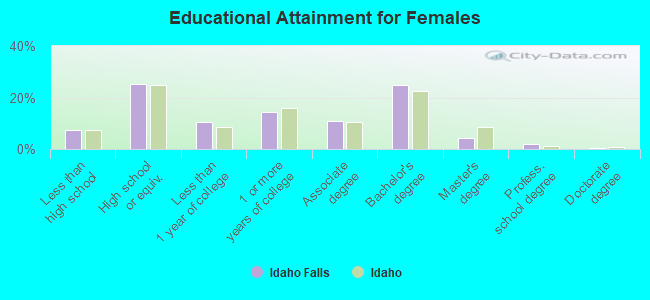
Education attainment for females 25 years and older:
No schooling: 151Nursery to 4th grade: 05th and 6th grade: 867th and 8th grade: 1059th grade: 32410th grade: 24711th grade: 36112th grade, no diploma: 359High school graduate (or equivalency): 5,548Less than 1 year of college: 2,344Some college more than 1 year, no degree: 3,191Associate degree: 2,364Bachelor's degree: 5,500Master's degree: 943Professional school degree: 428Doctorate degree: 88
Housing units in structures:
One, detached: 17,607One, attached: 1,511Two: 4053 or 4: 2,8155 to 9: 1,19810 to 19: 55520 to 49: 56950 or more: 691Mobile homes: 1,156Median worth of mobile homes: $58,036
Housing units lacking complete plumbing facilities in 2022: 0.4%Housing units lacking complete kitchen facilities in 2022: 1.0%House/condo owner moved in on average 9 years ago
Renter moved in on average 2 years ago
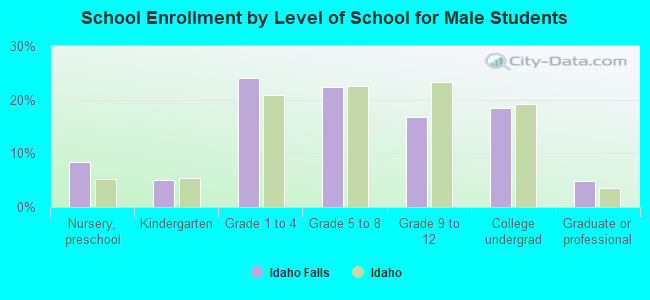
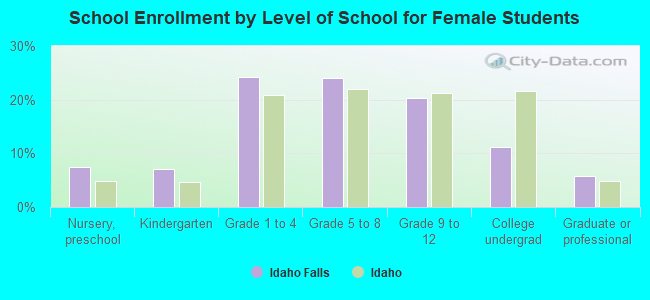
Private vs. public school enrollment:
Students in private schools in grades 1 to 8 (elementary and middle school): 251 Students in private schools in grades 9 to 12 (high school): 0 Students in private undergraduate colleges: 853