Housing density: 260 houses/condos per square mile
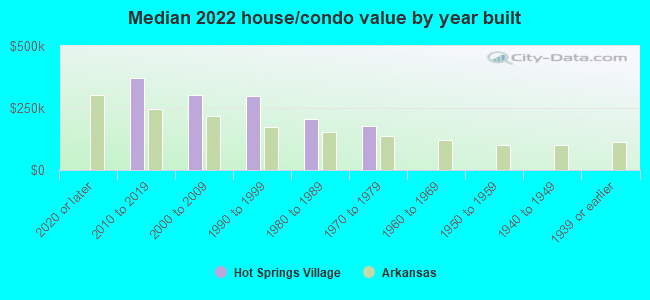
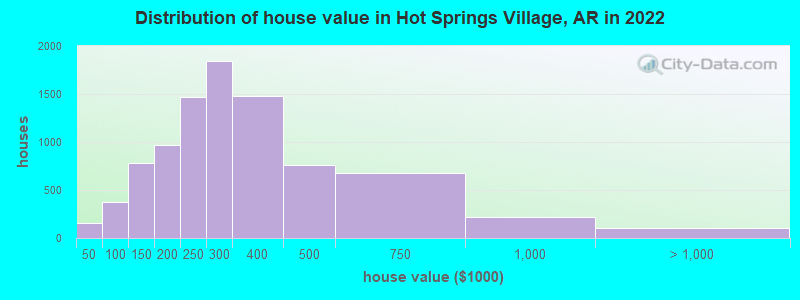
Median price asked for vacant for-sale houses and condos in 2022: $328,535.
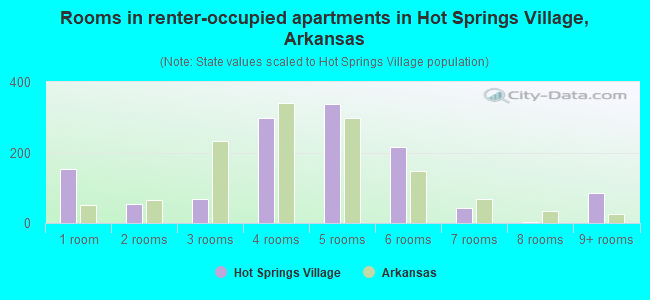
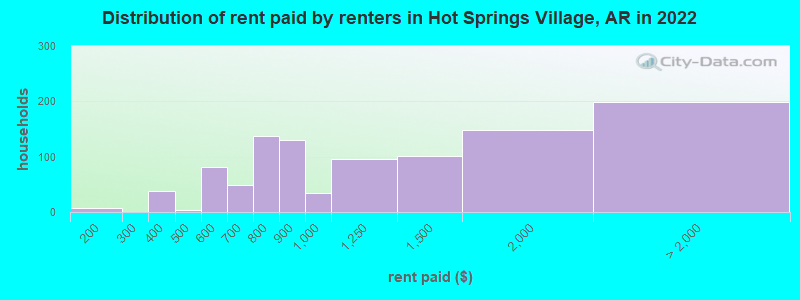
Median contract rent in 2022: $861 (lower quartile is $733, upper quartile is $1,657)
Median rent asked for vacant for-rent units in 2022: $943
Median gross rent in Hot Springs Village, AR in 2022: $1,116
Housing units in Hot Springs Village with a mortgage: 3,111 (213 second mortgage, 0 home equity loan, 94 both second mortgage and home equity loan) Houses without a mortgage: 53
Median household income for houses/condos with a mortgage: $67,011
Median household income for apartments without a mortgage: $66,573
Median monthly housing costs: $693
Compare current foreclosures in Hot Springs Village, AR:
Size of family households: 4,458 2-persons, 323 3-persons, 379 4-persons, 103 5-persons, 34 6-persons, 52 7-or-more-persons.
Size of nonfamily households: 3,184 1-person, 583 2-persons.
795 married couples with children.
69 single-parent households (34 men, 35 women).
98.9% of residents of Hot Springs Village speak English at home.
1.1% of residents speak Spanish at home (84% speak English very well, 12% speak English well, 4% speak English not well).
0.9% of residents speak other Indo-European language at home (71% speak English very well, 29% speak English well).
0.2% of residents speak Asian or Pacific Island language at home (69% speak English very well, 11% speak English well, 20% don't speak English at all).
Foreign born population: 335 (2.0%)
(107.5% of them are naturalized citizens)
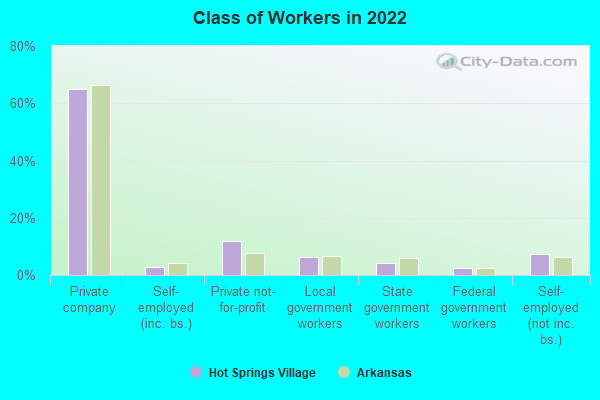
Percentage of workers working in this county: 74.2% Number of people working at home: 634 (15.5% of all workers)
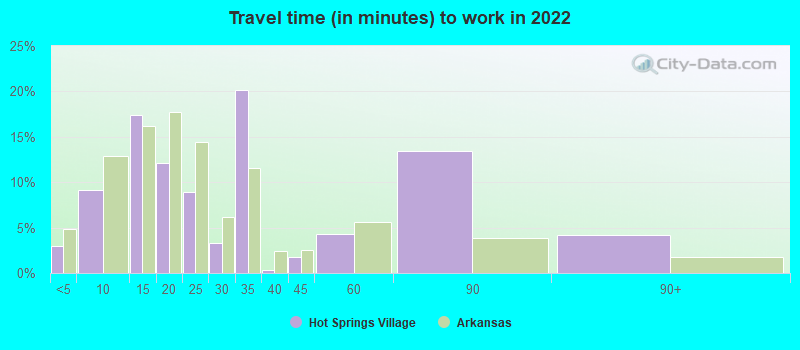
Travel time to work (commute)
Less than 5 minutes: 183
5 to 9 minutes: 268
10 to 14 minutes: 478
15 to 19 minutes: 561
20 to 24 minutes: 185
25 to 29 minutes: 297
30 to 34 minutes: 670
35 to 39 minutes: 91
40 to 44 minutes: 113
45 to 59 minutes: 432
60 to 89 minutes: 274
90 or more minutes: 133
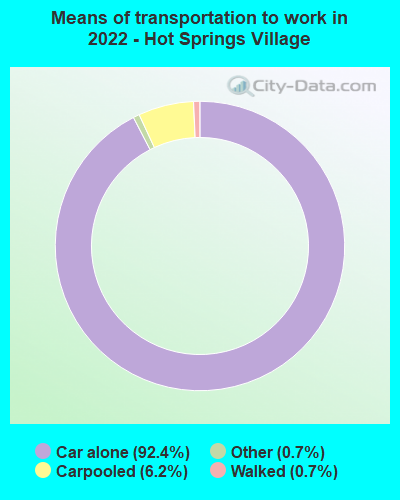
Means of transportation to work:
Drove a car alone: 2,671 (78.4%)
Carpooled: 157 (4.6%)
Taxi: 21 (0.6%)
Walked: 22 (0.6%)
Worked at home: 634 (18.6%)
Unemployment by race in 2022
Unemployment rate for White non-Hispanic residents
2.4%Males
1.4%Females
Unemployment rate for two or more race residents
8.0%Males
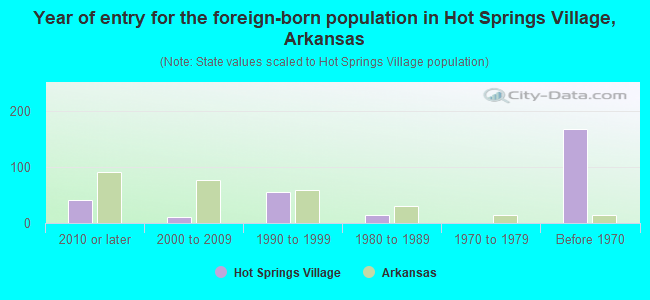
Year of entry for the foreign-born population in Hot Springs Village, Arkansas
412010 or later
102000 to 2009
551990 to 1999
141980 to 1989
01970 to 1979
168Before 1970
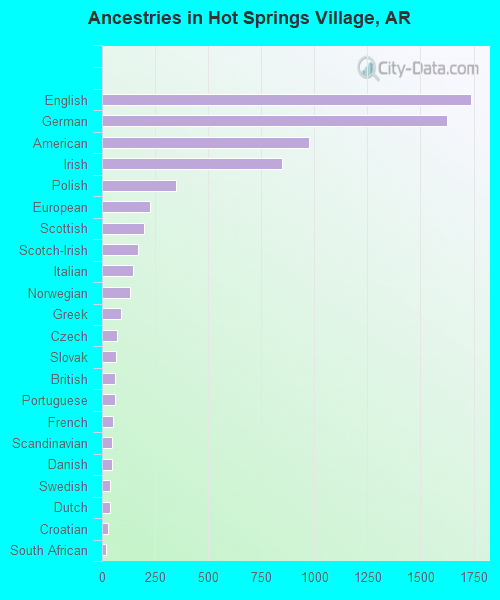
First ancestries reported:
English: 1,736 (21.5%)
German: 1,625 (20.1%)
American: 976 (12.1%)
Irish: 847 (10.5%)
Polish: 350 (4.3%)
European: 225 (2.8%)
Scottish: 197 (2.4%)
Scotch-Irish: 171 (2.1%)
Italian: 146 (1.8%)
Norwegian: 134 (1.7%)
Greek: 88 (1.1%)
Czech: 73 (0.9%)
Slovak: 68 (0.8%)
British: 63 (0.8%)
Portuguese: 60 (0.7%)
French: 54 (0.7%)
Scandinavian: 49 (0.6%)
Danish: 47 (0.6%)
Swedish: 37 (0.5%)
Dutch: 36 (0.4%)
Croatian: 28 (0.3%)
South African: 17 (0.2%)
Hungarian: 15 (0.2%)
Welsh: 14 (0.2%)
Belgian: 13 (0.2%)
Lebanese: 11 (0.1%)
French Canadian: 11 (0.1%)
Finnish: 10 (0.1%)
Czechoslovakian: 6 (0.07%)
Swiss: 6 (0.07%)
Canadian: 3 (0.04%)
Most common places of birth for foreign-born residents (%):
Germany
Hot Springs Village:
20.0% (71)
Arkansas:
1.8% (2,721)
United Kingdom, excluding England and Scotland
Hot Springs Village:
12.1% (43)
Arkansas:
0.8% (1,283)
Poland
Hot Springs Village:
9.0% (32)
Arkansas:
0.3% (451)
Canada
Hot Springs Village:
9.0% (32)
Arkansas:
1.4% (2,174)
Ireland
Hot Springs Village:
8.2% (29)
Arkansas:
0.2% (239)
Mexico
Hot Springs Village:
6.5% (23)
Arkansas:
40.2% (61,075)
Romania
Hot Springs Village:
5.1% (18)
Arkansas:
0.3% (403)
South Africa
Hot Springs Village:
3.9% (14)
Arkansas:
0.5% (800)
Greece
Hot Springs Village:
3.7% (13)
Arkansas:
0.1% (100)
England
Hot Springs Village:
2.8% (10)
Arkansas:
0.9% (1,434)
China, excluding Hong Kong and Taiwan
Hot Springs Village:
2.8% (10)
Arkansas:
2.3% (3,503)
Sweden
Hot Springs Village:
2.5% (9)
Arkansas:
0.1% (153)
Scotland
Hot Springs Village:
2.5% (9)
Arkansas:
0.3% (485)
Bolivia
Hot Springs Village:
2.5% (9)
Arkansas:
0.1% (149)
Guatemala
Hot Springs Village:
2.0% (7)
Arkansas:
3.5% (5,376)
Place of birth for U.S.-born residents:
This state: 4,146
Other state: 12,305
Northeast: 950
Midwest: 5,176
South: 4,365
West: 1,618
87.9% of Hot Springs Village residents lived in the same house 1 years ago. Out of people who lived in different houses, 12.7% lived in this county. Out of people who lived in different counties, 26.8% lived in Arkansas.
Hot Springs Village:
87.9%
State average:
87.0%
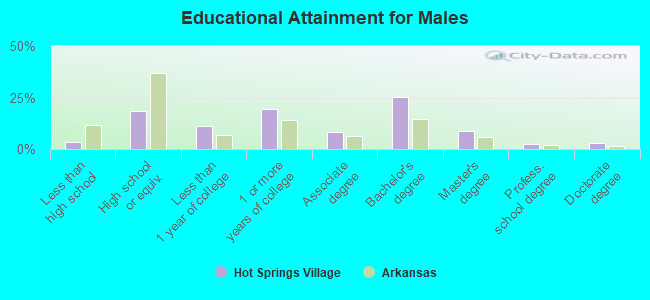
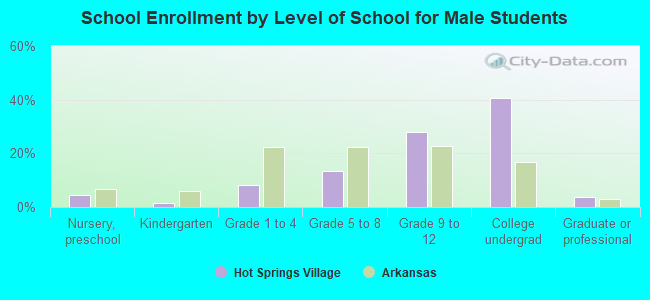
Education attainment for males 25 years and older:
No schooling: 41
Nursery to 4th grade: 0
5th and 6th grade: 0
7th and 8th grade: 18
9th grade: 61
10th grade: 32
11th grade: 44
12th grade, no diploma: 48
High school graduate (or equivalency): 1,237
Less than 1 year of college: 751
Some college more than 1 year, no degree: 1,303
Associate degree: 541
Bachelor's degree: 1,706
Master's degree: 579
Professional school degree: 172
Doctorate degree: 206
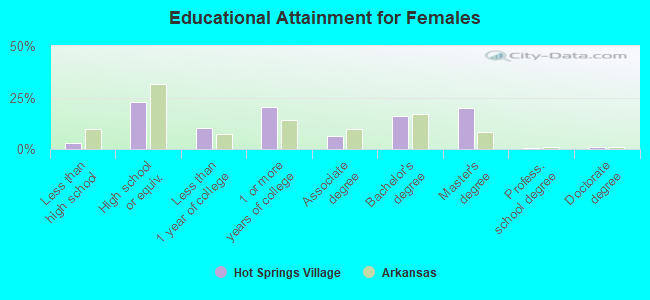
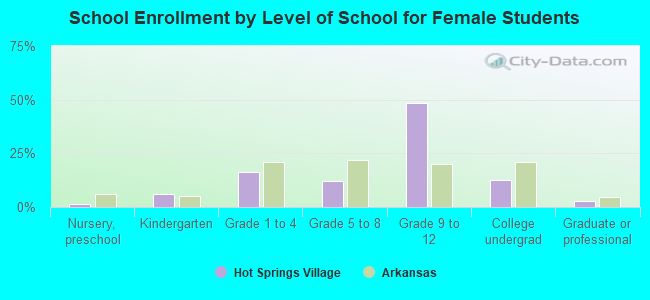
Education attainment for females 25 years and older:
No schooling: 4
Nursery to 4th grade: 0
5th and 6th grade: 13
7th and 8th grade: 8
9th grade: 0
10th grade: 21
11th grade: 85
12th grade, no diploma: 91
High school graduate (or equivalency): 1,889
Less than 1 year of college: 850
Some college more than 1 year, no degree: 1,709
Associate degree: 528
Bachelor's degree: 1,339
Master's degree: 1,666
Professional school degree: 50
Doctorate degree: 63
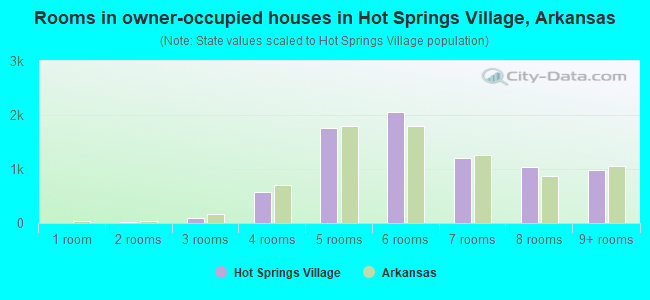
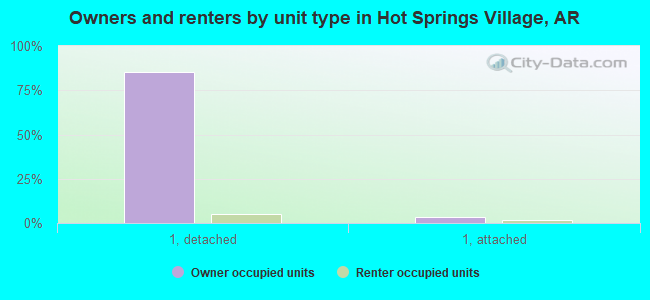
Housing units in structures:
One, detached: 8,512
One, attached: 650
Two: 110
3 or 4: 200
5 to 9: 80
20 to 49: 122
50 or more: 106
Mobile homes: 96
Median worth of mobile homes: $116,226
Housing units lacking complete plumbing facilities in 2022: 0.8%
Housing units lacking complete kitchen facilities in 2022: 2.5%