Housing density: 902 houses/condos per square mile
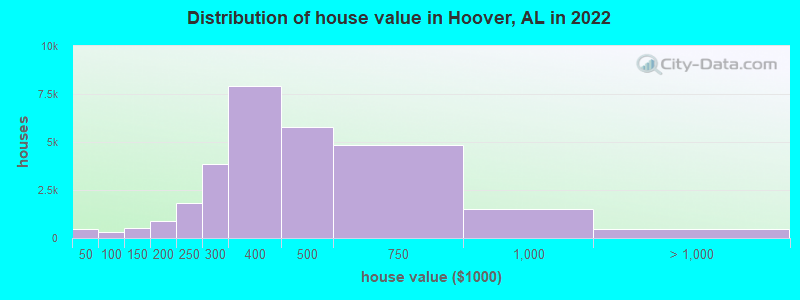
Median price asked for vacant for-sale houses and condos in 2022: $260,341.
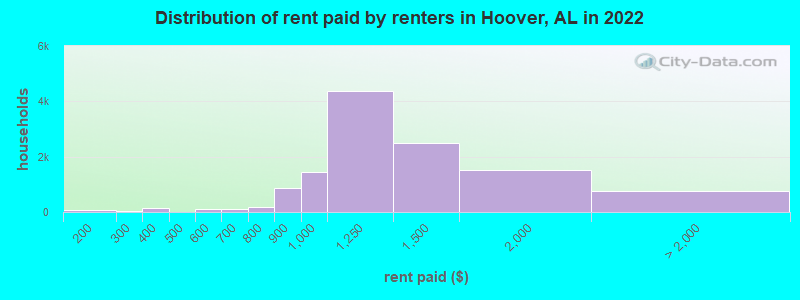
Median contract rent in 2022: $1,189 (lower quartile is $972, upper quartile is $1,479)
Median rent asked for vacant for-rent units in 2022: $1,118
Median gross rent in Hoover, AL in 2022: $1,417
Housing units in Hoover with a mortgage: 18,463 (1,723 second mortgage, 0 home equity loan, 1,533 both second mortgage and home equity loan) Houses without a mortgage: 418
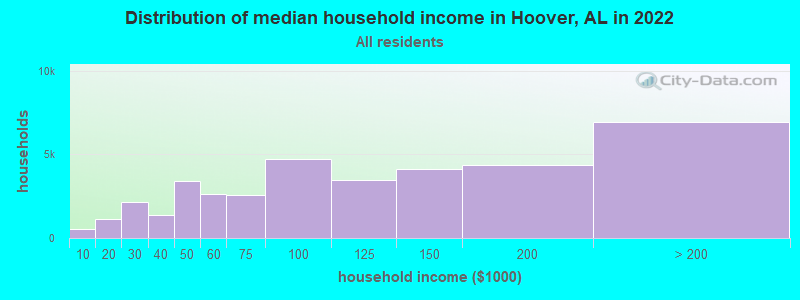
Median household income for houses/condos with a mortgage: $141,681
Median household income for apartments without a mortgage: $87,603
Size of family households: 11,607 2-persons, 7,819 3-persons, 4,439 4-persons, 2,254 5-persons, 255 6-persons, 480 7-or-more-persons.
Size of nonfamily households: 9,474 1-person, 1,114 2-persons.
16,614 married couples with children.
5,332 single-parent households (1,947 men, 3,385 women).
89.0% of residents of Hoover speak English at home.
4.1% of residents speak Spanish at home (60% speak English very well, 21% speak English well, 17% speak English not well, 2% don't speak English at all).
3.2% of residents speak other Indo-European language at home (74% speak English very well, 19% speak English well, 6% speak English not well, 1% don't speak English at all).
2.6% of residents speak Asian or Pacific Island language at home (70% speak English very well, 26% speak English well, 4% speak English not well).
1.7% of residents speak other language at home (80% speak English very well, 19% speak English well, 1% speak English not well).
Foreign born population: 6,932 (7.5%)
(51.2% of them are naturalized citizens)
Percentage of workers working in this county: 73.5% Number of people working at home: 7,657 (16.1% of all workers)
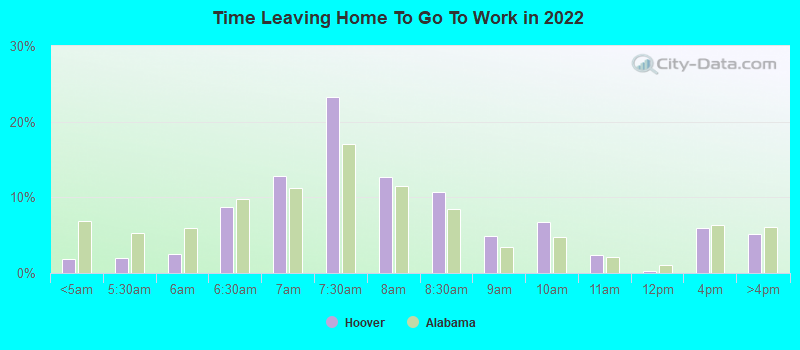
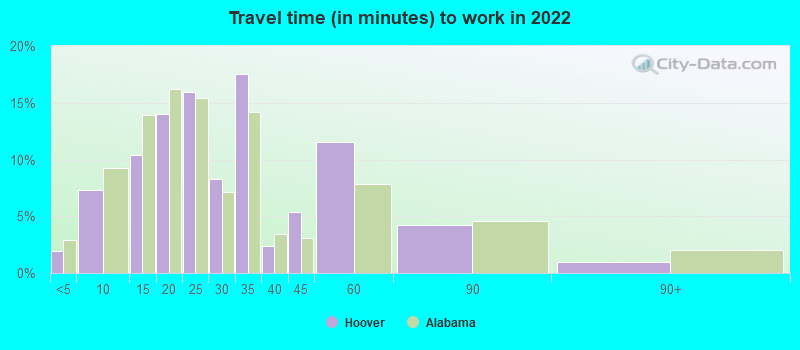
Travel time to work (commute)
Less than 5 minutes: 701
5 to 9 minutes: 2,076
10 to 14 minutes: 4,431
15 to 19 minutes: 6,411
20 to 24 minutes: 8,368
25 to 29 minutes: 5,213
30 to 34 minutes: 7,648
35 to 39 minutes: 1,449
40 to 44 minutes: 1,024
45 to 59 minutes: 1,991
60 to 89 minutes: 698
90 or more minutes: 546
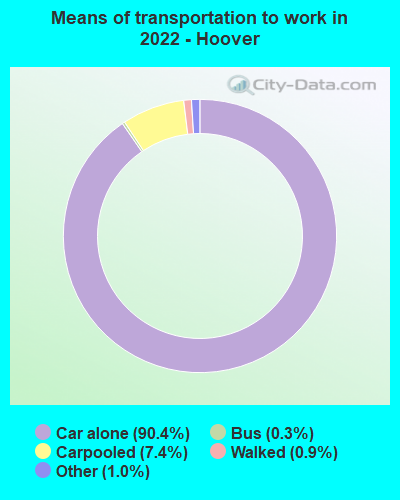
Means of transportation to work:
Drove a car alone: 32,072 (75.6%)
Carpooled: 2,733 (6.4%)
Bus: 119 (0.3%)
Subway or elevated rail: 28 (0.1%)
Taxi: 336 (0.8%)
Bicycle: 4 (0.0%)
Walked: 273 (0.6%)
Worked at home: 7,657 (18.1%)
Unemployment by race in 2022
Unemployment rate for White non-Hispanic residents
0.6%Males
0.5%Females
Unemployment rate for Black residents
3.4%Males
8.7%Females
Unemployment rate for Asian residents
3.1%Males
0.4%Females
Unemployment rate for two or more race residents
2.5%Females
Unemployment rate for Hispanic or Latino residents
1.4%Females
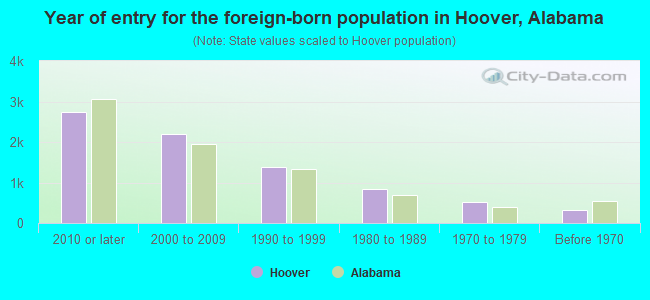
Year of entry for the foreign-born population in Hoover, Alabama
2,7352010 or later
2,1962000 to 2009
1,3951990 to 1999
8321980 to 1989
5111970 to 1979
329Before 1970
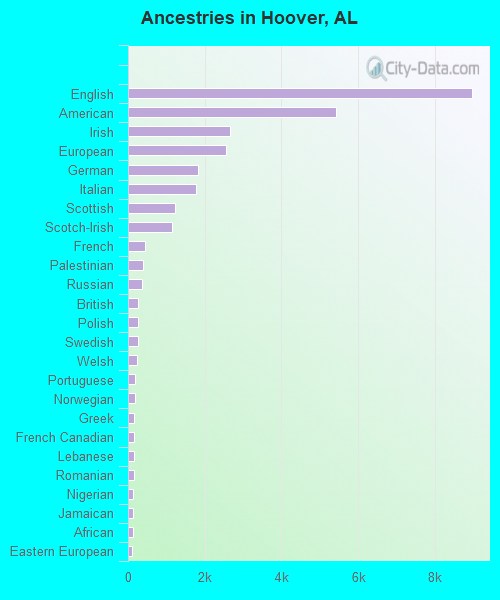
First ancestries reported:
English: 8,968 (17.9%)
American: 5,419 (10.8%)
Irish: 2,649 (5.3%)
European: 2,546 (5.1%)
German: 1,828 (3.6%)
Italian: 1,782 (3.5%)
Scottish: 1,225 (2.4%)
Scotch-Irish: 1,158 (2.3%)
French: 451 (0.9%)
Palestinian: 387 (0.8%)
Russian: 369 (0.7%)
British: 262 (0.5%)
Polish: 260 (0.5%)
Swedish: 259 (0.5%)
Welsh: 233 (0.5%)
Portuguese: 186 (0.4%)
Norwegian: 171 (0.3%)
Greek: 155 (0.3%)
French Canadian: 151 (0.3%)
Lebanese: 148 (0.3%)
Romanian: 148 (0.3%)
Nigerian: 133 (0.3%)
Jamaican: 132 (0.3%)
African: 125 (0.2%)
Eastern European: 100 (0.2%)
Dutch: 96 (0.2%)
Cajun: 94 (0.2%)
Northern European: 91 (0.2%)
Egyptian: 89 (0.2%)
Kenyan: 83 (0.2%)
Brazilian: 74 (0.1%)
Canadian: 61 (0.1%)
Turkish: 52 (0.1%)
Syrian: 51 (0.1%)
Scandinavian: 45 (0.09%)
Hungarian: 43 (0.09%)
Haitian: 43 (0.09%)
Lithuanian: 36 (0.07%)
Swiss: 33 (0.07%)
Guyanese: 26 (0.05%)
Latvian: 25 (0.05%)
Jordanian: 24 (0.05%)
Slovak: 21 (0.04%)
Czech: 19 (0.04%)
Slavic: 19 (0.04%)
Pennsylvania German: 18 (0.04%)
Danish: 17 (0.03%)
Bulgarian: 17 (0.03%)
Slovene: 16 (0.03%)
South African: 13 (0.03%)
Austrian: 13 (0.03%)
Belgian: 12 (0.02%)
Ukrainian: 10 (0.02%)
Iraqi: 9 (0.02%)
New Zealander: 8 (0.02%)
Croatian: 8 (0.02%)
Iranian: 5 (0.01%)
Most common places of birth for foreign-born residents (%):
India
Hoover:
16.0% (1,160)
Alabama:
5.5% (9,672)
Mexico
Hoover:
11.7% (849)
Alabama:
26.4% (46,832)
China, excluding Hong Kong and Taiwan
Hoover:
7.3% (529)
Alabama:
4.6% (8,075)
Pakistan
Hoover:
6.5% (473)
Alabama:
1.1% (2,005)
Korea
Hoover:
4.2% (308)
Alabama:
5.2% (9,293)
Vietnam
Hoover:
4.2% (308)
Alabama:
3.6% (6,414)
Brazil
Hoover:
3.9% (284)
Alabama:
1.1% (1,867)
Nepal
Hoover:
3.6% (261)
Alabama:
0.7% (1,235)
Kenya
Hoover:
3.4% (250)
Alabama:
0.8% (1,389)
Colombia
Hoover:
2.8% (201)
Alabama:
1.1% (2,005)
Venezuela
Hoover:
2.8% (200)
Alabama:
1.0% (1,740)
Canada
Hoover:
2.2% (157)
Alabama:
2.3% (4,000)
Philippines
Hoover:
2.1% (155)
Alabama:
2.9% (5,154)
Israel
Hoover:
1.8% (130)
Alabama:
0.1% (197)
Kuwait
Hoover:
1.6% (117)
Alabama:
0.1% (129)
England
Hoover:
1.6% (114)
Alabama:
1.1% (1,877)
Place of birth for U.S.-born residents:
This state: 57,245
Other state: 27,123
Northeast: 3,064
Midwest: 4,907
South: 15,539
West: 3,613
85.8% of Hoover residents lived in the same house 1 years ago. Out of people who lived in different houses, 31.7% lived in this county. Out of people who lived in different counties, 67.6% lived in Alabama.
Hoover:
85.8%
State average:
87.6%
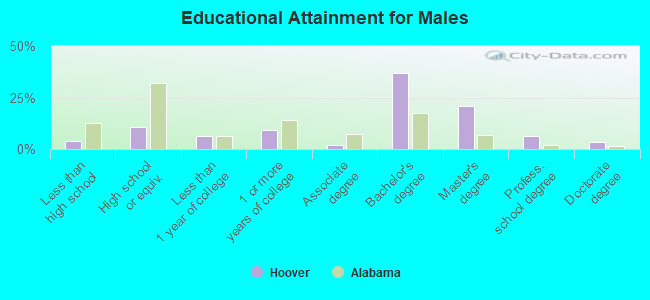
Education attainment for males 25 years and older:
No schooling: 206
Nursery to 4th grade: 0
5th and 6th grade: 4
7th and 8th grade: 47
9th grade: 258
10th grade: 93
11th grade: 0
12th grade, no diploma: 440
High school graduate (or equivalency): 2,897
Less than 1 year of college: 1,810
Some college more than 1 year, no degree: 2,622
Associate degree: 516
Bachelor's degree: 10,307
Master's degree: 5,766
Professional school degree: 1,785
Doctorate degree: 1,005
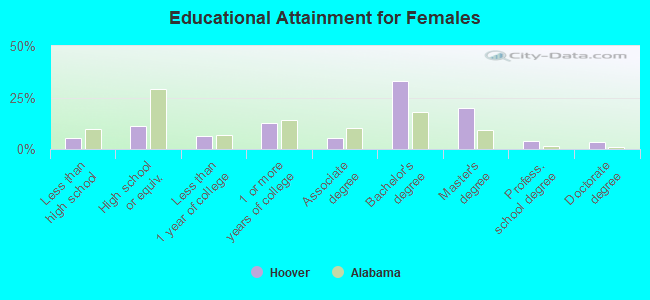
Education attainment for females 25 years and older:
No schooling: 123
Nursery to 4th grade: 131
5th and 6th grade: 87
7th and 8th grade: 146
9th grade: 223
10th grade: 244
11th grade: 194
12th grade, no diploma: 686
High school graduate (or equivalency): 3,808
Less than 1 year of college: 2,190
Some college more than 1 year, no degree: 4,304
Associate degree: 1,777
Bachelor's degree: 11,399
Master's degree: 6,817
Professional school degree: 1,326
Doctorate degree: 1,200
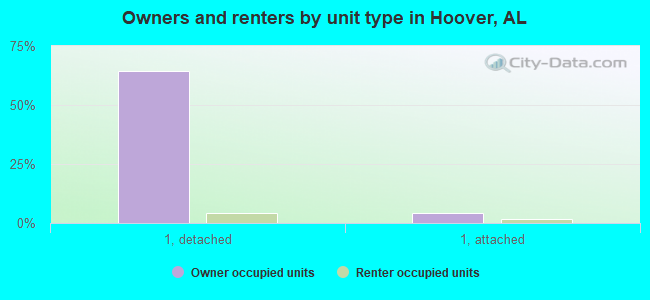
Housing units in structures:
One, detached: 28,048
One, attached: 1,128
3 or 4: 704
5 to 9: 2,236
10 to 19: 4,107
20 to 49: 1,169
50 or more: 1,408
Mobile homes: 93
Housing units lacking complete plumbing facilities in 2022: 0.6%