Highlands-Baywood Park, CA (California) Houses and Residents
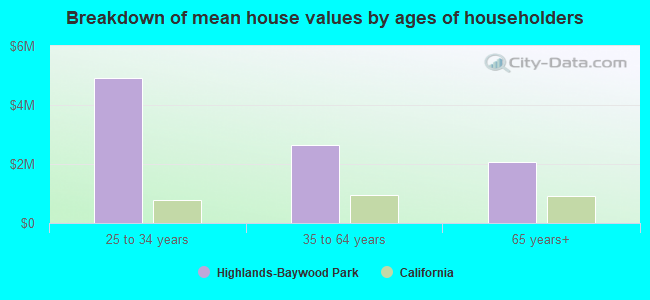
| Highlands-Baywood Park: | $2,273,784 |
| California: | $715,900 |
Mean price in 2022:
Detached houses: $2,393,814
Here: $2,393,814 State: $988,808 Townhouses or other attached units: $1,464,666
Here: $1,464,666 State: $838,546
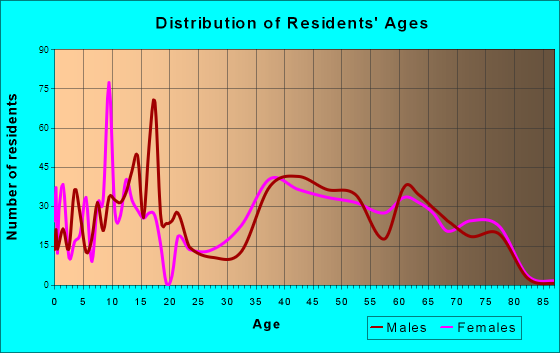
Total population: 4,027 (All urban)
Houses: 1,640 (1,613 occupied: 1,407 owner occupied, 204 renter occupied)
| % of renters here: | 13% |
| State: | 44% |
Housing density: 912 houses/condos per square mile
Median price asked for vacant for-sale houses and condos in 2022 in this county: $912,464.
Median contract rent in 2022: over $2,000
Median gross rent in Highlands-Baywood Park, CA in 2022: over $2,000
Housing units in Highlands-Baywood Park with a mortgage: 893 (31 second mortgage, 220 home equity loan, 16 both second mortgage and home equity loan)
Houses without a mortgage: 466
Median household income for houses/condos with a mortgage: $314,334
Median household income for apartments without a mortgage: $195,637
Median monthly housing costs: $3,700
Compare current foreclosures near Highlands-Baywood Park, CA:
| Photo | Address | Area | Beds / Baths | Price | Details |
|---|---|---|---|---|---|

|
#1
Wickman Pl
San Lorenzo, CA 94580
|
900 sq. feet
|
1 baths 2 beds |
show details | |

|
#2
Woodside Way Apt
San Mateo, CA 94401
|
4,387 sq. feet
|
5 baths 8 beds |
show details | |

|
#3
Vienna St
San Francisco, CA 94112
|
760 sq. feet
|
1 baths 3 beds |
show details | |

|
#4
Raymond Ave
San Francisco, CA 94134
|
975 sq. feet
|
1 baths 3 beds |
show details | |

|
#5
Alameda De Las Pulgas
Redwood City, CA 94061
|
1,250 sq. feet
|
2 baths 3 beds |
show details | |

|
#6
Hemlock Ave
Redwood City, CA 94061
|
1,440 sq. feet
|
2 baths 4 beds |
show details | |

|
#7
Hempstead Pl
Redwood City, CA 94061
|
1,020 sq. feet
|
1 baths 3 beds |
show details | |

|
#8
7th Ave
Menlo Park, CA 94025
|
1,689 sq. feet
|
2 baths 3 beds |
show details | |

|
#9
Mulberry St
Newark, CA 94560
|
984 sq. feet
|
1 baths 3 beds |
show details | |

|
#10
Fleetwood Dr
San Bruno, CA 94066
|
1,440 sq. feet
|
3 baths 5 beds |
show details |
| Photo | Address | Area | Beds / Baths | Price | Details |
|---|---|---|---|---|---|

|
#11
Vermont St
San Francisco, CA 94107
|
1,520 sq. feet
|
2 baths 2 beds |
show details | |

|
#12
Saratoga Ave
Palo Alto, CA 94303
|
750 sq. feet
|
1 baths 3 beds |
show details | |

|
#13
Manor Dr
Pacifica, CA 94044
|
1,360 sq. feet
|
2 baths 3 beds |
show details | |

|
#14
Cymbidium Cir
South San Francisco, CA 94080
|
1,610 sq. feet
|
2 baths 3 beds |
show details | |

|
#15
Cedar Ct
Daly City, CA 94014
|
1,200 sq. feet
|
2 baths 3 beds |
show details | |

|
#16
Harkness Ave
San Francisco, CA 94134
|
1,412 sq. feet
|
2 baths 3 beds |
show details | |

|
#17
Chestnut St
San Carlos, CA 94070
|
1,390 sq. feet
|
2 baths 3 beds |
show details | |

|
#18
Hollister Ave
San Francisco, CA 94124
|
1,000 sq. feet
|
3 baths 5 beds |
show details | |

|
#19
Munich St
San Francisco, CA 94112
|
1,103 sq. feet
|
1 baths 2 beds |
show details | |

|
#20
Madrid St
San Francisco, CA 94112
|
1,018 sq. feet
|
1 baths 4 beds |
show details |
| Photo | Address | Area | Beds / Baths | Price | Details |
|---|---|---|---|---|---|

|
#21
Cayuga Ave
San Francisco, CA 94112
|
1,340 sq. feet
|
1 baths 3 beds |
show details | |

|
#22
Quesada Ave
San Francisco, CA 94124
|
2,220 sq. feet
|
4 baths 10 beds |
show details | |

|
#23
Lobos St
San Francisco, CA 94112
|
750 sq. feet
|
1 baths 2 beds |
show details | |

|
#24
Minerva St
San Francisco, CA 94112
|
878 sq. feet
|
1 baths 2 beds |
show details | |

|
#25
Madrid St
San Francisco, CA 94112
|
1,745 sq. feet
|
2 baths 3 beds |
show details | |

|
#26
Endicott St
San Leandro, CA 94579
|
1,164 sq. feet
|
1 baths 2 beds |
show details | |

|
#27
Byxbee St
San Francisco, CA 94132
|
800 sq. feet
|
1 baths 1 beds |
show details | |

|
#28
Lorenzo Ave
San Lorenzo, CA 94580
|
2,037 sq. feet
|
2 baths 2 beds |
show details | |

|
#29
Lorenzo Ave
San Lorenzo, CA 94580
|
1,937 sq. feet
|
1 baths 3 beds |
show details | |

|
#30
Holloway Ave
San Francisco, CA 94132
|
1,110 sq. feet
|
5 baths 1 beds |
show details |
| Photo | Address | Area | Beds / Baths | Price | Details |
|---|---|---|---|---|---|

|
#31
Mirada Rd
Half Moon Bay, CA 94019
|
2,450 sq. feet
|
4 baths 4 beds |
show details | |

|
#32
Peralta Ave
San Francisco, CA 94110
|
1,222 sq. feet
|
1 baths 2 beds |
show details | |

|
#33
S Humboldt St
San Mateo, CA 94401
|
1,290 sq. feet
|
2 baths 3 beds |
show details | |

|
#34
Newbridge Ave
San Mateo, CA 94401
|
1,300 sq. feet
|
2 baths 3 beds |
show details | |

|
#35
Laurel Ave Apt 4
Hayward, CA 94541
|
1,050 sq. feet
|
2 baths 3 beds |
show details | |

|
#36
Sweetwood Dr
Daly City, CA 94015
|
1,140 sq. feet
|
1 baths 3 beds |
show details | |

|
#37
Timothy Dr
San Leandro, CA 94577
|
1,028 sq. feet
|
1 baths 3 beds |
show details | |

|
#38
Crestline Ave
Daly City, CA 94015
|
1,060 sq. feet
|
1 baths 2 beds |
show details | |

|
#39
Crestline Ave
Daly City, CA 94015
|
1,060 sq. feet
|
1 baths 2 beds |
show details | |

|
#40
Flamingo Ave
Hayward, CA 94544
|
1,041 sq. feet
|
1 baths 3 beds |
show details |
| Photo | Address | Area | Beds / Baths | Price | Details |
|---|---|---|---|---|---|

|
#41
Cielito Dr
San Francisco, CA 94134
|
1,057 sq. feet
|
1 baths 2 beds |
show details | |

|
#42
Pansy St
San Leandro, CA 94578
|
843 sq. feet
|
1 baths 3 beds |
show details | |

|
#43
Wabash Ter
San Francisco, CA 94134
|
1,200 sq. feet
|
2 baths 3 beds |
show details | |

|
#44
Stanford Ct
Los Altos, CA 94022
|
3,303 sq. feet
|
3 baths 4 beds |
show details | |

|
#45
Higate Dr
Daly City, CA 94015
|
2,230 sq. feet
|
3 baths 4 beds |
show details | |

|
#46
Mateo Ave
Daly City, CA 94014
|
1,370 sq. feet
|
2 baths 3 beds |
show details | |

|
#47
Wyandotte Ave
Daly City, CA 94014
|
1,680 sq. feet
|
2 baths 3 beds |
show details | |

|
#48
1st Ave
Daly City, CA 94014
|
1,460 sq. feet
|
2 baths 3 beds |
show details | |

|
#49
Ford St
Daly City, CA 94014
|
1,770 sq. feet
|
1 baths 3 beds |
show details | |

|
Check over 1 million property listings on Foreclosure.com!
|
browse all offers | |||


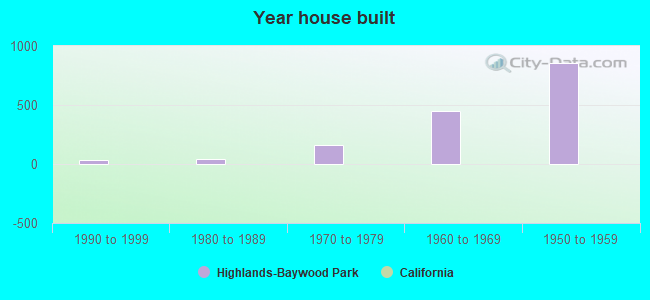
Median year apartment built: 1962
Household type by relationship:
Households: 4,770- Male householders: 868 (85 living alone), Female householders: 702 (112 living alone)
1,126 spouses (1,115 opposite-sex spouses), 59 unmarried partners, (54 opposite-sex unmarried partners), 1,550 children (1,505 natural, 0 adopted, 45 stepchildren), 75 grandchildren, 16 brothers or sisters, 70 parents, 0 foster children, 21 other relatives, 98 non-relatives
- In group quarters: 183
Size of family households: 481 2-persons, 313 3-persons, 414 4-persons, 77 5-persons, 9 6-persons, 5 7-or-more-persons.
Size of nonfamily households: 205 1-person, 98 2-persons, 6 3-persons.
822 married couples with children.
85 single-parent households (60 men, 25 women).
72.9% of residents of Highlands-Baywood Park speak English at home.
3.9% of residents speak Spanish at home (87% speak English very well, 13% speak English well).
11.5% of residents speak other Indo-European language at home (88% speak English very well, 8% speak English well, 3% speak English not well, 1% don't speak English at all).
12.9% of residents speak Asian or Pacific Island language at home (61% speak English very well, 35% speak English well, 3% speak English not well, 1% don't speak English at all).
0.5% of residents speak other language at home (83% speak English very well, 17% speak English well).
Foreign born population: 1,114 (23.4%)
(90.0% of them are naturalized citizens)
| Here: | 6.9 |
| State: | 6.0 |
| Here: | 4.8 |
| State: | 3.9 |
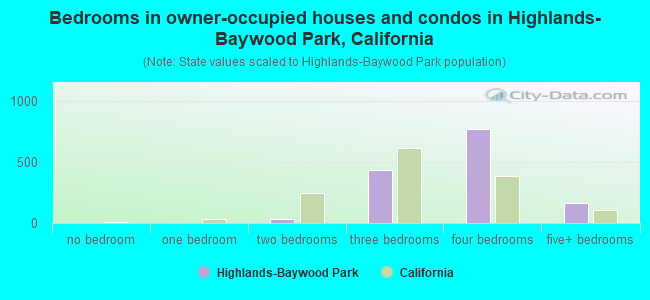
- Bedrooms in owner-occupied houses and condos in Highlands-Baywood Park, California
- 0no bedroom
- 01 bedroom
- 332 bedrooms
- 4383 bedrooms
- 7744 bedrooms
- 1625+ bedrooms
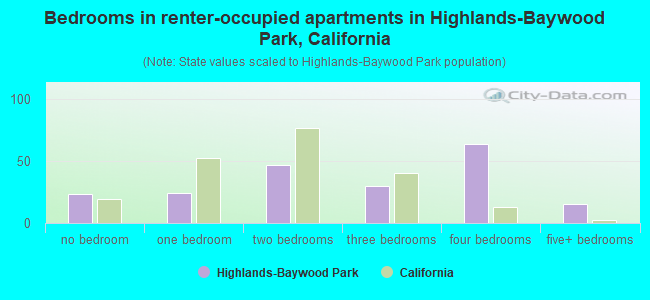
- Bedrooms in renter-occupied apartments in Highlands-Baywood Park, California
- 24no bedroom
- 251 bedroom
- 472 bedrooms
- 303 bedrooms
- 644 bedrooms
- 155+ bedrooms
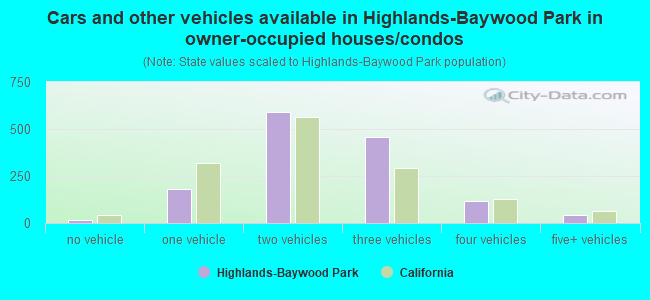
- Cars and other vehicles available in Highlands-Baywood Park in owner-occupied houses/condos
- 14no vehicle
- 1811 vehicle
- 5922 vehicles
- 4583 vehicles
- 1174 vehicles
- 455+ vehicles
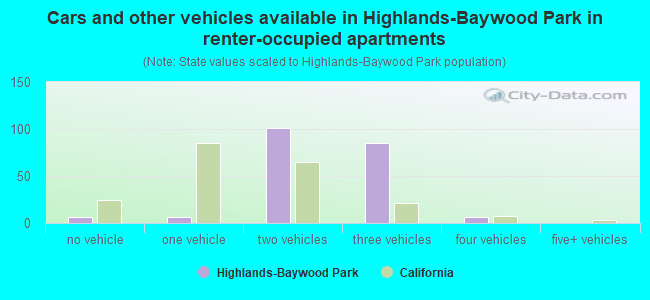
- Cars and other vehicles available in Highlands-Baywood Park in renter-occupied apartments
- 6no vehicle
- 61 vehicle
- 1012 vehicles
- 853 vehicles
- 64 vehicles
- 05+ vehicles
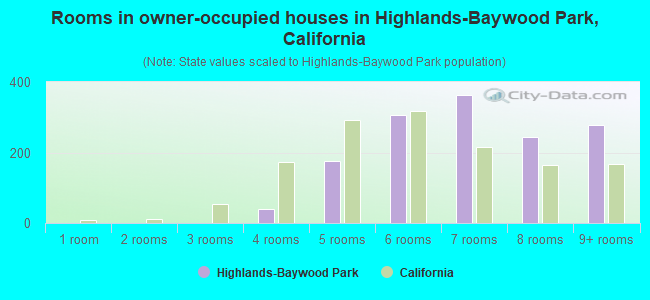
- Rooms in owner-occupied houses in Highlands-Baywood Park, California
- 01 room
- 02 rooms
- 03 rooms
- 394 rooms
- 1775 rooms
- 3076 rooms
- 3627 rooms
- 2458 rooms
- 2779+ rooms
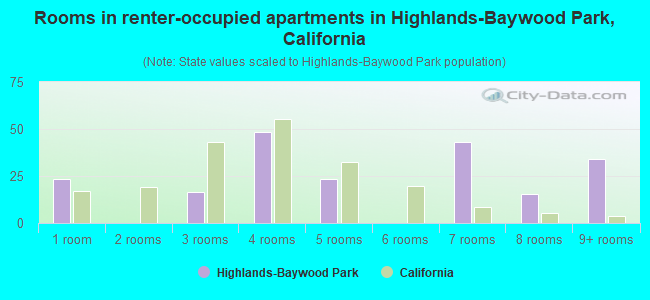
- Rooms in renter-occupied apartments in Highlands-Baywood Park, California
- 241 room
- 02 rooms
- 163 rooms
- 484 rooms
- 245 rooms
- 06 rooms
- 437 rooms
- 158 rooms
- 349+ rooms
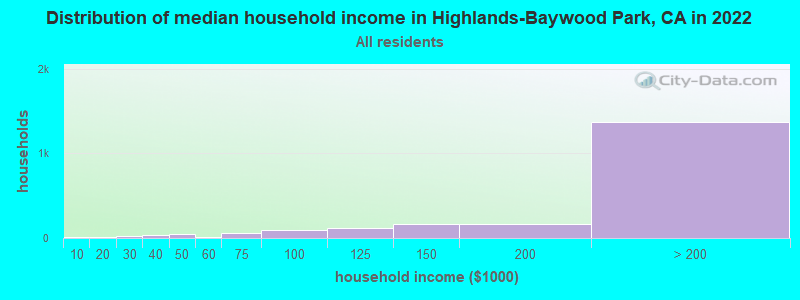
Highlands-Baywood Park, CA household income distribution

- 17Less than $10,000
- 14$10,000 to $19,999
- 27$20,000 to $29,999
- 35$30,000 to $39,999
- 53$40,000 to $49,999
- 17$50,000 to $59,999
- 60$60,000 to $74,999
- 89$75,000 to $99,999
- 123$100,000 to $124,999
- 167$125,000 to $149,999
- 171$150,000 to $199,999
- 1,371$200,000 or more
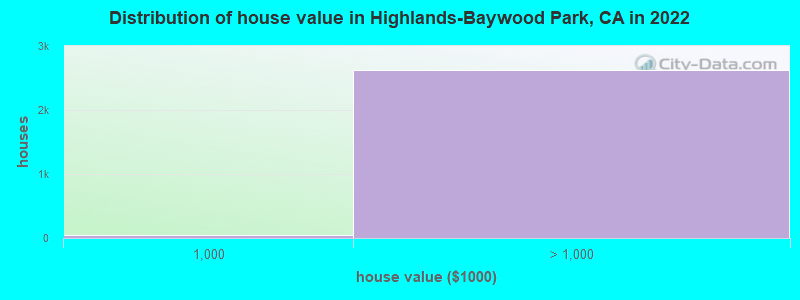
Home value of owner - occupied houses in 2022 in Highlands-Baywood Park, CA
-
- 5Less than $10,000
- 3$125,000 to $149,999
- 1$150,000 to $174,999
- 2$200,000 to $249,999
- 8$500,000 to $749,999
- 50$750,000 to $999,999
- 629$1,000,000 to $1,499,999
- 1,253$1,500,000 to $1,999,999
- 737$2,000,000 or more
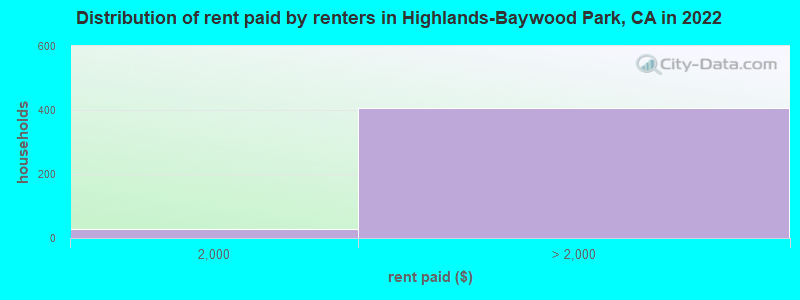
Rent paid by renters in 2022 in Highlands-Baywood Park, CA
-
- 27$1,500 to $1,999
- 181$2,000 to $2,499
- 53$3,000 to $3,499
- 171$3,500 or more
Percentage of workers working in this county: 58.0%
Number of people working at home: 418 (17.5% of all workers)
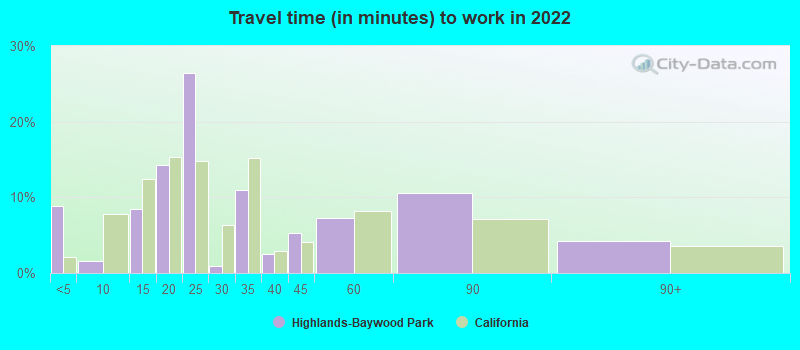
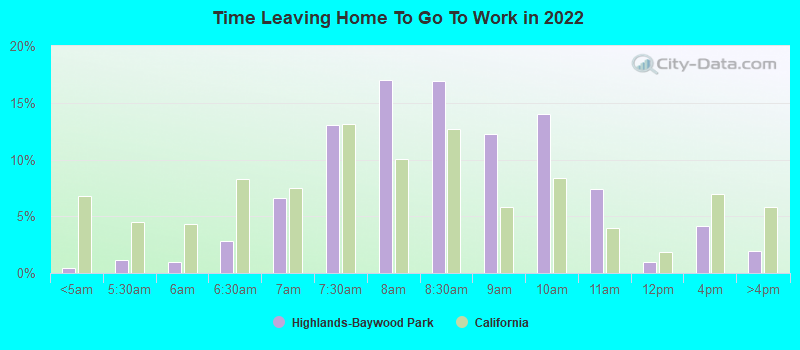
Travel time to work (commute)
- Less than 5 minutes: 78
- 5 to 9 minutes: 58
- 10 to 14 minutes: 87
- 15 to 19 minutes: 310
- 20 to 24 minutes: 409
- 25 to 29 minutes: 101
- 30 to 34 minutes: 297
- 35 to 39 minutes: 142
- 40 to 44 minutes: 163
- 45 to 59 minutes: 192
- 60 to 89 minutes: 199
- 90 or more minutes: 26
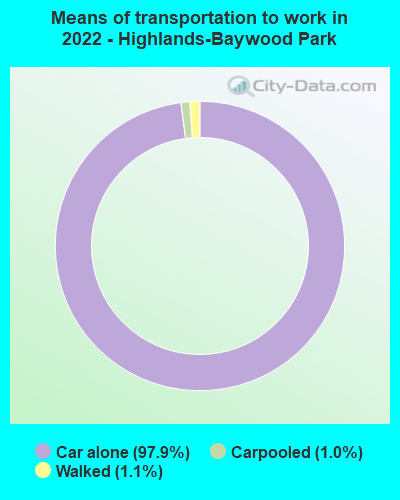
Means of transportation to work:
- Drove a car alone: 670 (74.6%)
- Carpooled: 6 (0.7%)
- Walked: 6 (0.7%)
- Worked at home: 418 (46.5%)
- Unemployment by race in 2022
- Unemployment rate for White non-Hispanic residents
- 3.9%Males
- 8.6%Females
- Unemployment rate for Asian residents
- 1.2%Males
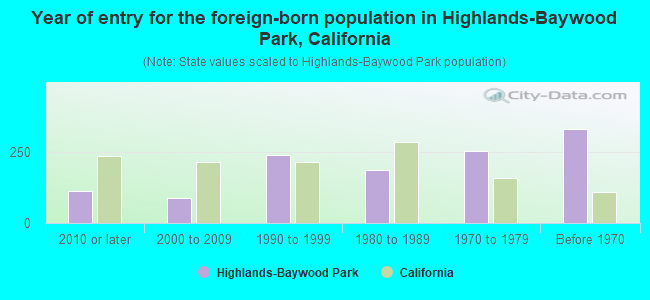
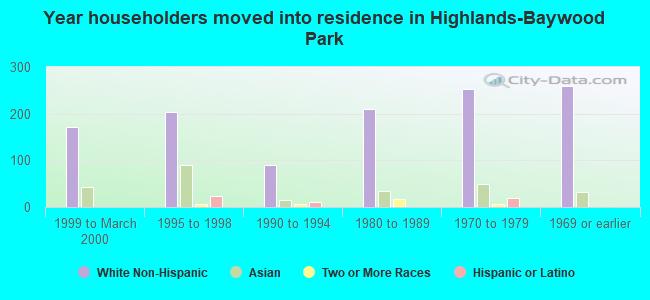
- Year of entry for the foreign-born population in Highlands-Baywood Park, California
- 1132010 or later
- 872000 to 2009
- 2391990 to 1999
- 1841980 to 1989
- 2521970 to 1979
- 329Before 1970
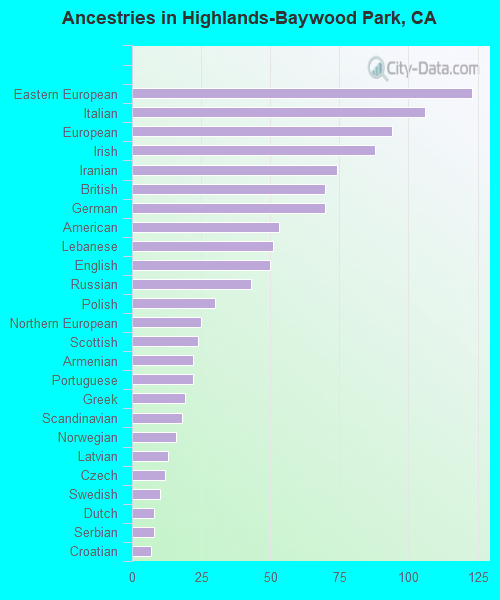
First ancestries reported:
- Eastern European: 123 (5.2%)
- Italian: 106 (4.5%)
- European: 94 (4.0%)
- Irish: 88 (3.7%)
- Iranian: 74 (3.1%)
- British: 70 (3.0%)
- German: 70 (3.0%)
- American: 53 (2.2%)
- Lebanese: 51 (2.2%)
- English: 50 (2.1%)
- Russian: 43 (1.8%)
- Polish: 30 (1.3%)
- Northern European: 25 (1.1%)
- Scottish: 24 (1.0%)
- Armenian: 22 (0.9%)
- Portuguese: 22 (0.9%)
- Greek: 19 (0.8%)
- Scandinavian: 18 (0.8%)
- Norwegian: 16 (0.7%)
- Latvian: 13 (0.6%)
- Czech: 12 (0.5%)
- Swedish: 10 (0.4%)
- Dutch: 8 (0.3%)
- Serbian: 8 (0.3%)
- Croatian: 7 (0.3%)
- Lithuanian: 4 (0.2%)
- Palestinian: 3 (0.1%)
- French: 3 (0.1%)
- Canadian: 2 (0.08%)
Most common places of birth for foreign-born residents (%):
| Highlands-Baywood Park: | 13.5% (149) |
| California: | 100.0% (-1) |
| Highlands-Baywood Park: | 11.0% (122) |
| California: | 100.0% (-1) |
| Highlands-Baywood Park: | 9.5% (105) |
| California: | 100.0% (-1) |
| Highlands-Baywood Park: | 6.6% (73) |
| California: | 100.0% (-1) |
| Highlands-Baywood Park: | 6.2% (69) |
| California: | 100.0% (-1) |
| Highlands-Baywood Park: | 5.9% (65) |
| California: | 100.0% (-1) |
| Highlands-Baywood Park: | 5.6% (62) |
| California: | 100.0% (-1) |
| Highlands-Baywood Park: | 4.0% (44) |
| California: | 100.0% (-1) |
| Highlands-Baywood Park: | 3.1% (34) |
| California: | 100.0% (-1) |
| Highlands-Baywood Park: | 3.1% (34) |
| California: | 100.0% (-1) |
| Highlands-Baywood Park: | 3.1% (34) |
| California: | 100.0% (-1) |
| Highlands-Baywood Park: | 3.0% (33) |
| California: | 100.0% (-1) |
| Highlands-Baywood Park: | 2.4% (27) |
| California: | 100.0% (-1) |
| Highlands-Baywood Park: | 2.3% (25) |
| California: | 100.0% (-1) |
| Highlands-Baywood Park: | 2.1% (23) |
| California: | 100.0% (-1) |
| Highlands-Baywood Park: | 2.1% (23) |
| California: | 100.0% (-1) |
| Highlands-Baywood Park: | 2.0% (22) |
| California: | 100.0% (-1) |
| Highlands-Baywood Park: | 1.8% (20) |
| California: | 100.0% (-1) |
| Highlands-Baywood Park: | 1.8% (20) |
| California: | 100.0% (-1) |
Place of birth for U.S.-born residents:
- This state: 2,538
- Other state: 1,009
- Northeast: 468
- Midwest: 240
- South: 159
- West: 143
89.8% of Highlands-Baywood Park residents lived in the same house 1 years ago.
Out of people who lived in different houses, 42.4% lived in this county.
Out of people who lived in different counties, 63.8% lived in California.
| Highlands-Baywood Park: | 89.8% |
| State average: | 88.9% |
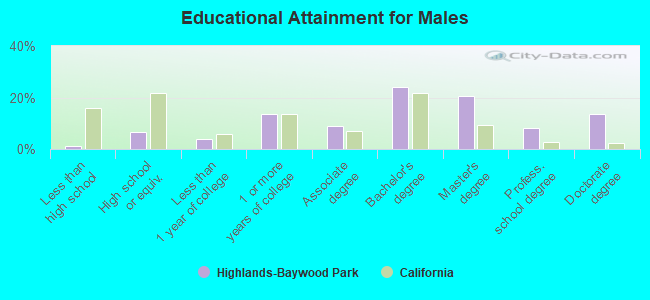
Education attainment for males 25 years and older:
- No schooling: 5
- Nursery to 4th grade: 0
- 5th and 6th grade: 0
- 7th and 8th grade: 1
- 9th grade: 0
- 10th grade: 0
- 11th grade: 0
- 12th grade, no diploma: 14
- High school graduate (or equivalency): 118
- Less than 1 year of college: 68
- Some college more than 1 year, no degree: 241
- Associate degree: 159
- Bachelor's degree: 428
- Master's degree: 370
- Professional school degree: 146
- Doctorate degree: 241
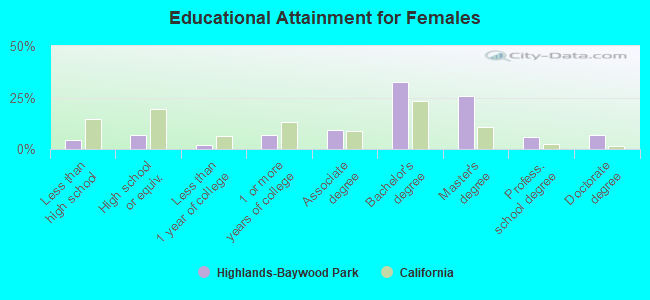
Education attainment for females 25 years and older:
- No schooling: 9
- Nursery to 4th grade: 12
- 5th and 6th grade: 0
- 7th and 8th grade: 14
- 9th grade: 6
- 10th grade: 0
- 11th grade: 0
- 12th grade, no diploma: 36
- High school graduate (or equivalency): 115
- Less than 1 year of college: 37
- Some college more than 1 year, no degree: 121
- Associate degree: 158
- Bachelor's degree: 574
- Master's degree: 452
- Professional school degree: 104
- Doctorate degree: 115
Housing units in structures:
- One, detached: 1,519
- One, attached: 20
- 3 or 4: 5
- 20 to 49: 16
- 50 or more: 79
House/condo owner moved in on average 21 years ago
Renter moved in on average 0 years ago
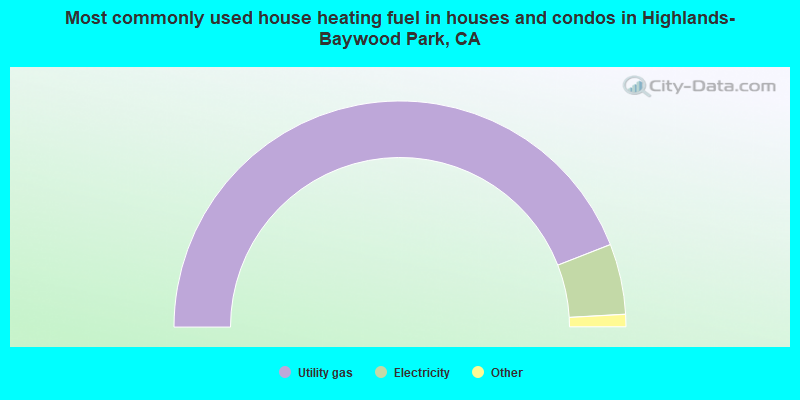
- 88.3%Utility gas
- 10.1%Electricity
- 0.6%No fuel used
- 0.4%Other fuel
- 0.4%Solar energy
- 0.3%Bottled, tank, or LP gas
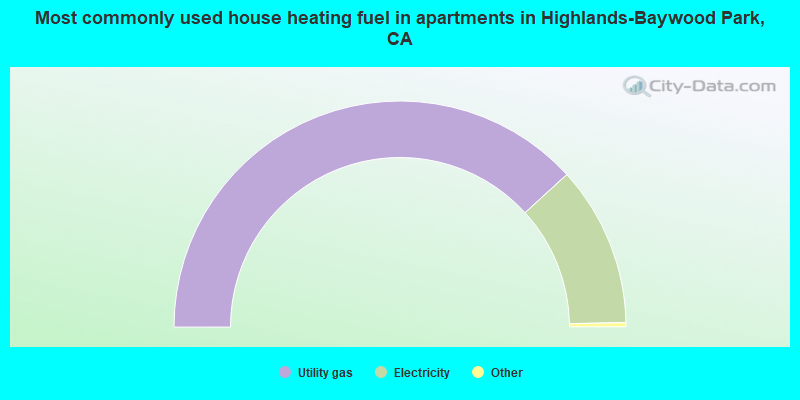
- 76.9%Utility gas
- 23.1%Electricity
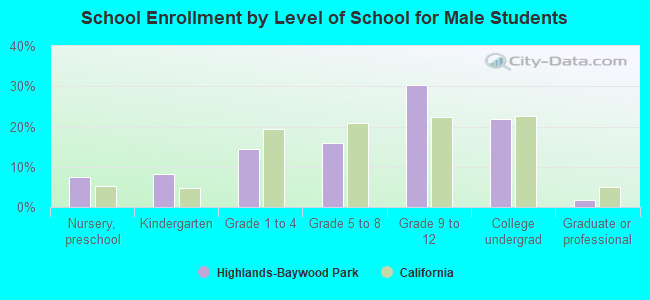
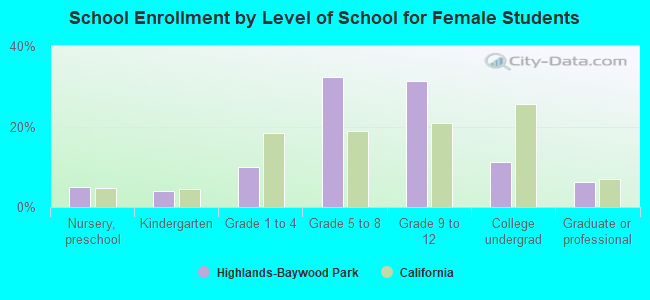
Private vs. public school enrollment:
| Here: | 34.2% |
| California: | 10.5% |
| Here: | 30.4% |
| California: | 8.5% |
| Here: | 36.8% |
| California: | 15.9% |