Heber, UT (Utah) Houses and Residents
| Heber: | $591,452 |
| Utah: | $499,500 |
Mean price in 2022:
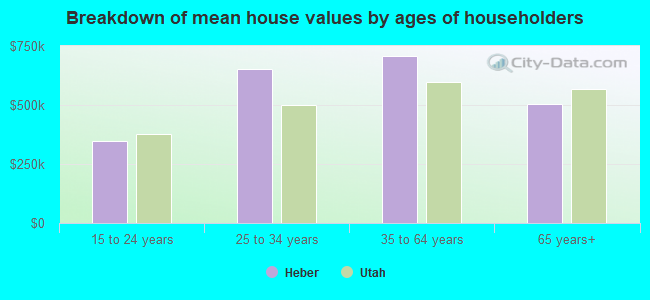
Detached houses: $674,391
Here: $674,391 State: $607,750 Townhouses or other attached units: $461,264
Here: $461,264 State: $444,505 In 5-or-more-unit structures: $238,395
Here: $238,395 State: $412,810 Mobile homes: $22,547
Here: $22,547 State: $113,475
Total population: 13,599 (Urban population: 7,136 (all inside urban clusters), Rural population: 0)
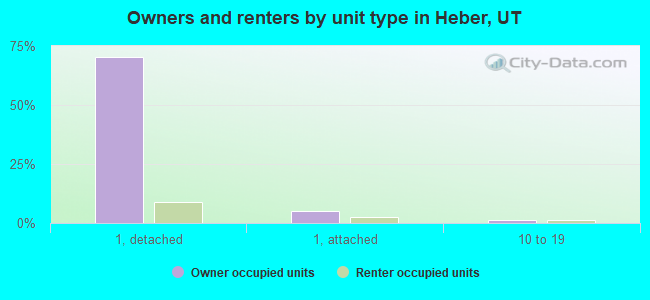
Houses: 5,499 (5,262 occupied: 4,139 owner occupied, 1,153 renter occupied)
| % of renters here: | 22% |
| State: | 29% |
Housing density: 1,594 houses/condos per square mile
Median price asked for vacant for-sale houses and condos in 2022 in this county: $2,749,691.
Median contract rent in 2022: $1,308 (lower quartile is $989, upper quartile is $1,859)
Median rent asked for vacant for-rent units in 2022: $1,149
Median gross rent in Heber, UT in 2022: $1,491
Housing units in Heber with a mortgage: 2,981 (462 second mortgage, 70 home equity loan, 359 both second mortgage and home equity loan)
Houses without a mortgage: 40
Median household income for houses/condos with a mortgage: $116,723
Median household income for apartments without a mortgage: $91,647
Median monthly housing costs: $1,698
Compare current foreclosures near Heber, UT:
| Photo | Address | Area | Beds / Baths | Price | Details |
|---|---|---|---|---|---|

|
#1
Solamere Dr
Park City, UT 84060
|
5,310 sq. feet
|
5 baths - beds |
show details | |

|
#2
W 300 S
Heber City, UT 84032
|
- sq. feet
|
- baths - beds |
show details | |

|
#3
Park Ave, Ste 4 Pmb 221
Park City, UT 84060
|
- sq. feet
|
- baths - beds |
show details | |

|
#4
E Highway 150
Kamas, UT 84036
|
- sq. feet
|
- baths - beds |
show details | |

|
#5
E Highway 150
Kamas, UT 84036
|
- sq. feet
|
- baths - beds |
show details | |

|
#6
E Highway 150
Kamas, UT 84036
|
- sq. feet
|
- baths - beds |
show details | |

|
#7
E Highway 150
Kamas, UT 84036
|
- sq. feet
|
- baths - beds |
show details | |

|
#8
E Highway 150
Kamas, UT 84036
|
- sq. feet
|
- baths - beds |
show details | |

|
#9
E Highway 150
Kamas, UT 84036
|
- sq. feet
|
- baths - beds |
show details | |

|
#10
E Highway 150
Kamas, UT 84036
|
- sq. feet
|
- baths - beds |
show details |
| Photo | Address | Area | Beds / Baths | Price | Details |
|---|---|---|---|---|---|

|
#11
E Highway 150
Kamas, UT 84036
|
- sq. feet
|
- baths - beds |
show details | |

|
#12
E Highway 150
Kamas, UT 84036
|
- sq. feet
|
- baths - beds |
show details | |

|
#13
E Highway 150
Kamas, UT 84036
|
- sq. feet
|
- baths - beds |
show details | |

|
#14
Monitor Dr Apt 14b
Park City, UT 84060
|
- sq. feet
|
- baths - beds |
show details | |

|
#15
N Jordanelle Pkwy
Kamas, UT 84036
|
- sq. feet
|
- baths - beds |
show details | |

|
#16
Sidewinder Dr Ste 212
Park City, UT 84060
|
- sq. feet
|
- baths - beds |
show details | |

|
#17
Big Sky Trl
Kamas, UT 84036
|
- sq. feet
|
- baths - beds |
show details | |

|
#18
E Highway 150
Kamas, UT 84036
|
- sq. feet
|
- baths - beds |
show details | |

|
#19
Big Sky Trl
Kamas, UT 84036
|
- sq. feet
|
- baths - beds |
show details | |

|
#20
Big Sky Trl
Kamas, UT 84036
|
- sq. feet
|
- baths - beds |
show details |
| Photo | Address | Area | Beds / Baths | Price | Details |
|---|---|---|---|---|---|

|
#21
Big Sky Trail
Kamas, UT 84036
|
- sq. feet
|
- baths - beds |
show details | |

|
#22
Big Sky Trail
Kamas, UT 84036
|
- sq. feet
|
- baths - beds |
show details | |

|
#23
Big Sky Trl
Kamas, UT 84036
|
- sq. feet
|
- baths - beds |
show details | |

|
#24
Big Sky Trail
Kamas, UT 84036
|
- sq. feet
|
- baths - beds |
show details | |

|
#25
Big Sky Trail
Kamas, UT 84036
|
- sq. feet
|
- baths - beds |
show details | |

|
#26
Big Sky Trl
Kamas, UT 84036
|
- sq. feet
|
- baths - beds |
show details | |

|
#27
Country Ln
Kamas, UT 84036
|
- sq. feet
|
- baths - beds |
show details | |

|
#28
Country Ln
Kamas, UT 84036
|
- sq. feet
|
- baths - beds |
show details | |

|
#29
Country Ln
Kamas, UT 84036
|
- sq. feet
|
- baths - beds |
show details | |

|
#30
Country Ln
Kamas, UT 84036
|
- sq. feet
|
- baths - beds |
show details |
| Photo | Address | Area | Beds / Baths | Price | Details |
|---|---|---|---|---|---|

|
#31
Country Ln
Kamas, UT 84036
|
- sq. feet
|
- baths - beds |
show details | |

|
#32
E Highway 150
Kamas, UT 84036
|
- sq. feet
|
- baths - beds |
show details | |

|
#33
E Highway 150
Kamas, UT 84036
|
- sq. feet
|
- baths - beds |
show details | |

|
#34
Country Ln
Kamas, UT 84036
|
- sq. feet
|
- baths - beds |
show details | |

|
#35
Country 27
Kamas, UT 84036
|
- sq. feet
|
- baths - beds |
show details | |

|
#36
E Highway 150
Kamas, UT 84036
|
- sq. feet
|
- baths - beds |
show details | |

|
#37
Ute Blvd Apt 203
Park City, UT 84098
|
- sq. feet
|
- baths - beds |
show details | |

|
#38
Lillehammer Ln Apt 1209
Park City, UT 84098
|
- sq. feet
|
- baths - beds |
show details | |

|
#39
Saddle Dr
Oakley, UT 84055
|
- sq. feet
|
- baths - beds |
show details | |

|
#40
E Boulderville Rd
Oakley, UT 84055
|
- sq. feet
|
- baths - beds |
show details |
| Photo | Address | Area | Beds / Baths | Price | Details |
|---|---|---|---|---|---|

|
#41
S 650 W, Apt 193
Peoa, UT 84061
|
- sq. feet
|
- baths - beds |
show details | |

|
#42
Canyons Resort Dr
Park City, UT 84098
|
360 sq. feet
|
- baths - beds |
show details | |

|
#43
Ozzy Way, Unit B103
Park City, UT 84098
|
- sq. feet
|
- baths - beds |
show details | |

|
#44
White Pine Canyon Rd
Park City, UT 84060
|
- sq. feet
|
- baths - beds |
show details | |

|
#45
Country L 3
Kamas, UT 84036
|
- sq. feet
|
- baths - beds |
show details | |

|
#46
Country 26
Kamas, UT 84036
|
- sq. feet
|
- baths - beds |
show details | |

|
#47
Country L 7
Kamas, UT 84036
|
- sq. feet
|
- baths - beds |
show details | |

|
#48
Country L 8
Kamas, UT 84036
|
- sq. feet
|
- baths - beds |
show details | |

|
#49
Country 23
Kamas, UT 84036
|
- sq. feet
|
- baths - beds |
show details | |

|
Check over 1 million property listings on Foreclosure.com!
|
browse all offers | |||

Latest news about housing in Heber, UT collected exclusively by city-data.com from local newspapers, TV, and radio stations

 | Help me decide on where to buy a vacation home in Utah (16 replies) |
| Heber: Too bad real estate prices are so high (1 reply) |
| Non-LDS moving to Heber City (1 reply) |
| Commuting from Heber Valley to Provo? (3 replies) |
| Park City rental housing - lack thereof (2 replies) |
| Coming to explore for possible relocation. (18 replies) |

Median year apartment built: 1995
Household type by relationship:
Households: 17,443- Male householders: 2,349 (417 living alone), Female householders: 2,777 (647 living alone)
3,357 spouses (3,322 opposite-sex spouses), 199 unmarried partners, (189 opposite-sex unmarried partners), 7,124 children (6,764 natural, 176 adopted, 184 stepchildren), 312 grandchildren, 221 brothers or sisters, 181 parents, 0 foster children, 284 other relatives, 441 non-relatives
- In group quarters: 193
Size of family households: 957 2-persons, 939 3-persons, 854 4-persons, 632 5-persons, 427 6-persons, 255 7-or-more-persons.
Size of nonfamily households: 1,076 1-person, 66 2-persons, 25 3-persons, 21 4-persons.
4,337 married couples with children.
709 single-parent households (110 men, 599 women).
81.7% of residents of Heber speak English at home.
14.5% of residents speak Spanish at home (54% speak English very well, 26% speak English well, 5% speak English not well, 15% don't speak English at all).
1.8% of residents speak other Indo-European language at home (95% speak English very well, 5% speak English well).
2.1% of residents speak Asian or Pacific Island language at home (96% speak English very well, 1% speak English well, 2% speak English not well).
0.1% of residents speak other language at home (90% speak English very well, 10% speak English well).
Foreign born population: 1,789 (10.3%)
(45.0% of them are naturalized citizens)
| Here: | 7.6 |
| State: | 7.6 |
| Here: | 5.3 |
| State: | 4.3 |
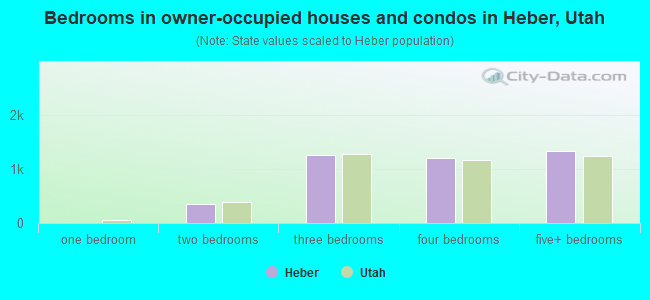
- Bedrooms in owner-occupied houses and condos in Heber, Utah
- 0no bedroom
- 01 bedroom
- 3592 bedrooms
- 1,2503 bedrooms
- 1,1974 bedrooms
- 1,3345+ bedrooms
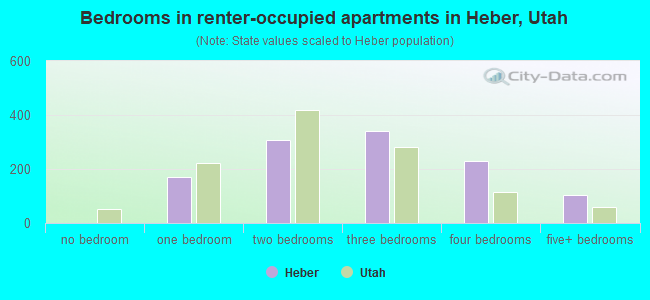
- Bedrooms in renter-occupied apartments in Heber, Utah
- 0no bedroom
- 1691 bedroom
- 3092 bedrooms
- 3413 bedrooms
- 2304 bedrooms
- 1045+ bedrooms
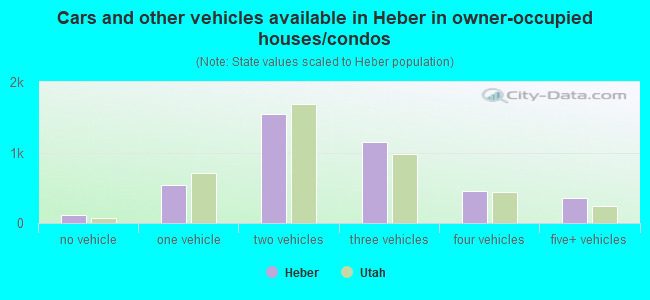
- Cars and other vehicles available in Heber in owner-occupied houses/condos
- 111no vehicle
- 5341 vehicle
- 1,5442 vehicles
- 1,1443 vehicles
- 4524 vehicles
- 3565+ vehicles
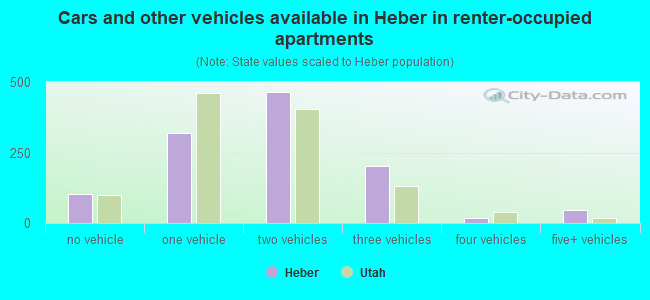
- Cars and other vehicles available in Heber in renter-occupied apartments
- 102no vehicle
- 3201 vehicle
- 4642 vehicles
- 2033 vehicles
- 184 vehicles
- 465+ vehicles
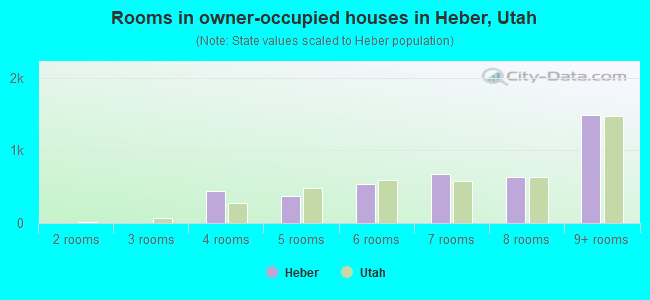
- Rooms in owner-occupied houses in Heber, Utah
- 01 room
- 02 rooms
- 03 rooms
- 4424 rooms
- 3745 rooms
- 5346 rooms
- 6707 rooms
- 6338 rooms
- 1,4879+ rooms
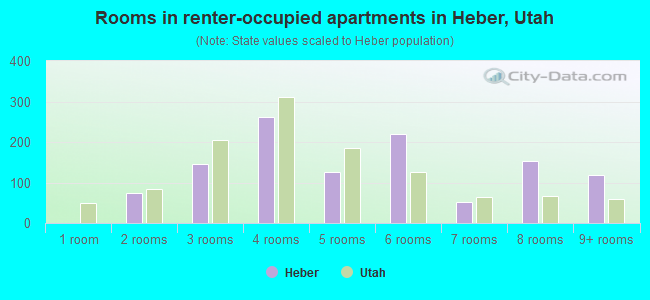
- Rooms in renter-occupied apartments in Heber, Utah
- 01 room
- 752 rooms
- 1463 rooms
- 2614 rooms
- 1255 rooms
- 2206 rooms
- 537 rooms
- 1538 rooms
- 1199+ rooms
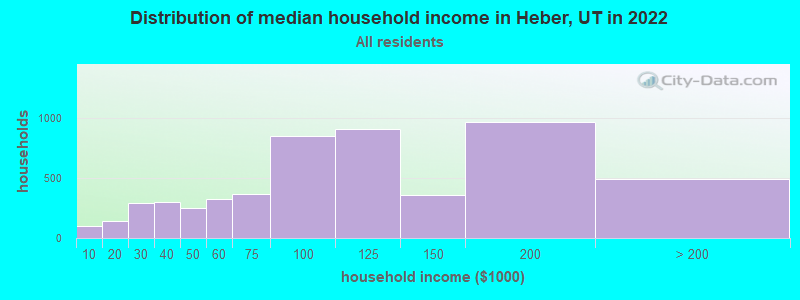
Heber, UT household income distribution

- 100Less than $10,000
- 138$10,000 to $19,999
- 295$20,000 to $29,999
- 299$30,000 to $39,999
- 246$40,000 to $49,999
- 324$50,000 to $59,999
- 362$60,000 to $74,999
- 848$75,000 to $99,999
- 904$100,000 to $124,999
- 355$125,000 to $149,999
- 964$150,000 to $199,999
- 489$200,000 or more
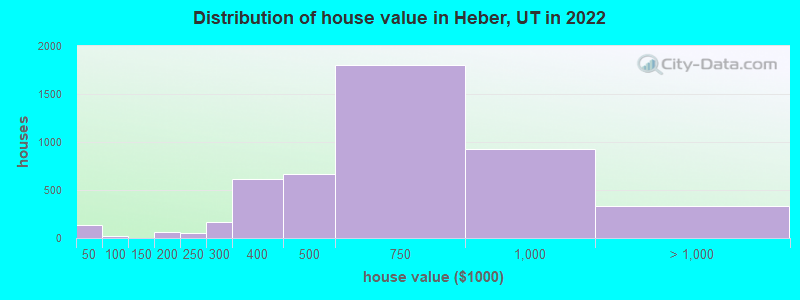
Home value of owner - occupied houses in 2022 in Heber, UT
-
- 23Less than $10,000
- 36$10,000 to $14,999
- 5$20,000 to $24,999
- 28$30,000 to $34,999
- 16$35,000 to $39,999
- 20$40,000 to $49,999
- 16$150,000 to $174,999
- 41$175,000 to $199,999
- 47$200,000 to $249,999
- 161$250,000 to $299,999
- 615$300,000 to $399,999
- 663$400,000 to $499,999
- 1,804$500,000 to $749,999
- 926$750,000 to $999,999
- 192$1,000,000 to $1,499,999
- 96$1,500,000 to $1,999,999
- 44$2,000,000 or more
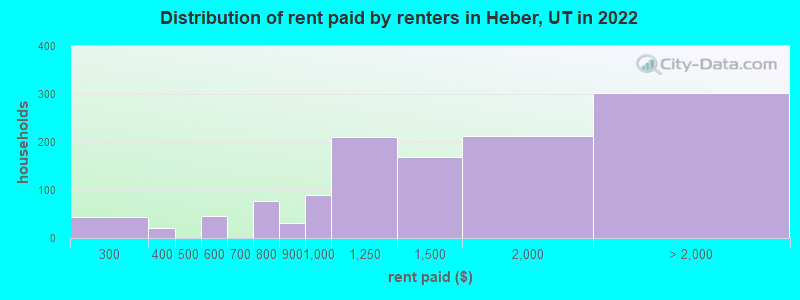
Rent paid by renters in 2022 in Heber, UT
-
- 42$200 to $249
- 20$300 to $349
- 38$500 to $549
- 6$550 to $599
- 59$700 to $749
- 17$750 to $799
- 30$800 to $899
- 89$900 to $999
- 211$1,000 to $1,249
- 168$1,250 to $1,499
- 212$1,500 to $1,999
- 195$2,000 to $2,499
- 39$2,500 to $2,999
- 67No cash rent
Percentage of workers working in this county: 66.7%
Number of people working at home: 1,194 (13.1% of all workers)
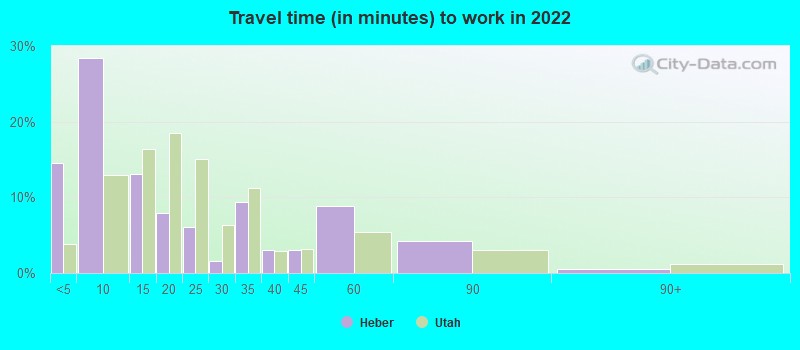
Travel time to work (commute)
- Less than 5 minutes: 1,009
- 5 to 9 minutes: 1,649
- 10 to 14 minutes: 963
- 15 to 19 minutes: 451
- 20 to 24 minutes: 669
- 25 to 29 minutes: 774
- 30 to 34 minutes: 965
- 35 to 39 minutes: 183
- 40 to 44 minutes: 301
- 45 to 59 minutes: 634
- 60 to 89 minutes: 182
- 90 or more minutes: 26
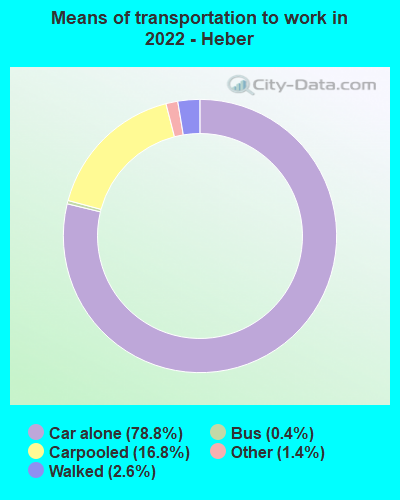
Means of transportation to work:
- Drove a car alone: 5,676 (66.9%)
- Carpooled: 1,282 (15.1%)
- Bus: 26 (0.3%)
- Taxi: 109 (1.3%)
- Walked: 166 (2.0%)
- Worked at home: 1,194 (14.1%)
- Unemployment by race in 2022
- Unemployment rate for White non-Hispanic residents
- 1.5%Males
- 1.6%Females
- Unemployment rate for other race residents
- 18.6%Females
- Unemployment rate for two or more race residents
- 9.0%Females
- Unemployment rate for Hispanic or Latino residents
- 5.1%Males
- 12.3%Females
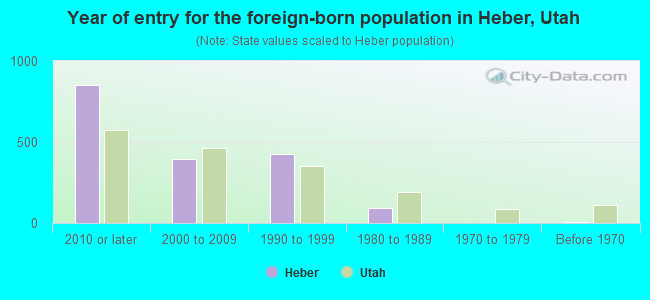
- Year of entry for the foreign-born population in Heber, Utah
- 8502010 or later
- 3932000 to 2009
- 4261990 to 1999
- 941980 to 1989
- 21970 to 1979
- 9Before 1970
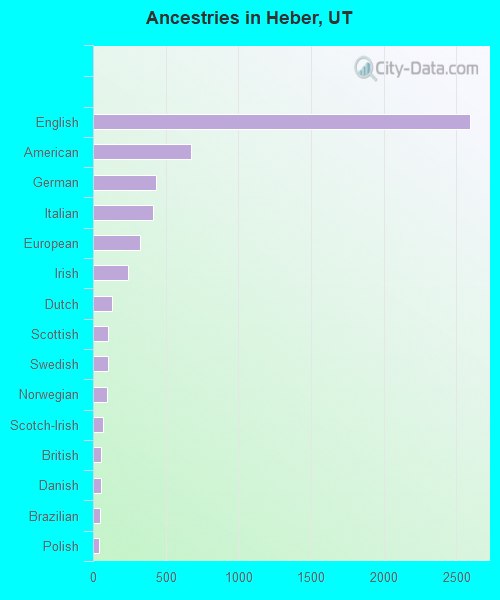
First ancestries reported:
- English: 2,596 (33.4%)
- American: 675 (8.7%)
- German: 432 (5.6%)
- Italian: 411 (5.3%)
- European: 323 (4.2%)
- Irish: 243 (3.1%)
- Dutch: 129 (1.7%)
- Scottish: 106 (1.4%)
- Swedish: 101 (1.3%)
- Norwegian: 99 (1.3%)
- Scotch-Irish: 66 (0.8%)
- British: 52 (0.7%)
- Danish: 52 (0.7%)
- Brazilian: 46 (0.6%)
- Polish: 44 (0.6%)
- French: 21 (0.3%)
- Russian: 20 (0.3%)
- Croatian: 19 (0.2%)
- Swiss: 19 (0.2%)
- Austrian: 17 (0.2%)
- Arab: 13 (0.2%)
- French Canadian: 12 (0.2%)
- Scandinavian: 7 (0.09%)
- Lebanese: 6 (0.08%)
- Romanian: 3 (0.04%)
- Canadian: 2 (0.03%)
Most common places of birth for foreign-born residents (%):
| Heber: | 57.5% (1,029) |
| Utah: | 36.1% (99,740) |
| Heber: | 15.8% (283) |
| Utah: | 2.3% (6,468) |
| Heber: | 6.7% (119) |
| Utah: | 2.0% (5,555) |
| Heber: | 4.6% (82) |
| Utah: | 3.0% (8,341) |
| Heber: | 3.7% (67) |
| Utah: | 2.8% (7,644) |
| Heber: | 3.0% (54) |
| Utah: | 0.2% (685) |
| Heber: | 2.1% (38) |
| Utah: | 2.1% (5,902) |
Place of birth for U.S.-born residents:
- This state: 9,433
- Other state: 5,904
- Northeast: 558
- Midwest: 554
- South: 889
- West: 3,890
89.0% of Heber residents lived in the same house 1 years ago.
Out of people who lived in different houses, 30.6% lived in this county.
Out of people who lived in different counties, 57.9% lived in Utah.
| Heber: | 89.0% |
| State average: | 85.7% |
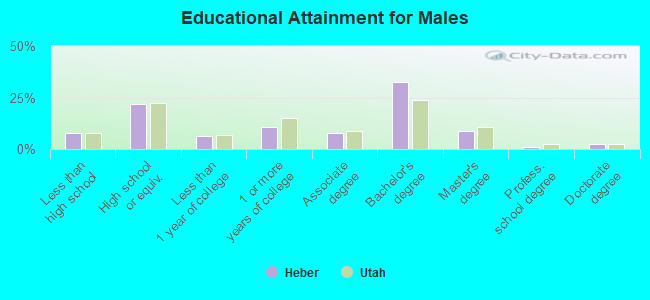
Education attainment for males 25 years and older:
- No schooling: 67
- Nursery to 4th grade: 25
- 5th and 6th grade: 127
- 7th and 8th grade: 36
- 9th grade: 0
- 10th grade: 17
- 11th grade: 15
- 12th grade, no diploma: 99
- High school graduate (or equivalency): 1,068
- Less than 1 year of college: 306
- Some college more than 1 year, no degree: 530
- Associate degree: 376
- Bachelor's degree: 1,584
- Master's degree: 434
- Professional school degree: 54
- Doctorate degree: 124
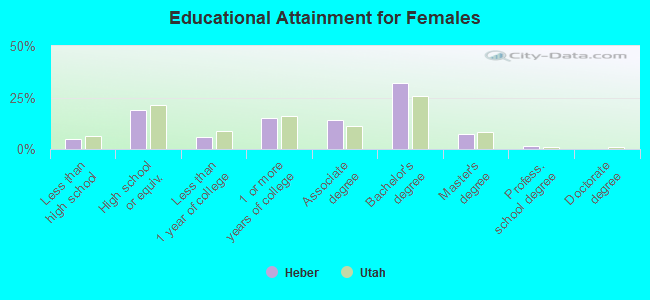
Education attainment for females 25 years and older:
- No schooling: 50
- Nursery to 4th grade: 28
- 5th and 6th grade: 10
- 7th and 8th grade: 35
- 9th grade: 24
- 10th grade: 5
- 11th grade: 42
- 12th grade, no diploma: 46
- High school graduate (or equivalency): 903
- Less than 1 year of college: 288
- Some college more than 1 year, no degree: 712
- Associate degree: 670
- Bachelor's degree: 1,529
- Master's degree: 355
- Professional school degree: 59
- Doctorate degree: 0
Housing units in structures:
- One, detached: 4,399
- One, attached: 421
- Two: 56
- 3 or 4: 211
- 5 to 9: 163
- 10 to 19: 114
- 50 or more: 86
- Mobile homes: 46
Housing units lacking complete kitchen facilities in 2022: 0.7%
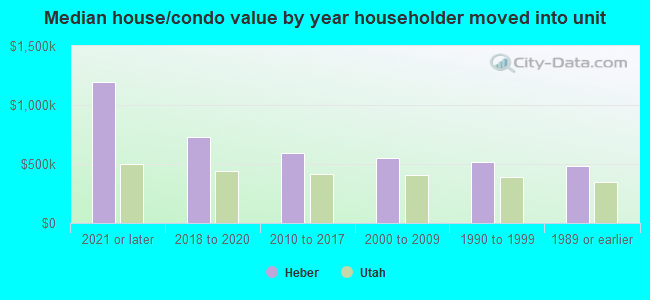
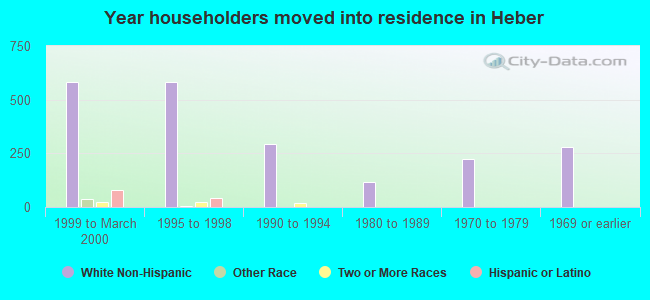
House/condo owner moved in on average 7 years ago
Renter moved in on average 3 years ago
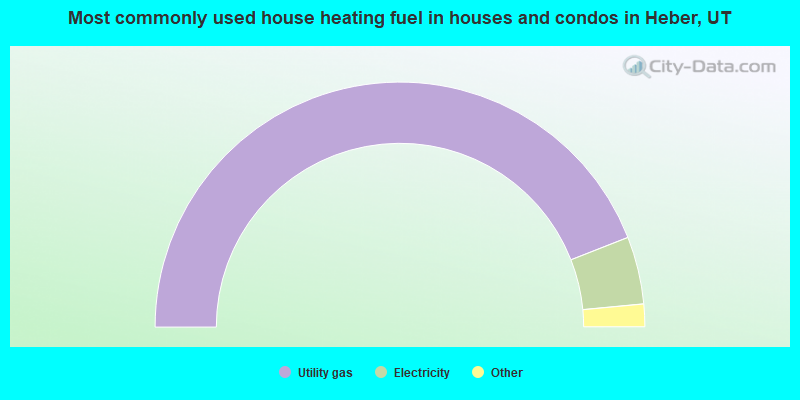
- 88.1%Utility gas
- 8.9%Electricity
- 2.6%Bottled, tank, or LP gas
- 0.3%No fuel used
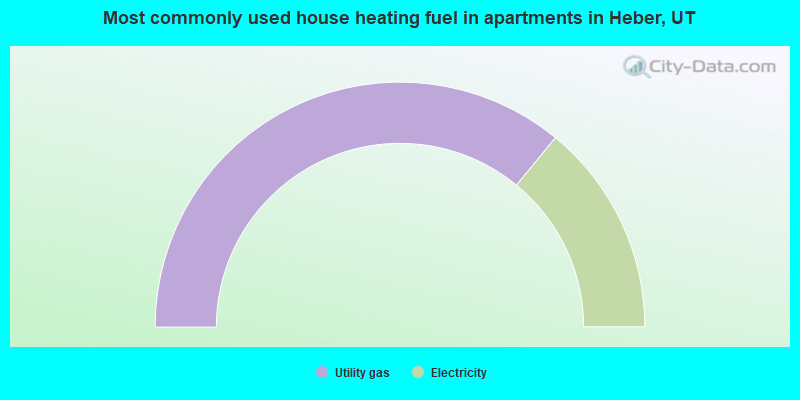
- 71.9%Utility gas
- 28.1%Electricity
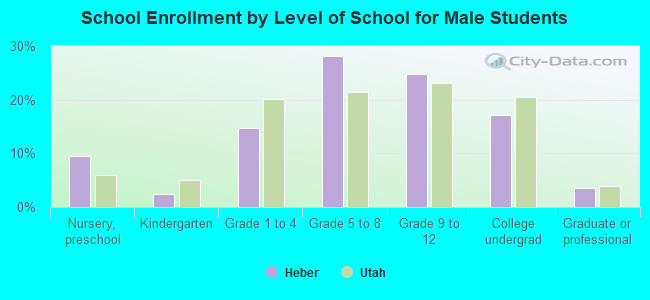
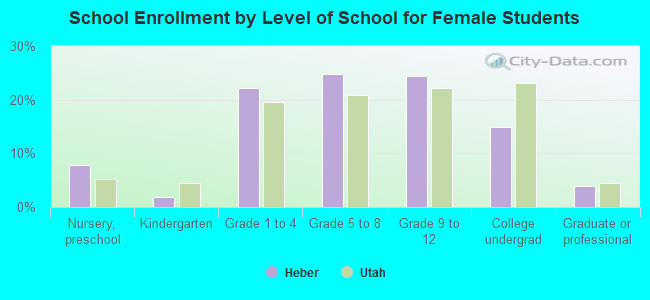
Private vs. public school enrollment:
| Here: | 5.2% |
| Utah: | 7.2% |
| Here: | 0.7% |
| Utah: | 5.3% |
| Here: | 23.3% |
| Utah: | 26.7% |