Hartford, CT (Connecticut) Houses and Residents
Estimated median house or condo value in 2022: $244,800 (it was $95,300 in 2000 )
Hartford:
$244,800Connecticut:
$347,200
Lower value quartile - upper value quartile: $180,300 - $327,700Mean price in 2022: Detached houses: $233,181 Here:
$233,181State:
$503,946
Townhouses or other attached units: $243,845 Here:
$243,845State:
$304,959
In 2-unit structures: $299,257 Here:
$299,257State:
$304,133
In 3-to-4-unit structures: $276,150 Here:
$276,150State:
$272,970
In 5-or-more-unit structures: $166,656 Here:
$166,656State:
$249,308
Mobile homes: $162,468 Here:
$162,468State:
$151,361
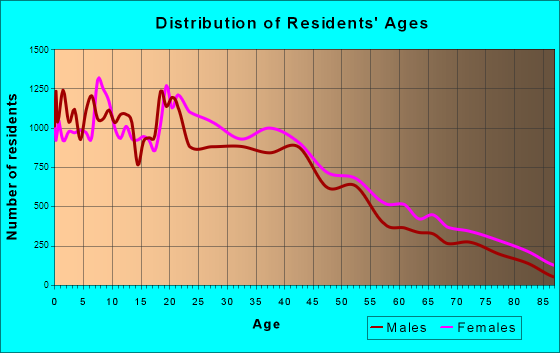
Total population: 124,705 (Urban population: 121,578, Rural population: 0)
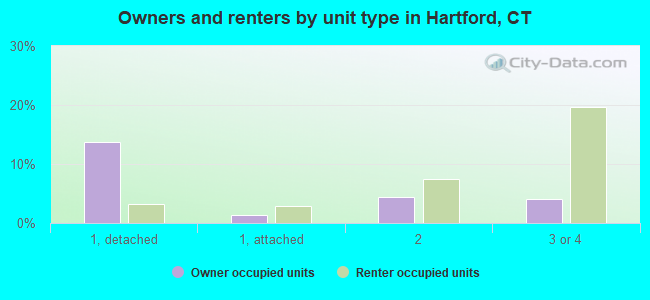
Houses: 57,617 (50,933 occupied: 11,969 owner occupied, 38,964 renter occupied )
% of renters here:
77%State:
34%
Housing density: 3,329 houses/condos per square mile
Median price asked for vacant for-sale houses and condos in 2022: $229,180.
Median contract rent in 2022: $980 (lower quartile is $770, upper quartile is $1,203)
Median rent asked for vacant for-rent units in 2022: $901
Median gross rent in Hartford, CT in 2022: $1,150
Housing units in Hartford with a mortgage: 8,551 (890 second mortgage, 0 home equity loan, 538 both second mortgage and home equity loan )Houses without a mortgage: 263
Median household income for houses/condos with a mortgage: $86,333
Median household income for apartments without a mortgage: $60,726
Median monthly housing costs: $1,205
Data:
Median house or condo value ($)
Median house or condo value ($ change since 2000)
Median house or condo value ($) - White
Median house or condo value ($) - Black or African American
Median house or condo value ($) - Asian
Median house or condo value ($) - Hispanic or Latino
Median house or condo value ($) - American Indian and Alaska Native
Median house or condo value ($) - Multirace
Median house or condo value ($) - Other Race
Median price asked for mobile homes ($)
Household density (households per square mile)
Mean house or condo value by units in structure - 1, detached ($)
Mean house or condo value by units in structure - 1, attached ($)
Mean house or condo value by units in structure - 2 ($)
Mean house or condo value by units in structure by units in structure - 3 or 4 ($)
Mean house or condo value by units in structure - 5 or more ($)
Mean house or condo value by units in structure - Boat, RV, van, etc. ($)
Mean house or condo value by units in structure - Mobile home ($)
Median contract rent ($)
Median contract rent - Lower quartile ($)
Median contract rent - Upper quartile ($)
Median gross rent ($)
Urban houses (%)
Rural houses (%)
Houses occupied (%)
Houses occupied (% change since 2000)
Houses owner occupied (%)
Houses owner occupied (% change since 2000)
Houses renter occupied (%)
Houses renter occupied (% change since 2000)
Vacant housing units - For rent (%)
Vacant housing units - For rent (% change since 2000)
Vacant housing units - For sale only (%)
Vacant housing units - For sale only (% change since 2000)
Vacant housing units - Rented or sold, not occupied (%)
Vacant housing units - Rented or sold, not occupied (% change since 2000)
Vacant housing units - For seasonal, recreational, or occasional use (%)
Vacant housing units - For seasonal, recreational, or occasional use (% change since 2000)
Vacant housing units - For migrant workers (%)
Vacant housing units - For migrant workers (% change since 2000)
Vacant housing units - Other vacant (%)
Vacant housing units - Other vacant (% change since 2000)
Median monthly housing costs ($)
Median household income for houses/condos with a mortgage ($)
Median household income for houses/condos without a mortgage ($)
Median household income ($)
Median household income ($) - White
Median household income ($) - Black or African American
Median household income ($) - Asian
Median household income ($) - Hispanic or Latino
Median household income ($) - American Indian and Alaska Native
Median household income ($) - Multirace
Median household income ($) - Other Race
Mortgage status - with mortgage (%)
Mortgage status - with second mortgage (%)
Mortgage status - with home equity loan (%)
Mortgage status - with both second mortgage and home equity loan (%)
Mortgage status - without a mortgage (%)
Median year house/condo built
Median year apartment built
Household type by relationship - Male householder living alone (%)
Household type by relationship - Male householder not living alone (%)
Household type by relationship - Female householder living alone (%)
Household type by relationship - Female householder not living alone (%)
Household type by relationship - Opposite-Sex spouse (%)
Household type by relationship - Same-Sex spouse (%)
Household type by relationship - Opposite-Sex unmarried partner (%)
Household type by relationship - Same-Sex unmarried partner (%)
Household type by relationship - In group quarters (%)
Size of family households - 2-person household (%)
Size of family households - 3-person household (%)
Size of family households - 4-person household (%)
Size of family households - 5-person household (%)
Size of family households - 6-person household (%)
Size of family households - 7-or-more-person household (%)
Size of nonfamily households - 1-person household (%)
Size of nonfamily households - 2-person household (%)
Size of nonfamily households - 3-person household (%)
Size of nonfamily households - 4-person household (%)
Size of nonfamily households - 5-person household (%)
Size of nonfamily households - 6-person household (%)
Size of nonfamily households - 7-or-moreperson household (%)
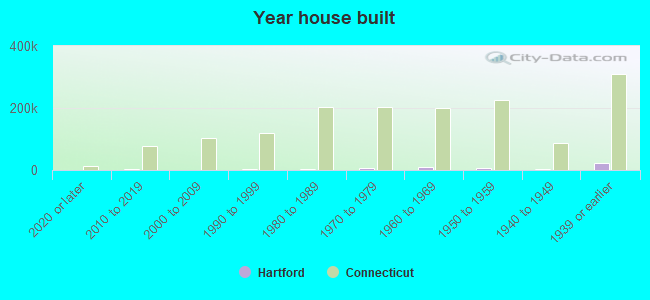
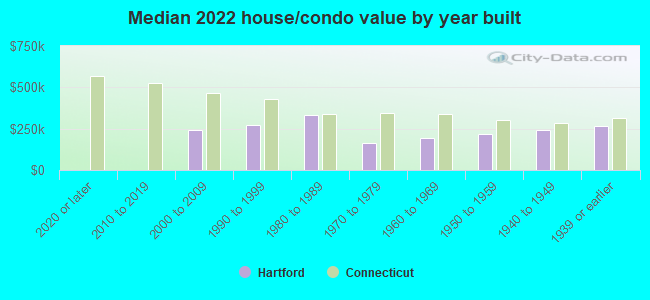
Year house built - Built 2010 or later (%)
Year house built - Built 2000 to 2009 (%)
Year house built - Built 1990 to 1999 (%)
Year house built - Built 1980 to 1989 (%)
Year house built - Built 1970 to 1979 (%)
Year house built - Built 1960 to 1969 (%)
Year house built - Built 1950 to 1959 (%)
Year house built - Built 1940 to 1949 (%)
Year house built - Built 1939 or earlier (%)
Median number of rooms in houses and condos
Median number of rooms in apartments
Median number of bedrooms in owner occupied houses
Mean number of bedrooms in owner occupied houses
Median number of bedrooms in renter occupied houses
Mean number of bedrooms in renter occupied houses
Median number of vehichles in owner occupied houses
Mean number of vehichles in owner occupied houses
Median number of vehichles in renter occupied houses
Mean number of vehichles in renter occupied houses
Rooms in owner-occupied houses - 1 room (%)
Rooms in owner-occupied houses - 2 rooms (%)
Rooms in owner-occupied houses - 3 rooms (%)
Rooms in owner-occupied houses - 4 rooms (%)
Rooms in owner-occupied houses - 5 rooms (%)
Rooms in owner-occupied houses - 6 rooms (%)
Rooms in owner-occupied houses - 7 rooms (%)
Rooms in owner-occupied houses - 8 rooms (%)
Rooms in owner-occupied houses - 9+ rooms (%)
Rooms in renter-occupied houses - 1 room (%)
Rooms in renter-occupied houses - 2 rooms (%)
Rooms in renter-occupied houses - 3 rooms (%)
Rooms in renter-occupied houses - 4 rooms (%)
Rooms in renter-occupied houses - 5 rooms (%)
Rooms in renter-occupied houses - 6 rooms (%)
Rooms in renter-occupied houses - 7 rooms (%)
Rooms in renter-occupied houses - 8 rooms (%)
Rooms in renter-occupied houses - 9+ rooms (%)
Bedrooms in owner-occupied houses - no bedrooms (%)
Bedrooms in owner-occupied houses - 1 bedroom (%)
Bedrooms in owner-occupied houses - 2 bedrooms (%)
Bedrooms in owner-occupied houses - 3 bedrooms (%)
Bedrooms in owner-occupied houses - 4 bedrooms (%)
Bedrooms in owner-occupied houses - 5+ bedrooms (%)
Bedrooms in renter-occupied houses - no bedrooms (%)
Bedrooms in renter-occupied houses - 1 bedroom (%)
Bedrooms in renter-occupied houses - 2 bedrooms (%)
Bedrooms in renter-occupied houses - 3 bedrooms (%)
Bedrooms in renter-occupied houses - 4 bedrooms (%)
Bedrooms in renter-occupied houses - 5+ bedrooms (%)
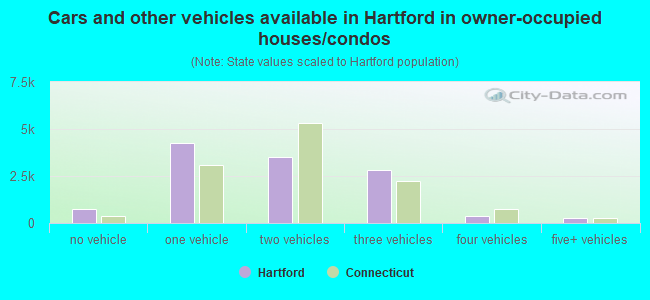
Vehicles available in owner-occupied houses - no vehicle available (%)
Vehicles available in owner-occupied houses - 1 vehicle available(%)
Vehicles available in owner-occupied houses - 2 Vehicles available (%)
Vehicles available in owner-occupied houses - 3 Vehicles available (%)
Vehicles available in owner-occupied houses - 4 Vehicles available (%)
Vehicles available in owner-occupied houses - 5+ Vehicles available (%)
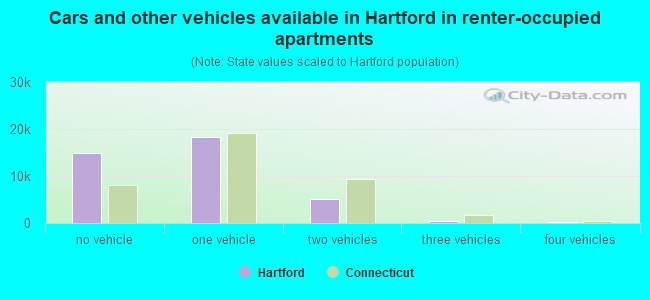
Vehicles available in renter-occupied houses - no vehicle available (%)
Vehicles available in renter-occupied houses - 1 vehicle available (%)
Vehicles available in renter-occupied houses - 2 Vehicles available (%)
Vehicles available in renter-occupied houses - 3 Vehicles available (%)
Vehicles available in renter-occupied houses - 4 Vehicles available (%)
Vehicles available in renter-occupied houses - 5+ Vehicles available (%)
Housing units in structures - 1, detached (%)
Housing units in structures - 1, attached (%)
Housing units in structures - 2 (%)
Housing units in structures - 3 or 4 (%)
Housing units in structures - 5 to 9 (%)
Housing units in structures - 10 to 19 (%)
Housing units in structures - 20 to 49 (%)
Housing units in structures - 50 or more (%)
Housing units in structures - Mobile home (%)
Housing units in structures - Boat, RV, van, etc. (%)
Housing units in structures - Owners - 1, detached (%)
Housing units in structures - Owners - 1, attached (%)
Housing units in structures - Owners - 2 (%)
Housing units in structures - Owners - 3 or 4 (%)
Housing units in structures - Owners - 5 to 9 (%)
Housing units in structures - Owners - 10 to 19 (%)
Housing units in structures - Owners - 20 to 49 (%)
Housing units in structures - Owners - 50 or more (%)
Housing units in structures - Owners - Mobile home (%)
Housing units in structures - Owners - Boat, RV, van, etc. (%)
Housing units in structures - Renters - 1, detached (%)
Housing units in structures - Renters - 1, attached (%)
Housing units in structures - Renters - 2 (%)
Housing units in structures - Renters - 3 or 4 (%)
Housing units in structures - Renters - 5 to 9 (%)
Housing units in structures - Renters - 10 to 19 (%)
Housing units in structures - Renters - 20 to 49 (%)
Housing units in structures - Renters - 50 or more (%)
Housing units in structures - Renters - Mobile home (%)
Housing units in structures - Renters - Boat, RV, van, etc. (%)
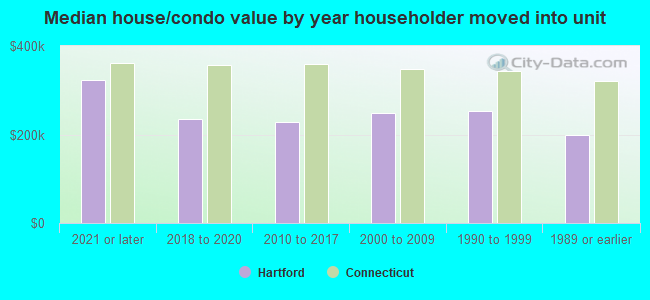
House/condo owner moved in on average (years ago)
Renter moved in on average (years ago)
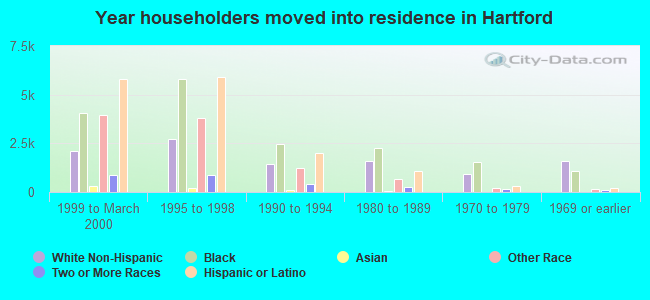
Year householder moved into unit - Moved in 1999 to March 2000 (%)
Year householder moved into unit - Moved in 1999 to March 2000 (%) - White
Year householder moved into unit - Moved in 1999 to March 2000 (%) - Black or African American
Year householder moved into unit - Moved in 1999 to March 2000 (%) - Asian
Year householder moved into unit - Moved in 1999 to March 2000 (%) - Hispanic or Latino
Year householder moved into unit - Moved in 1999 to March 2000 (%) - American Indian and Alaska Native
Year householder moved into unit - Moved in 1999 to March 2000 (%) - Multirace
Year householder moved into unit - Moved in 1999 to March 2000 (%) - Other Race
Year householder moved into unit - Moved in 1995 to 1998 (%)
Year householder moved into unit - Moved in 1995 to 1998 (%) - White
Year householder moved into unit - Moved in 1995 to 1998 (%) - Black or African American
Year householder moved into unit - Moved in 1995 to 1998 (%) - Asian
Year householder moved into unit - Moved in 1995 to 1998 (%) - Hispanic or Latino
Year householder moved into unit - Moved in 1995 to 1998 (%) - American Indian and Alaska Native
Year householder moved into unit - Moved in 1995 to 1998 (%) - Multirace
Year householder moved into unit - Moved in 1995 to 1998 (%) - Other Race
Year householder moved into unit - Moved in 1990 to 1994 (%)
Year householder moved into unit - Moved in 1990 to 1994 (%) - White
Year householder moved into unit - Moved in 1990 to 1994 (%) - Black or African American
Year householder moved into unit - Moved in 1990 to 1994 (%) - Asian
Year householder moved into unit - Moved in 1990 to 1994 (%) - Hispanic or Latino
Year householder moved into unit - Moved in 1990 to 1994 (%) - American Indian and Alaska Native
Year householder moved into unit - Moved in 1990 to 1994 (%) - Multirace
Year householder moved into unit - Moved in 1990 to 1994 (%) - Other Race
Year householder moved into unit - Moved in 1980 to 1989 (%)
Year householder moved into unit - Moved in 1980 to 1989 (%) - White
Year householder moved into unit - Moved in 1980 to 1989 (%) - Black or African American
Year householder moved into unit - Moved in 1980 to 1989 (%) - Asian
Year householder moved into unit - Moved in 1980 to 1989 (%) - Hispanic or Latino
Year householder moved into unit - Moved in 1980 to 1989 (%) - American Indian and Alaska Native
Year householder moved into unit - Moved in 1980 to 1989 (%) - Multirace
Year householder moved into unit - Moved in 1980 to 1989 (%) - Other Race
Year householder moved into unit - Moved in 1970 to 1979 (%)
Year householder moved into unit - Moved in 1970 to 1979 (%) - White
Year householder moved into unit - Moved in 1970 to 1979 (%) - Black or African American
Year householder moved into unit - Moved in 1970 to 1979 (%) - Asian
Year householder moved into unit - Moved in 1970 to 1979 (%) - Hispanic or Latino
Year householder moved into unit - Moved in 1970 to 1979 (%) - American Indian and Alaska Native
Year householder moved into unit - Moved in 1970 to 1979 (%) - Multirace
Year householder moved into unit - Moved in 1970 to 1979 (%) - Other Race
Year householder moved into unit - Moved in 1969 or earlier (%)
Year householder moved into unit - Moved in 1969 or earlier (%) - White
Year householder moved into unit - Moved in 1969 or earlier (%) - Black or African American
Year householder moved into unit - Moved in 1969 or earlier (%) - Asian
Year householder moved into unit - Moved in 1969 or earlier (%) - Hispanic or Latino
Year householder moved into unit - Moved in 1969 or earlier (%) - American Indian and Alaska Native
Year householder moved into unit - Moved in 1969 or earlier (%) - Multirace
Year householder moved into unit - Moved in 1969 or earlier (%) - Other Race
Housing units lacking complete plumbing facilities (%)
Housing units lacking complete kitchen facilities (%)
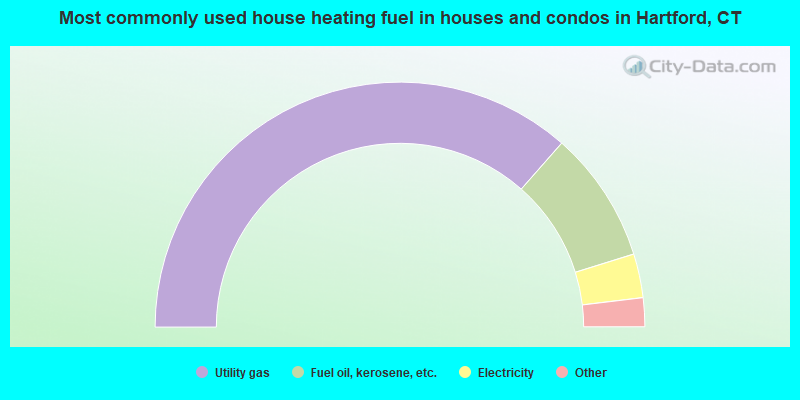
House heating fuel used in houses and condos - Utility gas (%)
House heating fuel used in houses and condos - Bottled, tank, or LP gas (%)
House heating fuel used in houses and condos - Electricity (%)
House heating fuel used in houses and condos - Fuel oil, kerosene, etc. (%)
House heating fuel used in houses and condos - Coal or coke (%)
House heating fuel used in houses and condos - Wood (%)
House heating fuel used in houses and condos - Solar energy (%)
House heating fuel used in houses and condos - Other fuel (%)
House heating fuel used in houses and condos - No fuel used (%)
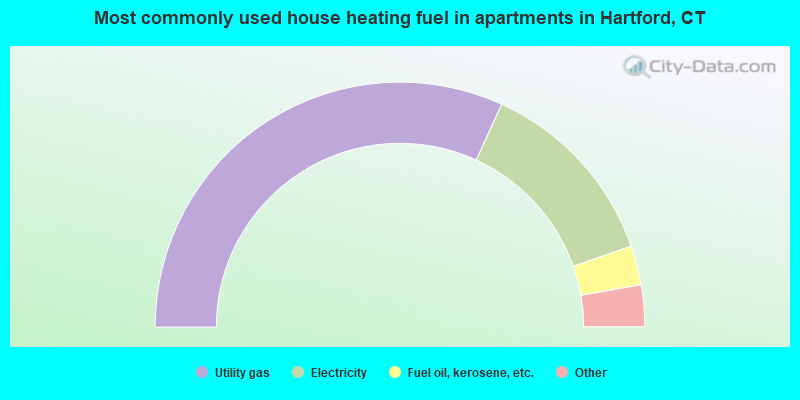
House heating fuel used in apartments - Utility gas (%)
House heating fuel used in apartments - Bottled, tank, or LP gas (%)
House heating fuel used in apartments - Electricity (%)
House heating fuel used in apartments - Fuel oil, kerosene, etc. (%)
House heating fuel used in apartments - Coal or coke (%)
House heating fuel used in apartments - Wood (%)
House heating fuel used in apartments - Solar energy (%)
House heating fuel used in apartments - Other fuel (%)
House heating fuel used in apartments - No fuel used (%)
Latest news about housing in Hartford, CT collected exclusively by city-data.com from local newspapers, TV, and radio stations
Median year house/condo built: 1940Median year apartment built: 1961Household type by relationship:
Households: 120,682
Male householders: 20,828 (11,481 living alone ), Female householders: 30,105 (12,049 living alone )7,390 spouses (7,116 opposite-sex spouses ), 3,868 unmarried partners , (3,653 opposite-sex unmarried partners ), 35,175 children (33,004 natural , 1,075 adopted , 1,096 stepchildren ), 3,776 grandchildren , 1,375 brothers or sisters , 1,903 parents , 181 foster children , 3,085 other relatives , 4,020 non-relatives In group quarters: 8,976
Size of family households: 9,072 2-persons , 7,131 3-persons , 5,845 4-persons , 2,355 5-persons , 1,185 6-persons , 448 7-or-more-persons .
Size of nonfamily households: 20,316 1-person , 2,770 2-persons , 220 3-persons , 53 4-persons , 26 6-persons .
4,216 married couples with children. single-parent households (2,677 men , 14,615 women ).
56.0% of residents of Hartford speak English at home. of residents speak Spanish at home (54% speak English very well , 18% speak English well , 17% speak English not well , 10% don't speak English at all ).of residents speak other Indo-European language at home (57% speak English very well , 24% speak English well , 15% speak English not well , 4% don't speak English at all ).of residents speak Asian or Pacific Island language at home (56% speak English very well , 24% speak English well , 8% speak English not well , 12% don't speak English at all ).of residents speak other language at home (71% speak English very well , 16% speak English well , 9% speak English not well , 4% don't speak English at all ).
Foreign born population: 35,160 (29.1%)of them are naturalized citizens )
Median number of rooms in houses and condos:
Median number of rooms in apartments
Owner-occupied Renter-occupied
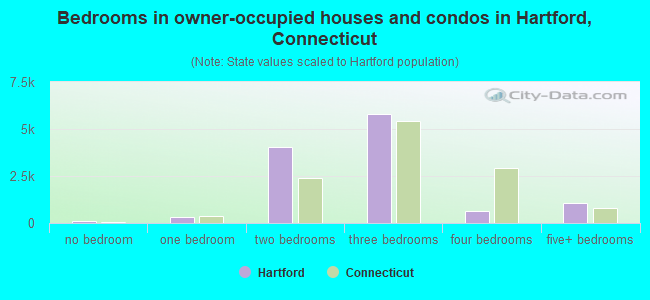
Bedrooms in owner-occupied houses and condos in Hartford, Connecticut
121 no bedroom 301 1 bedroom 4,053 2 bedrooms 5,790 3 bedrooms 618 4 bedrooms 1,086 5+ bedrooms
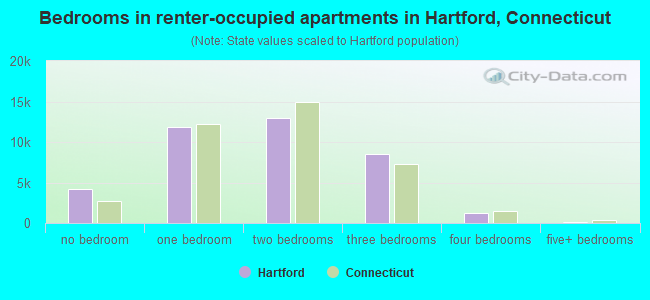
Bedrooms in renter-occupied apartments in Hartford, Connecticut
4,220 no bedroom 11,792 1 bedroom 13,006 2 bedrooms 8,580 3 bedrooms 1,253 4 bedrooms 113 5+ bedrooms
Owner-occupied Renter-occupied
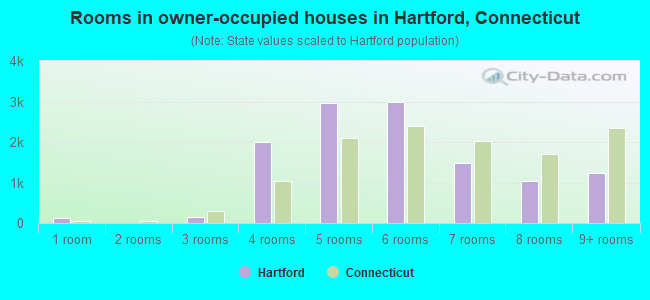
Rooms in owner-occupied houses in Hartford, Connecticut
121 1 room 0 2 rooms 137 3 rooms 2,005 4 rooms 2,960 5 rooms 2,976 6 rooms 1,493 7 rooms 1,042 8 rooms 1,235 9+ rooms
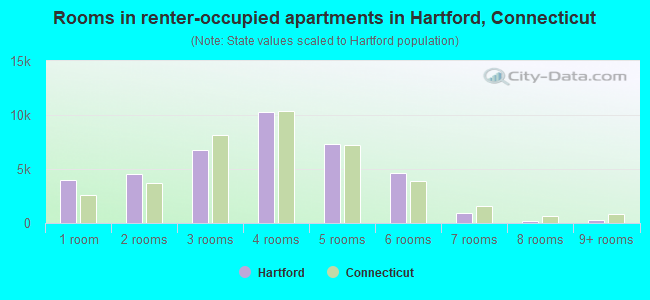
Rooms in renter-occupied apartments in Hartford, Connecticut
4,016 1 room 4,559 2 rooms 6,749 3 rooms 10,320 4 rooms 7,339 5 rooms 4,644 6 rooms 915 7 rooms 143 8 rooms 279 9+ rooms
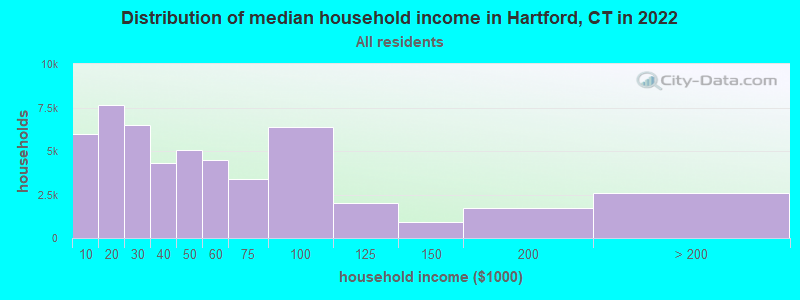
Hartford, CT household income distribution 5,998 Less than $10,0007,654 $10,000 to $19,9996,490 $20,000 to $29,9994,290 $30,000 to $39,9995,036 $40,000 to $49,9994,474 $50,000 to $59,9993,370 $60,000 to $74,9996,394 $75,000 to $99,9991,984 $100,000 to $124,999926 $125,000 to $149,9991,729 $150,000 to $199,9992,588 $200,000 or more
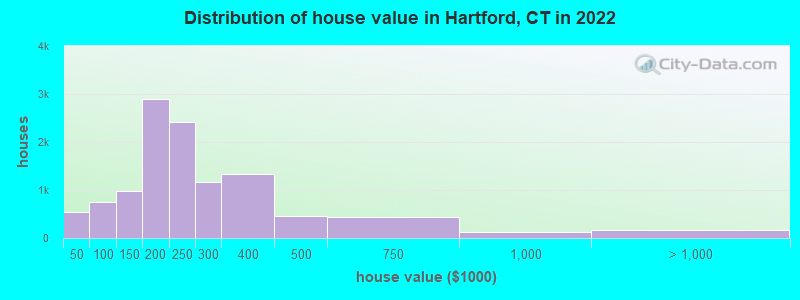
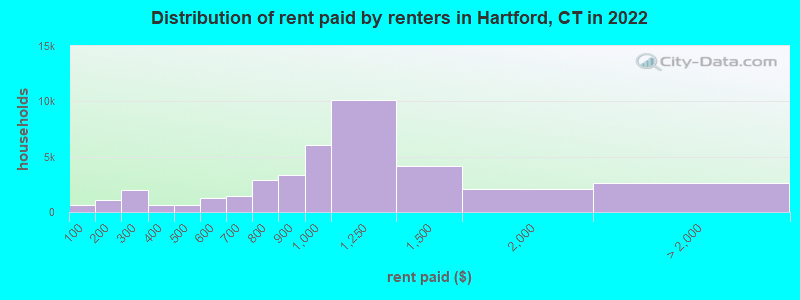
Home value of owner - occupied houses in 2022 in Hartford, CT 240 Less than $10,00063 $10,000 to $14,99934 $15,000 to $19,99977 $20,000 to $24,99943 $25,000 to $29,99933 $30,000 to $34,99919 $35,000 to $39,99929 $40,000 to $49,99913 $50,000 to $59,999157 $60,000 to $69,999174 $70,000 to $79,999143 $80,000 to $89,999220 $90,000 to $99,999486 $100,000 to $124,999488 $125,000 to $149,9991,857 $150,000 to $174,9991,045 $175,000 to $199,9992,412 $200,000 to $249,9991,174 $250,000 to $299,9991,332 $300,000 to $399,999448 $400,000 to $499,999439 $500,000 to $749,999125 $750,000 to $999,999100 $1,000,000 to $1,499,99960 $2,000,000 or moreRent paid by renters in 2022 in Hartford, CT 658 Less than $10052 $100 to $1491,045 $150 to $199823 $200 to $2491,198 $250 to $299412 $300 to $349180 $350 to $399414 $400 to $449233 $450 to $499829 $500 to $549462 $550 to $599420 $600 to $6491,034 $650 to $699808 $700 to $7492,062 $750 to $7993,311 $800 to $8996,028 $900 to $99910,083 $1,000 to $1,2494,198 $1,250 to $1,4992,088 $1,500 to $1,9991,051 $2,000 to $2,499142 $2,500 to $2,9991,433 No cash rent
Percentage of workers working in this county: 92.0%Number of people working at home: 4,832 (9.2% of all workers )
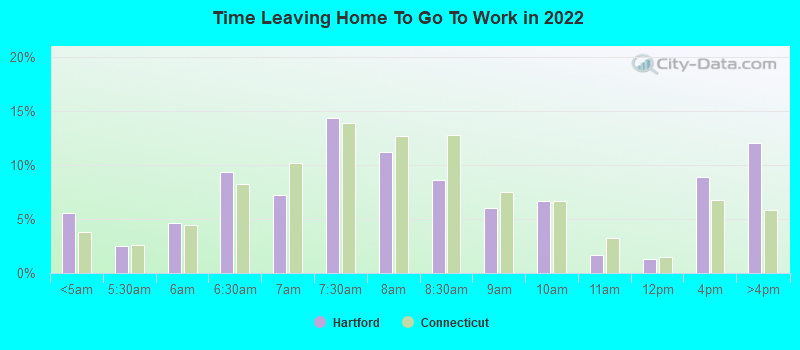
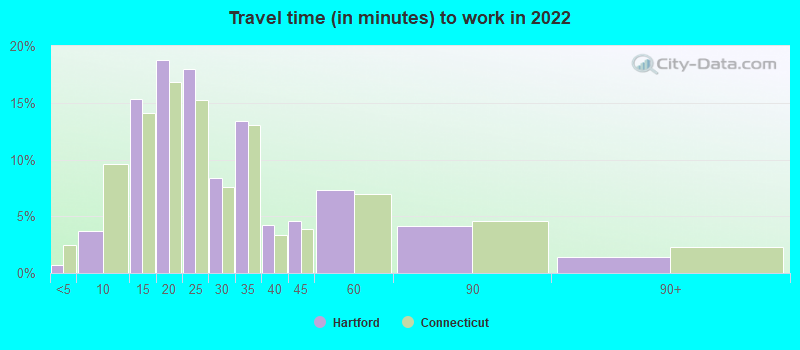
Travel time to work (commute)
Less than 5 minutes: 05 to 9 minutes: 4,27910 to 14 minutes: 10,38315 to 19 minutes: 9,72220 to 24 minutes: 7,68525 to 29 minutes: 2,88130 to 34 minutes: 7,26135 to 39 minutes: 23740 to 44 minutes: 1,21845 to 59 minutes: 2,25860 to 89 minutes: 1,78990 or more minutes: 1,232
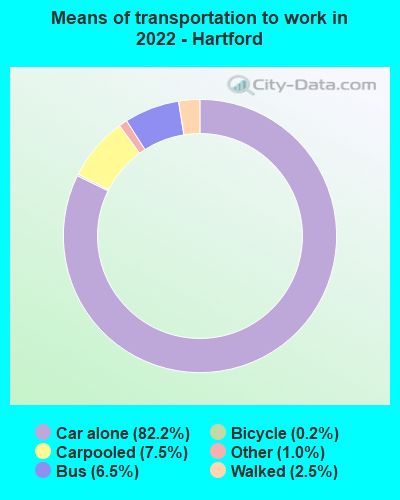
Means of transportation to work:
Drove a car alone: 72,863 (75.1%)Carpooled: 7,002 (7.2%)Bus : 5,738 (5.9%)Subway or elevated rail : 33 (0.0%)Long-distance train or commuter rail : 41 (0.0%)Ferryboat: 53 (0.1%)Taxi: 1,114 (1.1%)Bicycle: 136 (0.1%)Walked: 2,342 (2.4%)Worked at home: 4,832 (5.0%)
Unemployment by race in 2022
Unemployment rate for White non-Hispanic residents 12.0% Males7.8% FemalesUnemployment rate for Black residents 8.9% Males4.5% FemalesUnemployment rate for American Indian and Alaska Native residents 6.7% Males27.2% FemalesUnemployment rate for Asian residents 9.1% Males21.7% FemalesUnemployment rate for other race residents 7.3% Males12.9% FemalesUnemployment rate for two or more race residents 20.7% Males7.1% FemalesUnemployment rate for Hispanic or Latino residents 15.4% Males10.8% Females
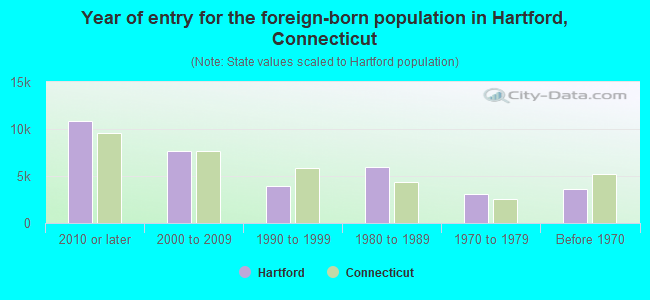
Year of entry for the foreign-born population in Hartford, Connecticut
10,859 2010 or later 7,693 2000 to 2009 3,926 1990 to 1999 5,995 1980 to 1989 3,062 1970 to 1979 3,668 Before 1970
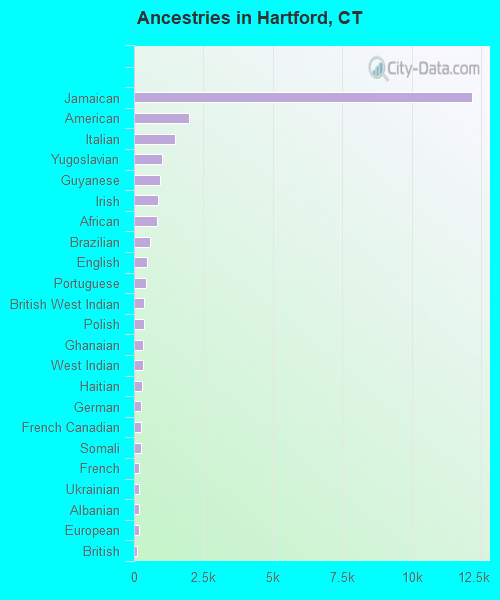
First ancestries reported:
Jamaican: 12,169 (14.7%)
American: 1,977 (2.4%)
Italian: 1,465 (1.8%)
Yugoslavian: 1,020 (1.2%)
Guyanese: 940 (1.1%)
Irish: 875 (1.1%)
African: 845 (1.0%)
Brazilian: 575 (0.7%)
English: 478 (0.6%)
Portuguese: 436 (0.5%)
British West Indian: 357 (0.4%)
Polish: 345 (0.4%)
Ghanaian: 326 (0.4%)
West Indian: 312 (0.4%)
Haitian: 292 (0.4%)
German: 249 (0.3%)
French Canadian: 238 (0.3%)
Somali: 237 (0.3%)
French: 197 (0.2%)
Ukrainian: 182 (0.2%)
Albanian: 171 (0.2%)
European: 163 (0.2%)
British: 120 (0.1%)
Trinidadian and Tobagonian: 110 (0.1%)
Nigerian: 85 (0.1%)
Russian: 83 (0.10%)
Hungarian: 71 (0.09%)
Ethiopian: 58 (0.07%)
Barbadian: 58 (0.07%)
Romanian: 49 (0.06%)
Eastern European: 45 (0.05%)
Lithuanian: 42 (0.05%)
Swedish: 40 (0.05%)
Greek: 35 (0.04%)
Norwegian: 35 (0.04%)
Arab: 33 (0.04%)
South African: 31 (0.04%)
Afghan: 29 (0.03%)
Belgian: 25 (0.03%)
Northern European: 24 (0.03%)
Moroccan: 23 (0.03%)
Armenian: 20 (0.02%)
Canadian: 20 (0.02%)
Senegalese: 19 (0.02%)
Lebanese: 16 (0.02%)
Scottish: 16 (0.02%)
Iranian: 16 (0.02%)
Egyptian: 14 (0.02%)
Bulgarian: 11 (0.01%)
U.S. Virgin Islander: 10 (0.01%)
Croatian: 9 (0.01%)
Slavic: 9 (0.01%)
Scotch-Irish: 5 (0.01%)
Belizean: 5 (0.01%)
Most common places of birth for foreign-born residents (%): Jamaica Hartford:
37.1% (9,995)Connecticut:
7.5% (40,568)
Dominican Republic Hartford:
9.7% (2,599)Connecticut:
5.0% (27,361)
Peru Hartford:
5.2% (1,401)Connecticut:
2.5% (13,591)
Colombia Hartford:
3.8% (1,023)Connecticut:
3.3% (18,124)
Mexico Hartford:
3.7% (984)Connecticut:
4.8% (25,802)
Bosnia and Herzegovina Hartford:
3.5% (952)Connecticut:
0.5% (2,749)
Guatemala Hartford:
3.3% (877)Connecticut:
3.2% (17,617)
India Hartford:
2.8% (750)Connecticut:
7.3% (39,879)
Brazil Hartford:
2.1% (571)Connecticut:
4.7% (25,461)
Guyana Hartford:
2.0% (536)Connecticut:
0.9% (5,157)
Honduras Hartford:
2.0% (530)Connecticut:
1.3% (7,220)
Place of birth for U.S.-born residents:
This state: 44,399Other state: 19,481Northeast: 11,533Midwest: 2,518South: 4,318West: 1,112 79.9% of Hartford residents lived in the same house 1 years ago.
Out of people who lived in different houses, 41.4% lived in this county.
Out of people who lived in different counties, 12.8% lived in Connecticut.
Hartford:
79.9%State average:
88.4%
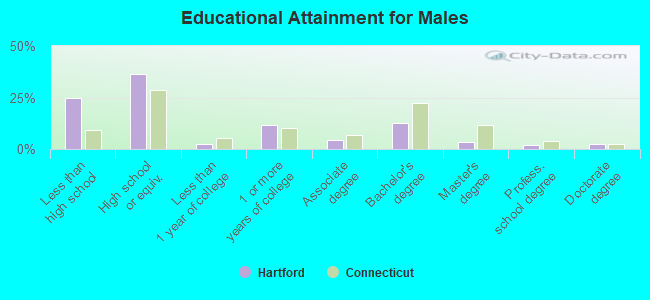
Education attainment for males 25 years and older:
No schooling: 2,643Nursery to 4th grade: 3605th and 6th grade: 2717th and 8th grade: 4869th grade: 76910th grade: 2,41211th grade: 38412th grade, no diploma: 1,595High school graduate (or equivalency): 13,233Less than 1 year of college: 901Some college more than 1 year, no degree: 4,194Associate degree: 1,593Bachelor's degree: 4,486Master's degree: 1,250Professional school degree: 711Doctorate degree: 844
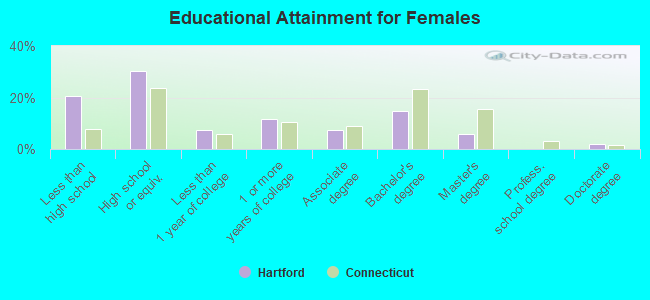
Education attainment for females 25 years and older:
No schooling: 2,424Nursery to 4th grade: 7375th and 6th grade: 1,0647th and 8th grade: 4999th grade: 1,27310th grade: 32411th grade: 79812th grade, no diploma: 1,163High school graduate (or equivalency): 12,130Less than 1 year of college: 2,888Some college more than 1 year, no degree: 4,686Associate degree: 3,005Bachelor's degree: 5,954Master's degree: 2,305Professional school degree: 31Doctorate degree: 821
Housing units in structures:
One, detached: 8,475One, attached: 3,090Two: 5,7593 or 4: 14,8415 to 9: 6,29110 to 19: 3,72520 to 49: 5,17950 or more: 9,894Mobile homes: 363Housing units lacking complete plumbing facilities in 2022: 1.9%Housing units lacking complete kitchen facilities in 2022: 2.0%House/condo owner moved in on average 15 years ago
Renter moved in on average 3 years ago
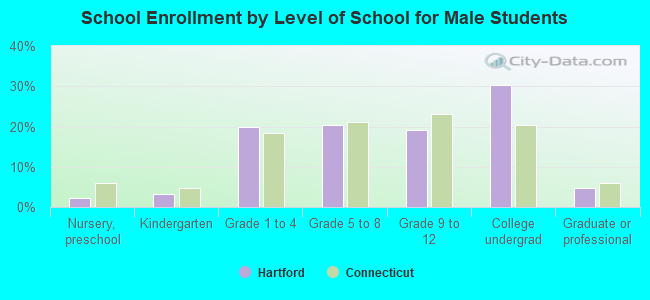
Private vs. public school enrollment:
Students in private schools in grades 1 to 8 (elementary and middle school): 780 Here:
6.2%Connecticut:
9.5%
Students in private schools in grades 9 to 12 (high school): 638 Here:
11.2%Connecticut:
12.9%
Students in private undergraduate colleges: 783 Here:
7.7%Connecticut:
35.5%