Hardin Valley, TN (Tennessee) Houses and Residents
| Hardin Valley: | $358,374 |
| Tennessee: | $284,800 |
Total population: 16,267 (Urban population: 8,750, Rural population: 5,922 (131 farm, 5,791 nonfarm))
Houses: 6,000 (5,662 occupied: 4,905 owner occupied, 757 renter occupied)
| % of renters here: | 13% |
| State: | 33% |
Housing density: 148 houses/condos per square mile
Median price asked for vacant for-sale houses and condos in 2022 in this county: $410,747.
Median contract rent in 2022: $1,089 (lower quartile is $831, upper quartile is $1,433)
Median rent asked for vacant for-rent units in 2022: $1,080
Median gross rent in Hardin Valley, TN in 2022: $1,274
Housing units in Hardin Valley with a mortgage: 2,776 (273 second mortgage, 360 home equity loan, 0 both second mortgage and home equity loan)
Houses without a mortgage: 1,135
Compare current foreclosures near Hardin Valley, TN:
| Photo | Address | Area | Beds / Baths | Price | Details |
|---|---|---|---|---|---|

|
#1
East St
Oliver Springs, TN 37840
|
1,672 sq. feet
|
2 baths 5 beds |
$119,900
|
show details |

|
#2
Eagle Glen Dr
Knoxville, TN 37922
|
3,664 sq. feet
|
3 baths 4 beds |
show details | |

|
#3
Wallace Rd
Knoxville, TN 37919
|
2,174 sq. feet
|
1 baths 4 beds |
show details | |

|
#4
Wilnoty Dr
Knoxville, TN 37931
|
1,580 sq. feet
|
2 baths 3 beds |
show details | |

|
#5
Marshall St
Clinton, TN 37716
|
864 sq. feet
|
1 baths 2 beds |
show details | |

|
#6
W Fulton St
Alcoa, TN 37701
|
625 sq. feet
|
1 baths 2 beds |
show details | |

|
#7
Walker Cir
Clinton, TN 37716
|
1,944 sq. feet
|
2 baths 3 beds |
show details | |

|
#8
Willow View Ln
Knoxville, TN 37922
|
1,742 sq. feet
|
3 baths 4 beds |
show details | |

|
#9
Hickey Rd
Knoxville, TN 37932
|
1,144 sq. feet
|
2 baths 3 beds |
show details | |

|
#10
S Alabama Rd
Oak Ridge, TN 37830
|
1,368 sq. feet
|
2 baths 3 beds |
show details |
| Photo | Address | Area | Beds / Baths | Price | Details |
|---|---|---|---|---|---|

|
#11
Yearling Rd
Knoxville, TN 37932
|
2,142 sq. feet
|
2 baths 3 beds |
show details | |

|
#12
Farmstead Ln
Powell, TN 37849
|
2,160 sq. feet
|
2 baths 3 beds |
show details | |

|
#13
Gilbert Ln
Knoxville, TN 37920
|
2,698 sq. feet
|
2 baths 5 beds |
show details | |

|
#14
Edgewood Dr
Powell, TN 37849
|
1,344 sq. feet
|
2 baths 3 beds |
show details | |

|
#15
Antietam Rd
Knoxville, TN 37917
|
1,125 sq. feet
|
2 baths 3 beds |
show details | |

|
#16
Grenada Blvd
Knoxville, TN 37922
|
2,508 sq. feet
|
2 baths 3 beds |
show details | |

|
#17
Old Andersonville Pike
Knoxville, TN 37938
|
1,160 sq. feet
|
2 baths 3 beds |
show details | |

|
#18
Central Avenue Pike
Knoxville, TN 37918
|
2,341 sq. feet
|
2 baths 3 beds |
show details | |

|
#19
Bennington Dr
Knoxville, TN 37909
|
1,125 sq. feet
|
1 baths 3 beds |
show details | |

|
#20
Kingsmore Dr
Knoxville, TN 37921
|
1,272 sq. feet
|
2 baths 3 beds |
show details |
| Photo | Address | Area | Beds / Baths | Price | Details |
|---|---|---|---|---|---|

|
#21
Kingsmore Dr
Knoxville, TN 37921
|
1,118 sq. feet
|
2 baths 3 beds |
show details | |

|
#22
Wil Loyd Dr
Knoxville, TN 37912
|
1,122 sq. feet
|
1 baths 2 beds |
show details | |

|
#23
Ironwood Rd
Knoxville, TN 37921
|
1,370 sq. feet
|
1 baths 3 beds |
show details | |

|
#24
Underhill Ln
Knoxville, TN 37921
|
1,274 sq. feet
|
1 baths 3 beds |
show details | |

|
#25
Paris Rd
Knoxville, TN 37912
|
1,296 sq. feet
|
2 baths 3 beds |
show details | |

|
#26
W Copeland Dr
Powell, TN 37849
|
1,128 sq. feet
|
1 baths 2 beds |
show details | |

|
#27
Windstone Blvd
Powell, TN 37849
|
1,796 sq. feet
|
2 baths 3 beds |
show details | |

|
#28
Francis Rd
Knoxville, TN 37909
|
1,711 sq. feet
|
1 baths 3 beds |
show details | |

|
#29
Intervale Way
Powell, TN 37849
|
1,000 sq. feet
|
2 baths 3 beds |
show details | |

|
#30
Brushy Valley Rd
Powell, TN 37849
|
1,488 sq. feet
|
1 baths 2 beds |
show details |
| Photo | Address | Area | Beds / Baths | Price | Details |
|---|---|---|---|---|---|

|
#31
Kim Watt Dr
Knoxville, TN 37909
|
1,156 sq. feet
|
1 baths 2 beds |
show details | |

|
#32
Camelia Rd NW
Knoxville, TN 37912
|
1,209 sq. feet
|
1 baths 3 beds |
show details | |

|
#33
Belmont Heights Ave
Knoxville, TN 37921
|
1,063 sq. feet
|
1 baths 2 beds |
show details | |

|
#34
Trehaven Dr
Knoxville, TN 37912
|
1,104 sq. feet
|
1 baths 3 beds |
show details | |

|
#35
Mcteer St
Knoxville, TN 37921
|
1,120 sq. feet
|
1 baths 3 beds |
show details | |

|
#36
Calla Ln
Powell, TN 37849
|
1,232 sq. feet
|
2 baths 3 beds |
show details | |

|
#37
Scandlyn Hollow Rd
Oliver Springs, TN 37840
|
1,568 sq. feet
|
2 baths - beds |
show details | |

|
#38
Foxworth Trl
Powell, TN 37849
|
1,864 sq. feet
|
2 baths 3 beds |
show details | |

|
#39
Connecticut Ave
Knoxville, TN 37921
|
832 sq. feet
|
1 baths 2 beds |
show details | |

|
#40
S Laurel Cir
Knoxville, TN 37912
|
1,038 sq. feet
|
1 baths 3 beds |
show details |
| Photo | Address | Area | Beds / Baths | Price | Details |
|---|---|---|---|---|---|

|
#41
Vermont Ave
Knoxville, TN 37921
|
1,410 sq. feet
|
1 baths 2 beds |
show details | |

|
#42
High School Rd
Knoxville, TN 37912
|
860 sq. feet
|
1 baths 2 beds |
show details | |

|
#43
Powell Heights Rd
Powell, TN 37849
|
1,248 sq. feet
|
1 baths 3 beds |
show details | |

|
#44
Debonair Dr
Knoxville, TN 37912
|
1,680 sq. feet
|
1 baths 2 beds |
show details | |

|
#45
Tupelo Way
Knoxville, TN 37912
|
1,243 sq. feet
|
2 baths 2 beds |
show details | |

|
#46
Tamworth Ln
Knoxville, TN 37921
|
1,284 sq. feet
|
1 baths 3 beds |
show details | |

|
#47
Sheffield Dr
Knoxville, TN 37909
|
2,779 sq. feet
|
2 baths 4 beds |
show details | |

|
#48
Trousdale Rd
Knoxville, TN 37921
|
1,336 sq. feet
|
1 baths 3 beds |
show details | |

|
#49
Mill Creek Ln
Knoxville, TN 37921
|
1,976 sq. feet
|
1 baths 3 beds |
show details | |

|
Check over 1 million property listings on Foreclosure.com!
|
browse all offers | |||

Household type by relationship:
Households: 419,878- In family households: 334,598 (78,196 male householders, 32,561 female householders)
83,377 spouses, 110,923 children (102,076 natural, 3,343 adopted, 5,504 stepchildren), 8,705 grandchildren, 3,434 brothers or sisters, 2,960 parents, foster children, 4,342 other relatives, 7,948 non-relatives
- In nonfamily households: 85,280 (30,493 male householders (22,660 living alone)), 35,999 female householders (29,897 living alone)), 18,788 nonrelatives
- In group quarters: 12,348 (3,241 institutionalized population)
58,209 married couples with children.
19,202 single-parent households (3,366 men, 15,836 women).
97.0% of residents of Hardin Valley speak English at home.
1.0% of residents speak Spanish at home (78% speak English very well, 5% speak English well, 17% speak English not well).
0.9% of residents speak other Indo-European language at home (78% speak English very well, 17% speak English well, 5% speak English not well).
0.5% of residents speak Asian or Pacific Island language at home (48% speak English very well, 36% speak English well, 16% speak English not well).
0.6% of residents speak other language at home (53% speak English very well, 13% speak English well, 34% speak English not well).
Foreign born population: 616 (3.2%)
(56.0% of them are naturalized citizens)
| Here: | 6.8 |
| State: | 6.5 |
| Here: | 4.2 |
| State: | 4.4 |
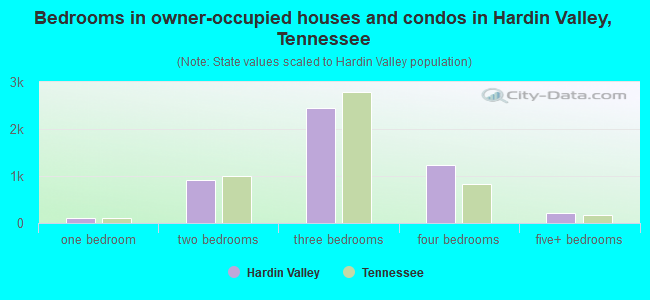
- Bedrooms in owner-occupied houses and condos in Hardin Valley, Tennessee
- 0no bedroom
- 1001 bedroom
- 9112 bedrooms
- 2,4443 bedrooms
- 1,2404 bedrooms
- 2105+ bedrooms
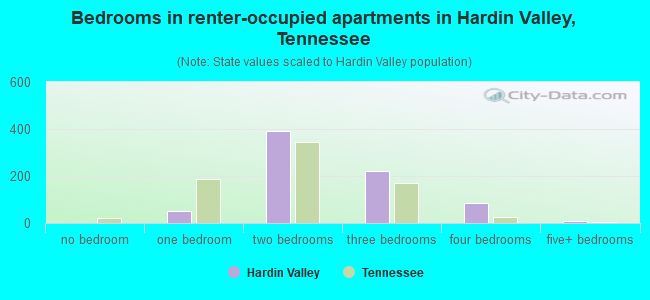
- Bedrooms in renter-occupied apartments in Hardin Valley, Tennessee
- 0no bedroom
- 511 bedroom
- 3932 bedrooms
- 2233 bedrooms
- 834 bedrooms
- 75+ bedrooms
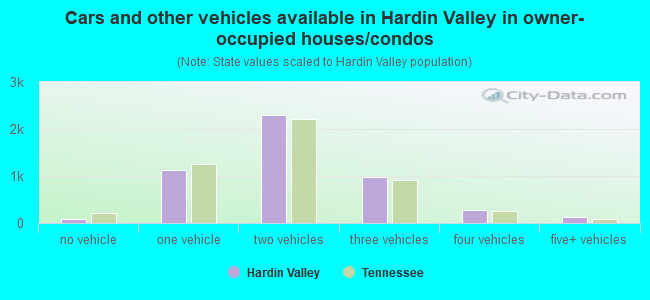
- Cars and other vehicles available in Hardin Valley in owner-occupied houses/condos
- 88no vehicle
- 1,1361 vehicle
- 2,3052 vehicles
- 9833 vehicles
- 2714 vehicles
- 1225+ vehicles
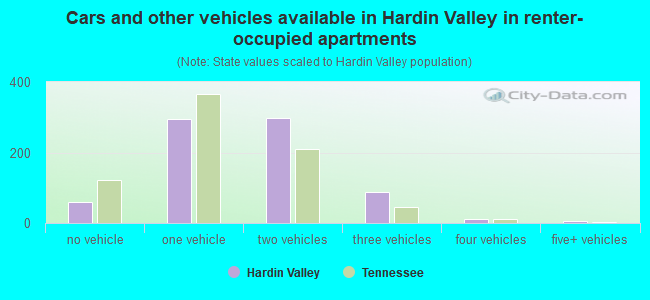
- Cars and other vehicles available in Hardin Valley in renter-occupied apartments
- 60no vehicle
- 2951 vehicle
- 2982 vehicles
- 883 vehicles
- 104 vehicles
- 65+ vehicles
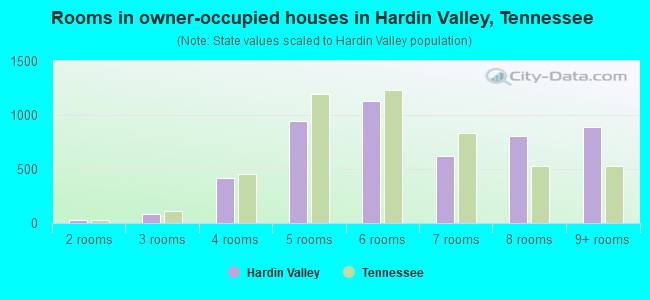
- Rooms in owner-occupied houses in Hardin Valley, Tennessee
- 01 room
- 242 rooms
- 833 rooms
- 4194 rooms
- 9415 rooms
- 1,1326 rooms
- 6177 rooms
- 8018 rooms
- 8889+ rooms
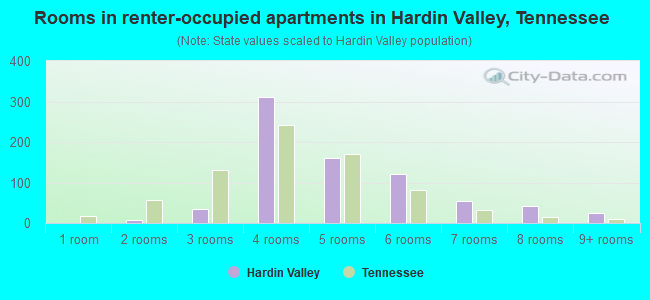
- Rooms in renter-occupied apartments in Hardin Valley, Tennessee
- 01 room
- 82 rooms
- 353 rooms
- 3114 rooms
- 1605 rooms
- 1216 rooms
- 557 rooms
- 438 rooms
- 249+ rooms
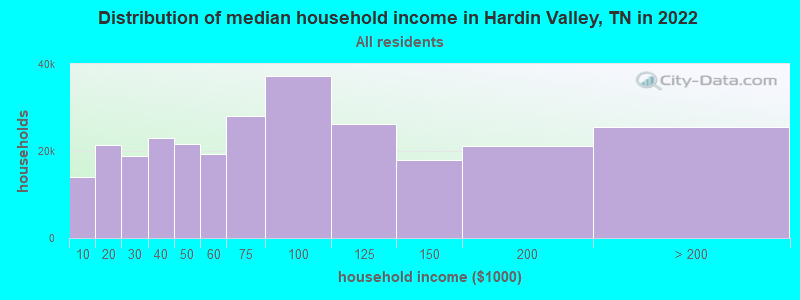
Hardin Valley, TN household income distribution

- 13,970Less than $10,000
- 21,348$10,000 to $19,999
- 18,787$20,000 to $29,999
- 22,961$30,000 to $39,999
- 21,697$40,000 to $49,999
- 19,388$50,000 to $59,999
- 28,051$60,000 to $74,999
- 37,214$75,000 to $99,999
- 26,187$100,000 to $124,999
- 17,860$125,000 to $149,999
- 21,114$150,000 to $199,999
- 25,428$200,000 or more
Percentage of workers working in this county: 69.0%
Number of people working at home: 1,394 (13.5% of all workers)
Travel time to work (commute)
- Less than 5 minutes: 105
- 5 to 9 minutes: 389
- 10 to 14 minutes: 986
- 15 to 19 minutes: 1,679
- 20 to 24 minutes: 1,430
- 25 to 29 minutes: 598
- 30 to 34 minutes: 1,264
- 35 to 39 minutes: 131
- 40 to 44 minutes: 195
- 45 to 59 minutes: 263
- 60 to 89 minutes: 102
- 90 or more minutes: 105
Means of transportation to work:
- Drove a car alone: 6,540 (86.4%)
- Carpooled: 669 (8.8%)
- Bicycle: 6 (0.1%)
- Walked: 25 (0.3%)
- Other means: 7 (0.1%)
- Worked at home: 325 (4.3%)
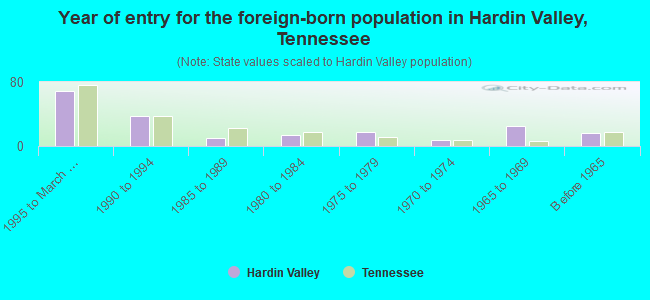
- Year of entry for the foreign-born population in Hardin Valley, Tennessee
- 691995 to March 2000
- 381990 to 1994
- 101985 to 1989
- 141980 to 1984
- 171975 to 1979
- 81970 to 1974
- 251965 to 1969
- 16Before 1965
Most common places of birth for foreign-born residents (%):
| Hardin Valley: | 14.2% (28) |
| Tennessee: | 0.3% (512) |
| Hardin Valley: | 11.7% (23) |
| Tennessee: | 0.2% (391) |
| Hardin Valley: | 11.7% (23) |
| Tennessee: | 0.5% (811) |
| Hardin Valley: | 10.7% (21) |
| Tennessee: | 2.3% (3,660) |
| Hardin Valley: | 8.6% (17) |
| Tennessee: | 5.2% (8,316) |
| Hardin Valley: | 7.1% (14) |
| Tennessee: | 3.8% (6,106) |
| Hardin Valley: | 6.1% (12) |
| Tennessee: | 1.1% (1,705) |
| Hardin Valley: | 6.1% (12) |
| Tennessee: | 1.0% (1,572) |
| Hardin Valley: | 5.1% (10) |
| Tennessee: | 0.4% (599) |
| Hardin Valley: | 4.6% (9) |
| Tennessee: | 0.5% (766) |
| Hardin Valley: | 4.1% (8) |
| Tennessee: | 0.3% (485) |
| Hardin Valley: | 3.6% (7) |
| Tennessee: | 1.1% (1,694) |
| Hardin Valley: | 3.6% (7) |
| Tennessee: | 0.8% (1,196) |
| Hardin Valley: | 3.0% (6) |
| Tennessee: | 1.1% (1,721) |
Place of birth for U.S.-born residents:
- This state: 9,115
- Other state: 5,288
- Northeast: 896
- Midwest: 1,199
- South: 2,674
- West: 519
54% of Hardin Valley residents lived in the same house 5 years ago.
Out of people who lived in different houses, 56% lived in this county.
Out of people who lived in different counties, 47% lived in Tennessee.
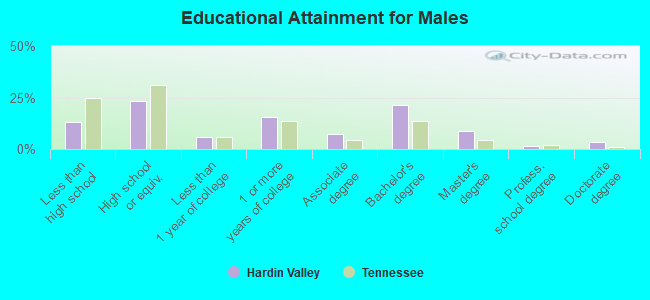
Education attainment for males 25 years and older:
- No schooling: 21
- Nursery to 4th grade: 38
- 5th and 6th grade: 24
- 7th and 8th grade: 159
- 9th grade: 92
- 10th grade: 82
- 11th grade: 88
- 12th grade, no diploma: 116
- High school graduate (or equivalency): 1,108
- Less than 1 year of college: 277
- Some college more than 1 year, no degree: 730
- Associate degree: 353
- Bachelor's degree: 1,029
- Master's degree: 424
- Professional school degree: 62
- Doctorate degree: 163
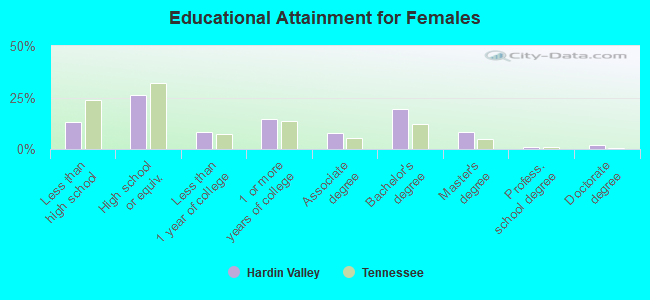
Education attainment for females 25 years and older:
- No schooling: 7
- Nursery to 4th grade: 6
- 5th and 6th grade: 49
- 7th and 8th grade: 166
- 9th grade: 71
- 10th grade: 117
- 11th grade: 97
- 12th grade, no diploma: 164
- High school graduate (or equivalency): 1,358
- Less than 1 year of college: 430
- Some college more than 1 year, no degree: 762
- Associate degree: 395
- Bachelor's degree: 1,007
- Master's degree: 427
- Professional school degree: 48
- Doctorate degree: 96


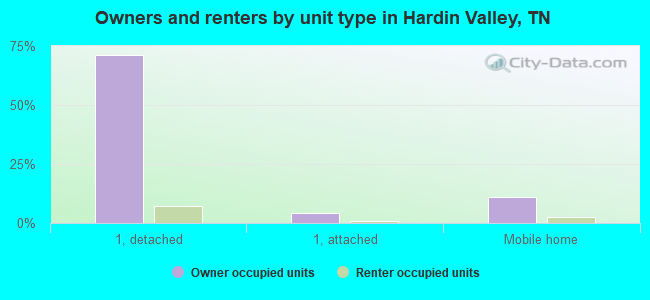
Housing units in structures:
- One, detached: 4,651
- One, attached: 318
- Two: 86
- 3 or 4: 61
- 5 to 9: 9
- 20 to 49: 28
- Mobile homes: 847
Median worth of mobile homes: $48,494
Housing units lacking complete kitchen facilities: 0.4%
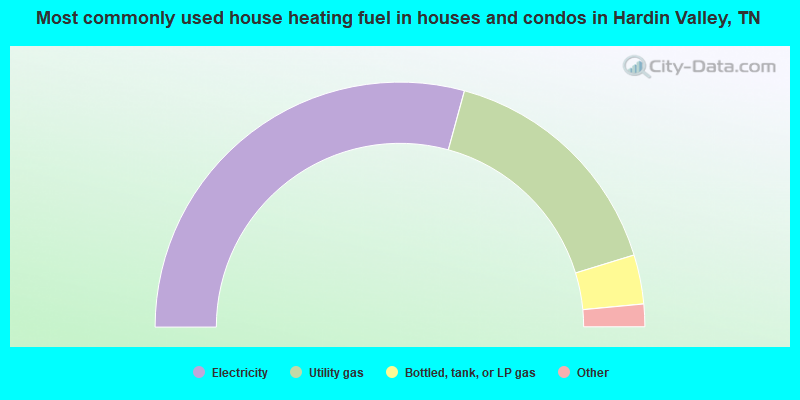
- 58.5%Electricity
- 32.0%Utility gas
- 6.5%Bottled, tank, or LP gas
- 1.6%Wood
- 1.2%Fuel oil, kerosene, etc.
- 0.2%No fuel used
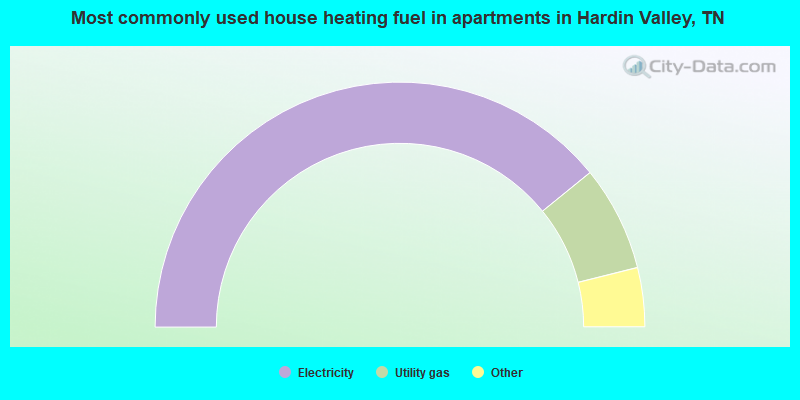
- 78.3%Electricity
- 13.9%Utility gas
- 4.0%Bottled, tank, or LP gas
- 2.8%Fuel oil, kerosene, etc.
- 1.1%Wood
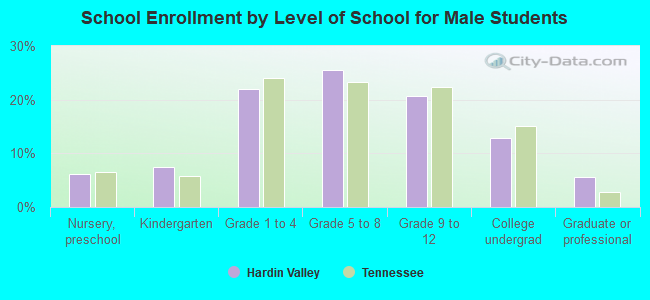
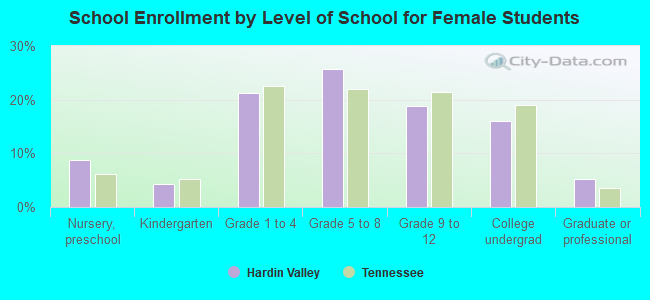
Private vs. public school enrollment:
| Here: | 16.3% |
| Tennessee: | 9.5% |
| Here: | 11.4% |
| Tennessee: | 10.4% |
| Here: | 12.3% |
| Tennessee: | 22.8% |