Hanaford, IL (Illinois) Houses and Residents
| Hanaford: | $54,403 |
| Illinois: | $251,600 |
Mean price in 2022:
Detached houses: $84,436
Here: $84,436 State: $310,164 Mobile homes: $36,028
Here: $36,028 State: $78,855
Total population: 317 (Urban population: 0, Rural population: 2 (all nonfarm))
Houses: 153 (143 occupied: 128 owner occupied, 17 renter occupied)
| % of renters here: | 12% |
| State: | 33% |
Housing density: 150 houses/condos per square mile
Median price asked for vacant for-sale houses and condos in 2022 in this county: $63,101.
Housing units in Hanaford with a mortgage: 28 (2 second mortgage, 0 home equity loan, 2 both second mortgage and home equity loan)
Houses without a mortgage: 0
Median household income for houses/condos with a mortgage: $69,463
Median household income for apartments without a mortgage: $50,781
Median monthly housing costs: $445
Compare current foreclosures near Hanaford, IL:
| Photo | Address | Area | Beds / Baths | Price | Details |
|---|---|---|---|---|---|

|
#1
S Gardner St
West Frankfort, IL 62896
|
1,196 sq. feet
|
1 baths 3 beds |
$105,000
|
show details |

|
#2
County Rd 100 N
Thompsonville, IL 62890
|
- sq. feet
|
- baths - beds |
$49,900
|
show details |

|
#3
N Lincoln St
West Frankfort, IL 62896
|
729 sq. feet
|
1 baths 1 beds |
show details | |

|
#4
Harmony Church Rd
West Frankfort, IL 62896
|
1,610 sq. feet
|
2 baths 3 beds |
show details | |

|
#5
N Emma St
Christopher, IL 62822
|
- sq. feet
|
- baths - beds |
$19,900
|
show details |

|
#6
W Tyler St
Herrin, IL 62948
|
1,120 sq. feet
|
1 baths 2 beds |
show details | |

|
#7
E Cleveland St
West Frankfort, IL 62896
|
1,500 sq. feet
|
2 baths 3 beds |
show details | |

|
#8
Napolean Rd
Marion, IL 62959
|
920 sq. feet
|
2 baths 3 beds |
show details | |

|
#9
Court H
Herrin, IL 62948
|
1,024 sq. feet
|
1 baths 3 beds |
show details | |

|
#10
E 7th St
West Frankfort, IL 62896
|
- sq. feet
|
2 baths 3 beds |
show details |
| Photo | Address | Area | Beds / Baths | Price | Details |
|---|---|---|---|---|---|

|
#11
S T. Road
Mulkeytown, IL 62865
|
1,823 sq. feet
|
1 baths 3 beds |
show details | |

|
#12
N State St
Marion, IL 62959
|
2,978 sq. feet
|
2 baths 4 beds |
show details | |

|
#13
S 18th St
Herrin, IL 62948
|
- sq. feet
|
1 baths 3 beds |
show details | |

|
#14
W Reed St
Benton, IL 62812
|
1,712 sq. feet
|
- baths 3 beds |
show details | |

|
#15
N Horn St
West Frankfort, IL 62896
|
- sq. feet
|
- baths - beds |
$19,900
|
show details |

|
#16
Joplin St
Benton, IL 62812
|
1 sq. feet
|
1 baths 3 beds |
show details | |

|
#17
Possum Flat Rd
Galatia, IL 62935
|
- sq. feet
|
2 baths 3 beds |
show details | |

|
#18
E Florence St
Sesser, IL 62884
|
- sq. feet
|
2 baths 3 beds |
show details | |

|
#19
S Douglas St
West Frankfort, IL 62896
|
1 sq. feet
|
1 baths 3 beds |
show details | |

|
#20
W Ray Ave
Christopher, IL 62822
|
720 sq. feet
|
1 baths 2 beds |
show details |
| Photo | Address | Area | Beds / Baths | Price | Details |
|---|---|---|---|---|---|

|
#21
E Ash St
Herrin, IL 62948
|
1,840 sq. feet
|
- baths - beds |
show details | |

|
#22
N Park Ave
Herrin, IL 62948
|
2,184 sq. feet
|
- baths - beds |
show details | |

|
#23
Gent Ave
Johnston City, IL 62951
|
1,568 sq. feet
|
- baths - beds |
show details | |

|
#24
S T Rd
Mulkeytown, IL 62865
|
- sq. feet
|
- baths - beds |
show details | |

|
#25
Rock Creek Rd
Pittsburg, IL 62974
|
- sq. feet
|
- baths - beds |
show details | |

|
#26
N 11th St
Herrin, IL 62948
|
- sq. feet
|
- baths - beds |
show details | |

|
#27
Montebello Dr
Herrin, IL 62948
|
- sq. feet
|
- baths - beds |
show details | |

|
#28
N 17th St
Herrin, IL 62948
|
- sq. feet
|
- baths - beds |
show details | |

|
#29
Spring Garden Rd
Marion, IL 62959
|
- sq. feet
|
- baths - beds |
show details | |

|
#30
Calico Rd
Marion, IL 62959
|
- sq. feet
|
- baths - beds |
show details |
| Photo | Address | Area | Beds / Baths | Price | Details |
|---|---|---|---|---|---|

|
#31
Zachary Dr
Marion, IL 62959
|
- sq. feet
|
- baths - beds |
show details | |

|
#32
Empress Ln
Herrin, IL 62948
|
- sq. feet
|
- baths - beds |
show details | |

|
#33
Galatia Post Rd
Marion, IL 62959
|
- sq. feet
|
- baths - beds |
show details | |

|
#34
Ford Rd
Thompsonville, IL 62890
|
- sq. feet
|
- baths - beds |
show details | |

|
#35
Circus St
Herrin, IL 62948
|
- sq. feet
|
- baths - beds |
show details | |

|
#36
Paulton Rd
Pittsburg, IL 62974
|
- sq. feet
|
- baths - beds |
show details | |

|
#37
Walker Rd
Johnston City, IL 62951
|
- sq. feet
|
- baths - beds |
show details | |

|
#38
Stotlar Rd
Johnston City, IL 62951
|
- sq. feet
|
- baths - beds |
show details | |

|
#39
Paulton Rd
Pittsburg, IL 62974
|
- sq. feet
|
- baths - beds |
show details | |

|
#40
Stotlar Rd
Marion, IL 62959
|
- sq. feet
|
- baths - beds |
show details |
| Photo | Address | Area | Beds / Baths | Price | Details |
|---|---|---|---|---|---|

|
#41
Switch Back Rd
Mulkeytown, IL 62865
|
- sq. feet
|
- baths - beds |
show details | |

|
#42
Pierce Sq
Herrin, IL 62948
|
- sq. feet
|
- baths - beds |
show details | |

|
#43
S Duncan St
Marion, IL 62959
|
- sq. feet
|
- baths - beds |
show details | |

|
#44
N 19th St
Herrin, IL 62948
|
- sq. feet
|
- baths - beds |
show details | |

|
#45
N Main St
Royalton, IL 62983
|
- sq. feet
|
- baths - beds |
show details | |

|
#46
E Bonnie Rd
Belle Rive, IL 62810
|
- sq. feet
|
- baths - beds |
show details | |

|
#47
Mountaineer Ln Apt C
Marion, IL 62959
|
- sq. feet
|
- baths - beds |
show details | |

|
#48
Bragg Ave
Marion, IL 62959
|
- sq. feet
|
- baths - beds |
show details | |

|
#49
Darren Dr
Marion, IL 62959
|
- sq. feet
|
- baths - beds |
show details | |

|
Check over 1 million property listings on Foreclosure.com!
|
browse all offers | |||


 | Barrington(s), Tower Lake, Wheaton, Inverness, and ? (55 replies) |
| Help us decide where to buy a house (41 replies) |

Median year apartment built: 1993
Household type by relationship:
Households: 346- Male householders: 84 (27 living alone), Female householders: 56 (13 living alone)
82 spouses (82 opposite-sex spouses), 10 unmarried partners, (7 opposite-sex unmarried partners), 77 children (77 natural, 0 adopted, 0 stepchildren), 11 grandchildren, 0 brothers or sisters, 2 parents, 0 foster children, 0 other relatives, 18 non-relatives
Size of family households: 51 2-persons, 21 3-persons, 8 4-persons, 12 5-persons, 4 6-persons.
Size of nonfamily households: 43 1-person, 3 3-persons.
37 married couples with children.
27 single-parent households (14 men, 13 women).
95.6% of residents of Hanaford speak English at home.
3.1% of residents speak other language at home (60% speak English very well, 40% speak English well).
Foreign born population: 3 (0.9%)
(100.0% of them are naturalized citizens)
| Here: | 5.6 |
| State: | 6.4 |
| Here: | 5.7 |
| State: | 4.1 |

- Bedrooms in owner-occupied houses and condos in Hanaford, Illinois
- 3no bedroom
- 31 bedroom
- 412 bedrooms
- 693 bedrooms
- 94 bedrooms
- 35+ bedrooms

- Bedrooms in renter-occupied apartments in Hanaford, Illinois
- 0no bedroom
- 01 bedroom
- 92 bedrooms
- 83 bedrooms
- 04 bedrooms
- 05+ bedrooms

- Cars and other vehicles available in Hanaford in owner-occupied houses/condos
- 1no vehicle
- 411 vehicle
- 452 vehicles
- 233 vehicles
- 154 vehicles
- 35+ vehicles

- Cars and other vehicles available in Hanaford in renter-occupied apartments
- 6no vehicle
- 21 vehicle
- 72 vehicles
- 03 vehicles
- 24 vehicles
- 05+ vehicles

- Rooms in owner-occupied houses in Hanaford, Illinois
- 01 room
- 32 rooms
- 23 rooms
- 254 rooms
- 305 rooms
- 346 rooms
- 227 rooms
- 48 rooms
- 89+ rooms

- Rooms in renter-occupied apartments in Hanaford, Illinois
- 01 room
- 02 rooms
- 23 rooms
- 44 rooms
- 05 rooms
- 96 rooms
- 27 rooms
- 08 rooms
- 09+ rooms


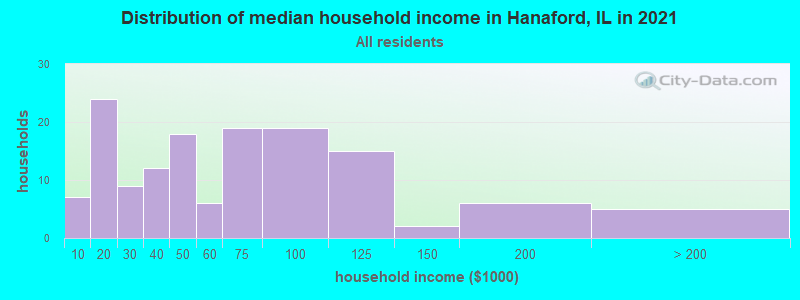
Hanaford, IL household income distribution

- 21$10,000 to $19,999
- 5$20,000 to $29,999
- 17$30,000 to $39,999
- 18$40,000 to $49,999
- 10$50,000 to $59,999
- 20$60,000 to $74,999
- 30$75,000 to $99,999
- 13$100,000 to $124,999
- 2$125,000 to $149,999
- 3$150,000 to $199,999
- 7$200,000 or more
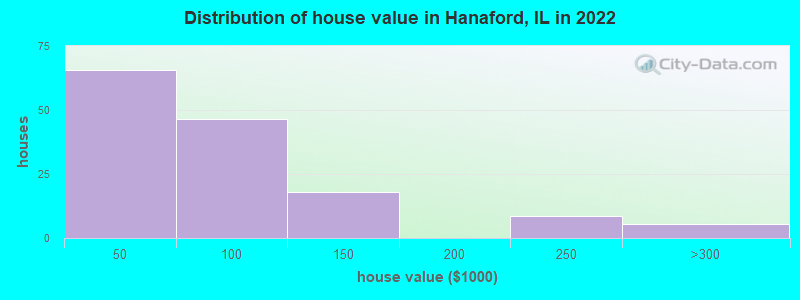
Home value of owner - occupied houses in 2022 in Hanaford, IL
-
- 8Less than $10,000
- 16$10,000 to $14,999
- 2$15,000 to $19,999
- 16$20,000 to $24,999
- 4$30,000 to $34,999
- 3$35,000 to $39,999
- 13$40,000 to $49,999
- 4$50,000 to $59,999
- 16$60,000 to $69,999
- 5$70,000 to $79,999
- 6$80,000 to $89,999
- 12$100,000 to $124,999
- 5$125,000 to $149,999
- 8$200,000 to $249,999
- 5$250,000 to $299,999
Rent paid by renters in 2022 in Hanaford, IL
-
- 4$400 to $449
- 1$550 to $599
- 7$600 to $649
- 5No cash rent


Percentage of workers working in this county: 55.4%
Number of people working at home: 14 (9.5% of all workers)
Travel time to work (commute)
- Less than 5 minutes: 6
- 5 to 9 minutes: 15
- 10 to 14 minutes: 21
- 15 to 19 minutes: 15
- 20 to 24 minutes: 28
- 25 to 29 minutes: 4
- 30 to 34 minutes: 17
- 35 to 39 minutes: 4
- 40 to 44 minutes: 8
- 45 to 59 minutes: 7
- 60 to 89 minutes: 1
- 90 or more minutes: 0
Means of transportation to work:
- Drove a car alone: 2 (100.0%)

- Unemployment by race in 2022
- Unemployment rate for White non-Hispanic residents
- 1.9%Males
- 6.4%Females

First ancestries reported:
- English: 26 (22.1%)
- American: 15 (12.7%)
- German: 14 (11.9%)
- Irish: 14 (11.9%)
- Polish: 8 (6.8%)
- European: 2 (1.7%)
- Italian: 2 (1.7%)
Most common places of birth for foreign-born residents (%):
| Hanaford: | 100.0% (3) |
| Illinois: | 0.4% (7,117) |
Place of birth for U.S.-born residents:
- This state: 272
- Other state: 69
- Northeast: 9
- Midwest: 40
- South: 14
- West: 6
88.7% of Hanaford residents lived in the same house 1 years ago.
Out of people who lived in different houses, 43.1% lived in this county.
Out of people who lived in different counties, 55.6% lived in Illinois.
| Hanaford: | 88.7% |
| State average: | 88.3% |
Education attainment for males 25 years and older:
- No schooling: 0
- Nursery to 4th grade: 0
- 5th and 6th grade: 0
- 7th and 8th grade: 0
- 9th grade: 0
- 10th grade: 0
- 11th grade: 6
- 12th grade, no diploma: 10
- High school graduate (or equivalency): 42
- Less than 1 year of college: 20
- Some college more than 1 year, no degree: 27
- Associate degree: 21
- Bachelor's degree: 0
- Master's degree: 3
- Professional school degree: 0
- Doctorate degree: 0

Education attainment for females 25 years and older:
- No schooling: 2
- Nursery to 4th grade: 0
- 5th and 6th grade: 0
- 7th and 8th grade: 0
- 9th grade: 1
- 10th grade: 2
- 11th grade: 1
- 12th grade, no diploma: 5
- High school graduate (or equivalency): 43
- Less than 1 year of college: 19
- Some college more than 1 year, no degree: 13
- Associate degree: 21
- Bachelor's degree: 9
- Master's degree: 0
- Professional school degree: 0
- Doctorate degree: 0


Housing units in structures:
- One, detached: 106
- 5 to 9: 3
- Mobile homes: 44
Median worth of mobile homes: $36,989
Housing units lacking complete kitchen facilities in 2022: 2.6%
House/condo owner moved in on average 20 years ago
Renter moved in on average 7 years ago
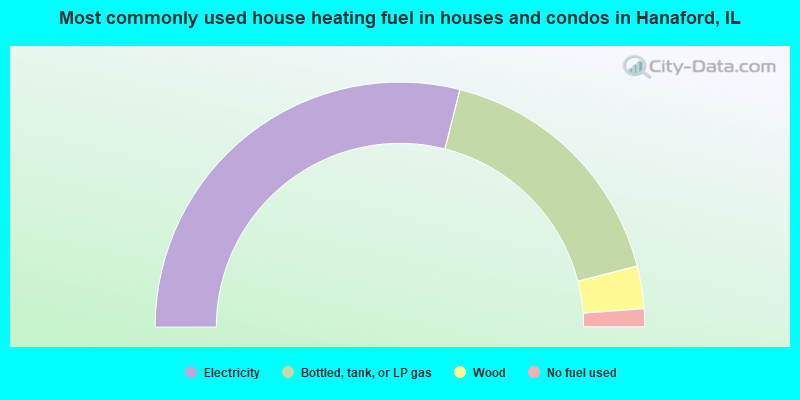
- 57.9%Electricity
- 34.1%Bottled, tank, or LP gas
- 5.6%Wood
- 2.4%No fuel used
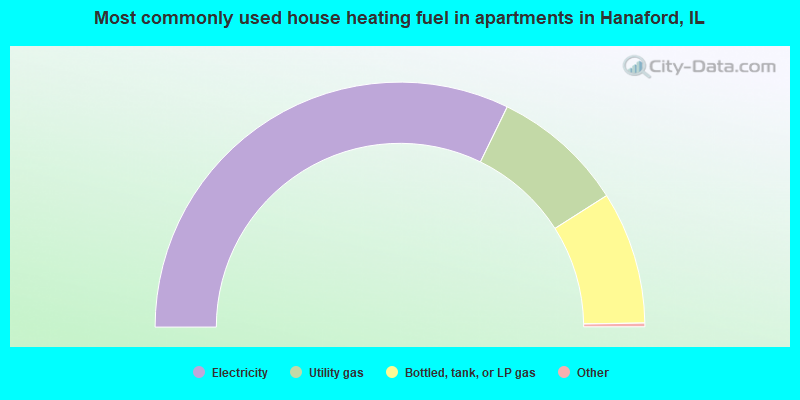
- 64.7%Electricity
- 17.6%Utility gas
- 17.6%Bottled, tank, or LP gas
Private vs. public school enrollment:
| Here: | 6.1% |
| Illinois: | 13.3% |
| Here: | 0.0% |
| Illinois: | 9.9% |
| Here: | 100.0% |
| Illinois: | 27.4% |

