Haddam, CT (Connecticut) Houses and Residents
| Haddam: | $388,925 |
| Connecticut: | $347,200 |
Total population: 8,346 (Urban population: 937, Rural population: 6,220 (49 farm, 6,171 nonfarm))
Houses: 2,822 (2,701 occupied: 2,314 owner occupied, 387 renter occupied)
| % of renters here: | 14% |
| State: | 34% |
Housing density: 64 houses/condos per square mile
Median price asked for vacant for-sale houses and condos in 2022 in this county: $431,754.
Median contract rent in 2022: $1,317 (lower quartile is $1,150, upper quartile is $1,872)
Median rent asked for vacant for-rent units in 2022: $1,230
Median gross rent in Haddam, CT in 2022: $1,639
Housing units in Haddam with a mortgage: 1,592 (130 second mortgage, 184 home equity loan, 0 both second mortgage and home equity loan)
Houses without a mortgage: 478
Compare current foreclosures near Haddam, CT:
| Photo | Address | Area | Beds / Baths | Price | Details |
|---|---|---|---|---|---|

|
#1
Little Meadow Rd
Haddam, CT 06438
|
- sq. feet
|
- baths - beds |
show details | |

|
#2
Willis Ave
Meriden, CT 06450
|
1,008 sq. feet
|
1 baths 2 beds |
$299,900
|
show details |

|
#3
Winthrop Blvd
Cromwell, CT 06416
|
1,092 sq. feet
|
1 baths 3 beds |
$220,000
|
show details |

|
#4
Railroad Ave
Chester, CT 06412
|
2,092 sq. feet
|
2 baths 4 beds |
$484,900
|
show details |

|
#5
Peck St
Berlin, CT 06037
|
608 sq. feet
|
1 baths 1 beds |
$144,900
|
show details |

|
#6
New London Rd
Colchester, CT 06415
|
1,938 sq. feet
|
3 baths 3 beds |
show details | |

|
#7
Hidden Valley Dr
Meriden, CT 06451
|
2,264 sq. feet
|
2 baths 4 beds |
show details | |

|
#8
Spring St
Meriden, CT 06451
|
660 sq. feet
|
1 baths 3 beds |
show details | |

|
#9
Orchard Rd
Berlin, CT 06037
|
4,100 sq. feet
|
4 baths 4 beds |
show details | |

|
#10
Fawn Dr
Meriden, CT 06451
|
1,766 sq. feet
|
2 baths 4 beds |
show details |
| Photo | Address | Area | Beds / Baths | Price | Details |
|---|---|---|---|---|---|

|
#11
Butternut Ln
Rocky Hill, CT 06067
|
1,176 sq. feet
|
1 baths 2 beds |
show details | |

|
#12
Pratt St
Meriden, CT 06450
|
1,040 sq. feet
|
2 baths 3 beds |
show details | |

|
#13
Mount Parnassus Rd
East Haddam, CT 06423
|
2,328 sq. feet
|
3 baths 3 beds |
show details | |

|
#14
Jones Hollow Rd
Marlborough, CT 06447
|
1,984 sq. feet
|
2 baths 3 beds |
show details | |

|
#15
Mountain Rd
Colchester, CT 06415
|
3,158 sq. feet
|
3 baths 3 beds |
show details | |

|
#16
Amity St
Meriden, CT 06450
|
1,568 sq. feet
|
2 baths 3 beds |
show details | |

|
#17
Center St
Wallingford, CT 06492
|
2,412 sq. feet
|
1 baths 2 beds |
show details | |

|
#18
Hope Valley Rd
Amston, CT 06231
|
2,128 sq. feet
|
2 baths 3 beds |
show details | |

|
#19
Orient St
Meriden, CT 06450
|
1,780 sq. feet
|
3 baths 3 beds |
show details | |

|
#20
Evansville Ave
Meriden, CT 06451
|
624 sq. feet
|
1 baths 3 beds |
show details |
| Photo | Address | Area | Beds / Baths | Price | Details |
|---|---|---|---|---|---|

|
#21
Feather Ln
North Branford, CT 06471
|
4,408 sq. feet
|
2 baths 4 beds |
show details | |

|
#22
Richard St Apt 2
Newington, CT 06111
|
710 sq. feet
|
1 baths 1 beds |
show details | |

|
#23
Hammond Ct
Colchester, CT 06415
|
1,152 sq. feet
|
1 baths 3 beds |
show details | |

|
#24
Episcopal Rd
Berlin, CT 06037
|
1,046 sq. feet
|
1 baths 3 beds |
show details | |

|
#25
Circlewood Dr
Berlin, CT 06037
|
1,878 sq. feet
|
2 baths 4 beds |
show details | |

|
#26
Oak St
Old Lyme, CT 06371
|
1,416 sq. feet
|
2 baths 3 beds |
show details | |

|
#27
Long St
Newington, CT 06111
|
1,094 sq. feet
|
1 baths 3 beds |
show details | |

|
#28
Westbrook Rd
Rocky Hill, CT 06067
|
1,239 sq. feet
|
1 baths 2 beds |
show details | |

|
#29
Catherine Dr
Meriden, CT 06450
|
869 sq. feet
|
2 baths 3 beds |
show details | |

|
#30
Curtis St
Meriden, CT 06450
|
1,786 sq. feet
|
1 baths 3 beds |
show details |
| Photo | Address | Area | Beds / Baths | Price | Details |
|---|---|---|---|---|---|

|
#31
Pool Rd
North Haven, CT 06473
|
1,272 sq. feet
|
1 baths 2 beds |
show details | |

|
#32
Boulter Rd
Wethersfield, CT 06109
|
2,056 sq. feet
|
2 baths 3 beds |
show details | |

|
#33
Prescott St
Meriden, CT 06450
|
2,700 sq. feet
|
3 baths 6 beds |
show details | |

|
#34
Wilderwood Dr
Guilford, CT 06437
|
1,956 sq. feet
|
2 baths 3 beds |
show details | |

|
#35
Beech St
North Branford, CT 06471
|
1,288 sq. feet
|
2 baths 3 beds |
show details | |

|
#36
Mary Ann Ln
Wallingford, CT 06492
|
1,704 sq. feet
|
2 baths 3 beds |
show details | |

|
#37
Webster St
Meriden, CT 06450
|
3,736 sq. feet
|
2 baths 8 beds |
show details | |

|
#38
Pleasant St
Meriden, CT 06450
|
2,794 sq. feet
|
2 baths 6 beds |
show details | |

|
#39
E Main St, Trlr 58
Branford, CT 06405
|
681 sq. feet
|
1 baths 1 beds |
show details | |

|
#40
N Main St
Wallingford, CT 06492
|
3,211 sq. feet
|
3 baths 6 beds |
show details |
| Photo | Address | Area | Beds / Baths | Price | Details |
|---|---|---|---|---|---|

|
#41
Ferry Ln
South Glastonbury, CT 06073
|
1,385 sq. feet
|
2 baths 3 beds |
show details | |

|
#42
Parum Rd # 3-05
Colchester, CT 06415
|
1,503 sq. feet
|
1 baths 3 beds |
show details | |

|
#43
Boston Post Rd
Guilford, CT 06437
|
10,836 sq. feet
|
4 baths 4 beds |
show details | |

|
#44
N Colony Rd Unit 1a
Meriden, CT 06450
|
1,088 sq. feet
|
1 baths 2 beds |
show details | |

|
#45
Henry St
Wallingford, CT 06492
|
1,312 sq. feet
|
1 baths 3 beds |
show details | |

|
#46
Long Hill Rd
Guilford, CT 06437
|
37,594 sq. feet
|
1 baths 3 beds |
show details | |

|
#47
Koczak Ct
North Haven, CT 06473
|
1,320 sq. feet
|
1 baths 3 beds |
show details | |

|
#48
Parker Ave N
Meriden, CT 06450
|
1,722 sq. feet
|
2 baths 2 beds |
show details | |

|
#49
Candlewood Hill Rd
Higganum, CT 06441
|
1,152 sq. feet
|
1 baths 3 beds |
show details | |

|
Check over 1 million property listings on Foreclosure.com!
|
browse all offers | |||
Latest news about housing in Haddam, CT collected exclusively by city-data.com from local newspapers, TV, and radio stations

 | Current Real estate markets (3987 replies) |
| Old Colonial Homes/Country Living/Schools in CT (58 replies) |
| 2024 Connecticut Town Tournament VI (Celebrating the 10-Year Anniversary & Dazzleman's Memorial) (1007 replies) |
| Weekend home in CT or Long Island? Can you guys help me make a decision? (54 replies) |
| Real Estate/Vacation Trip to CT - suggestions (37 replies) |
| New Yorkers buying Connecticut Homes (31 replies) |

Household type by relationship:
Households: 160,591- In family households: 131,621 (30,370 male householders, 13,373 female householders)
34,891 spouses, 44,052 children (41,443 natural, 1,059 adopted, 1,550 stepchildren), 1,876 grandchildren, 1,018 brothers or sisters, 1,359 parents, foster children, 1,032 other relatives, 2,795 non-relatives
- In nonfamily households: 28,970 (10,508 male householders (8,006 living alone)), 12,951 female householders (10,912 living alone)), 5,511 nonrelatives
- In group quarters: 5,085 (1,881 institutionalized population)
26,910 married couples with children.
6,210 single-parent households (1,312 men, 4,898 women).
95.1% of residents of Haddam speak English at home.
0.8% of residents speak Spanish at home (89% speak English very well, 11% speak English well).
3.8% of residents speak other Indo-European language at home (94% speak English very well, 6% speak English well).
0.1% of residents speak Asian or Pacific Island language at home (100% speak English very well).
0.1% of residents speak other language at home (100% speak English well).
Foreign born population: 355 (4.2%)
(70.1% of them are naturalized citizens)
| Here: | 7.1 |
| State: | 6.5 |
| Here: | 4.6 |
| State: | 4.0 |

- Bedrooms in owner-occupied houses and condos in Haddam, Connecticut
- 0no bedroom
- 1131 bedroom
- 3872 bedrooms
- 1,2033 bedrooms
- 5794 bedrooms
- 325+ bedrooms

- Bedrooms in renter-occupied apartments in Haddam, Connecticut
- 29no bedroom
- 1241 bedroom
- 1462 bedrooms
- 773 bedrooms
- 04 bedrooms
- 115+ bedrooms

- Cars and other vehicles available in Haddam in owner-occupied houses/condos
- 84no vehicle
- 3241 vehicle
- 1,1132 vehicles
- 5653 vehicles
- 1834 vehicles
- 455+ vehicles

- Cars and other vehicles available in Haddam in renter-occupied apartments
- 15no vehicle
- 1481 vehicle
- 1552 vehicles
- 693 vehicles
- 04 vehicles
- 05+ vehicles

- Rooms in owner-occupied houses in Haddam, Connecticut
- 01 room
- 232 rooms
- 303 rooms
- 1314 rooms
- 3645 rooms
- 4436 rooms
- 5267 rooms
- 4508 rooms
- 3479+ rooms

- Rooms in renter-occupied apartments in Haddam, Connecticut
- 291 room
- 122 rooms
- 513 rooms
- 944 rooms
- 1215 rooms
- 426 rooms
- 147 rooms
- 08 rooms
- 249+ rooms


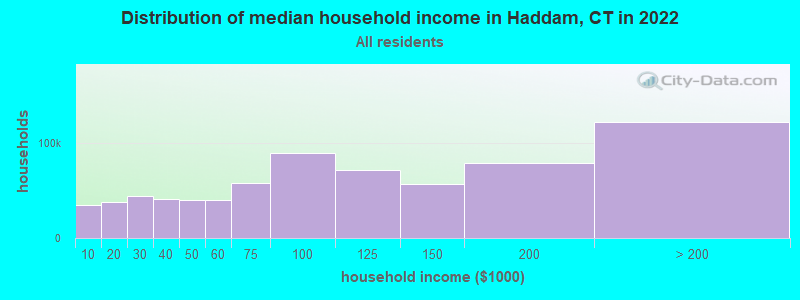
Haddam, CT household income distribution

- 18,005Less than $10,000
- 18,895$10,000 to $19,999
- 22,949$20,000 to $29,999
- 22,813$30,000 to $39,999
- 21,325$40,000 to $49,999
- 22,275$50,000 to $59,999
- 35,033$60,000 to $74,999
- 53,093$75,000 to $99,999
- 44,838$100,000 to $124,999
- 35,951$125,000 to $149,999
- 50,279$150,000 to $199,999
- 82,751$200,000 or more
Percentage of workers working in this county: 67.9%
Number of people working at home: 890 (18.4% of all workers)
Travel time to work (commute)
- Less than 5 minutes: 44
- 5 to 9 minutes: 287
- 10 to 14 minutes: 483
- 15 to 19 minutes: 502
- 20 to 24 minutes: 590
- 25 to 29 minutes: 275
- 30 to 34 minutes: 767
- 35 to 39 minutes: 356
- 40 to 44 minutes: 217
- 45 to 59 minutes: 313
- 60 to 89 minutes: 91
- 90 or more minutes: 78
Means of transportation to work:
- Drove a car alone: 3,602 (86.5%)
- Carpooled: 312 (7.5%)
- Bus or trolley bus: 29 (0.7%)
- Railroad: 15 (0.4%)
- Walked: 31 (0.7%)
- Other means: 14 (0.3%)
- Worked at home: 163 (3.9%)


- Year of entry for the foreign-born population in Haddam, Connecticut
- 01995 to March 2000
- 01990 to 1994
- 91985 to 1989
- 511980 to 1984
- 51975 to 1979
- 261970 to 1974
- 01965 to 1969
- 125Before 1965

First ancestries reported:
- Italian: 1,598 (16.9%)
- English: 1,359 (14.4%)
- Irish: 1,286 (13.6%)
- German: 960 (10.2%)
- Polish: 879 (9.3%)
- Other: 804 (8.5%)
- French: 594 (6.3%)
- Swedish: 355 (3.8%)
- French Canadian: 313 (3.3%)
- United States: 266 (2.8%)
- Scottish: 189 (2.0%)
- Czech: 144 (1.5%)
- Russian: 140 (1.5%)
- Lithuanian: 114 (1.2%)
- Scotch-Irish: 86 (0.9%)
- Hungarian: 58 (0.6%)
- Dutch: 54 (0.6%)
- Norwegian: 53 (0.6%)
- Ukrainian: 44 (0.5%)
- Slovak: 36 (0.4%)
- West Indian: 34 (0.4%)
- Danish: 26 (0.3%)
- Portuguese: 17 (0.2%)
- Welsh: 16 (0.2%)
- Swiss: 8 (0.08%)
- Subsaharan African: 7 (0.07%)
- Greek: 6 (0.06%)
Most common places of birth for foreign-born residents (%):
| Haddam: | 14.4% (31) |
| Connecticut: | 5.2% (19,083) |
| Haddam: | 12.0% (26) |
| Connecticut: | 4.4% (16,395) |
| Haddam: | 11.1% (24) |
| Connecticut: | 7.0% (26,023) |
| Haddam: | 7.4% (16) |
| Connecticut: | 6.9% (25,507) |
| Haddam: | 5.1% (11) |
| Connecticut: | 1.4% (5,021) |
| Haddam: | 4.6% (10) |
| Connecticut: | 0.4% (1,303) |
| Haddam: | 4.6% (10) |
| Connecticut: | 0.4% (1,463) |
| Haddam: | 4.6% (10) |
| Connecticut: | 2.4% (9,020) |
| Haddam: | 4.2% (9) |
| Connecticut: | 0.4% (1,374) |
| Haddam: | 4.2% (9) |
| Connecticut: | 3.1% (11,432) |
| Haddam: | 4.2% (9) |
| Connecticut: | 0.7% (2,465) |
| Haddam: | 3.7% (8) |
| Connecticut: | 0.9% (3,472) |
| Haddam: | 3.7% (8) |
| Connecticut: | 0.2% (566) |
| Haddam: | 3.7% (8) |
| Connecticut: | 7.2% (26,819) |
| Haddam: | 3.7% (8) |
| Connecticut: | 0.5% (2,025) |
| Haddam: | 3.2% (7) |
| Connecticut: | 1.5% (5,508) |
| Haddam: | 3.2% (7) |
| Connecticut: | 0.2% (640) |
| Haddam: | 2.3% (5) |
| Connecticut: | 0.6% (2,220) |
Place of birth for U.S.-born residents:
- This state: 5,141
- Other state: 1,716
- Northeast: 1,124
- Midwest: 272
- South: 256
- West: 64
71% of Haddam residents lived in the same house 5 years ago.
Out of people who lived in different houses, 59% lived in this county.
Out of people who lived in different counties, 66% lived in Connecticut.
Education attainment for males 25 years and older:
- No schooling: 0
- Nursery to 4th grade: 0
- 5th and 6th grade: 0
- 7th and 8th grade: 10
- 9th grade: 65
- 10th grade: 36
- 11th grade: 38
- 12th grade, no diploma: 64
- High school graduate (or equivalency): 835
- Less than 1 year of college: 113
- Some college more than 1 year, no degree: 311
- Associate degree: 173
- Bachelor's degree: 442
- Master's degree: 291
- Professional school degree: 60
- Doctorate degree: 42

Education attainment for females 25 years and older:
- No schooling: 0
- Nursery to 4th grade: 0
- 5th and 6th grade: 0
- 7th and 8th grade: 37
- 9th grade: 30
- 10th grade: 27
- 11th grade: 57
- 12th grade, no diploma: 62
- High school graduate (or equivalency): 708
- Less than 1 year of college: 141
- Some college more than 1 year, no degree: 365
- Associate degree: 274
- Bachelor's degree: 476
- Master's degree: 316
- Professional school degree: 47
- Doctorate degree: 21


Housing units in structures:
- One, detached: 2,632
- One, attached: 52
- Two: 54
- 3 or 4: 38
- 5 to 9: 25
- 10 to 19: 13
- Mobile homes: 8
Median worth of mobile homes: $180,344
Housing units lacking complete kitchen facilities: 0.6%

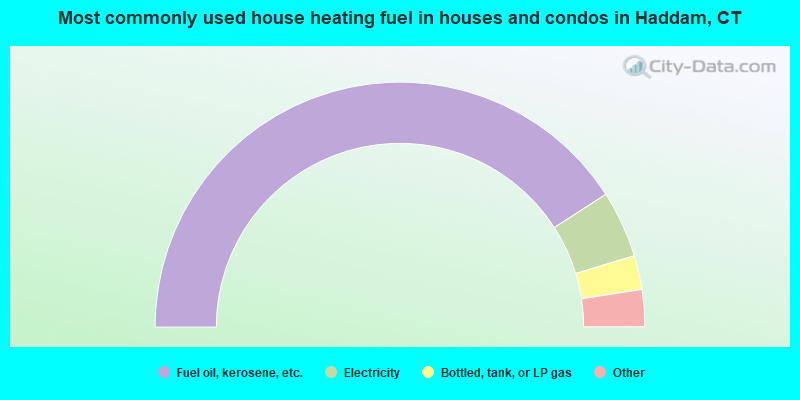
- 81.8%Fuel oil, kerosene, etc.
- 8.8%Electricity
- 4.5%Bottled, tank, or LP gas
- 3.8%Wood
- 0.4%Utility gas
- 0.3%Coal or coke
- 0.3%Solar energy
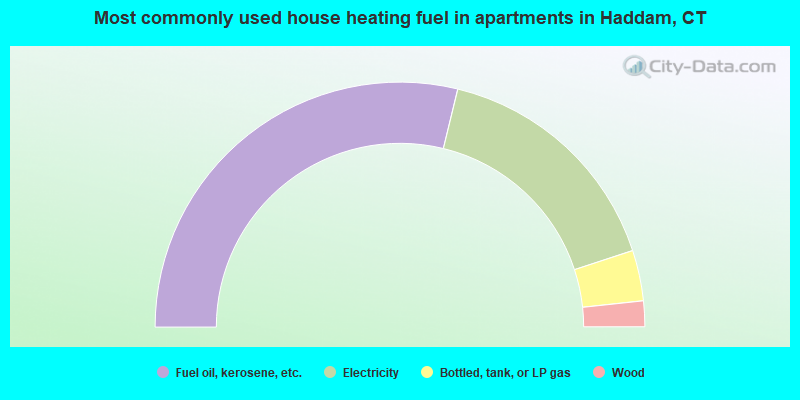
- 57.6%Fuel oil, kerosene, etc.
- 32.3%Electricity
- 6.7%Bottled, tank, or LP gas
- 3.4%Wood
Private vs. public school enrollment:
| Here: | 2.5% |
| Connecticut: | 9.9% |
| Here: | 1.9% |
| Connecticut: | 11.0% |
| Here: | 26.6% |
| Connecticut: | 33.4% |


