Groveland, MA (Massachusetts) Houses and Residents
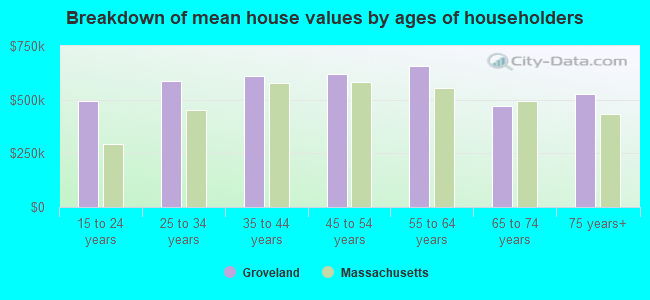
| Groveland: | $631,072 |
| Massachusetts: | $534,700 |
Total population: 6,459 (Urban population: 5,441, Rural population: 597 (12 farm, 585 nonfarm))
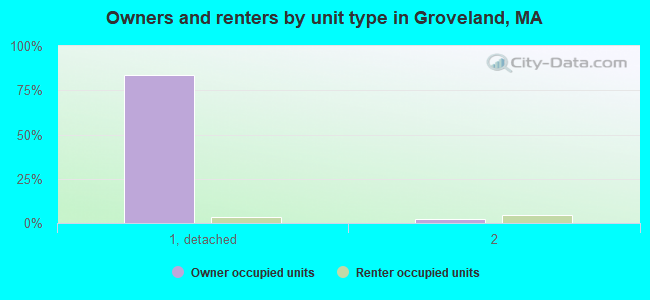
Houses: 2,096 (2,058 occupied: 1,776 owner occupied, 282 renter occupied)
| % of renters here: | 14% |
| State: | 38% |
Housing density: 234 houses/condos per square mile
Median price asked for vacant for-sale houses and condos in 2022 in this county: $495,592.
Median contract rent in 2022: $1,388 (lower quartile is $915, upper quartile is $1,925)
Median gross rent in Groveland, MA in 2022: $1,441
Housing units in Groveland with a mortgage: 1,302 (133 second mortgage, 263 home equity loan, 9 both second mortgage and home equity loan)
Houses without a mortgage: 384
Compare current foreclosures near Groveland, MA:
| Photo | Address | Area | Beds / Baths | Price | Details |
|---|---|---|---|---|---|

|
#1
King St
Groveland, MA 01834
|
2,713 sq. feet
|
3 baths 4 beds |
show details | |

|
#2
Center St
Groveland, MA 01834
|
1,923 sq. feet
|
2 baths 2 beds |
show details | |

|
#3
Byfield Rd
Groveland, MA 01834
|
1,488 sq. feet
|
2 baths 3 beds |
show details | |

|
#4
Brentwood Rd
Exeter, NH 03833
|
2,756 sq. feet
|
2 baths 3 beds |
$419,900
|
show details |

|
#5
Cedar St # A
Haverhill, MA 01830
|
1,134 sq. feet
|
2 baths 2 beds |
$209,300
|
show details |

|
#6
Tobey Ln
Wakefield, MA 01880
|
3,240 sq. feet
|
2 baths 4 beds |
show details | |

|
#7
Pine Ridge Rd
Windham, NH 03087
|
1,746 sq. feet
|
2 baths 4 beds |
show details | |

|
#8
High St
Exeter, NH 03833
|
3,075 sq. feet
|
3 baths 4 beds |
show details | |

|
#9
Redfield Cir
Derry, NH 03038
|
2,124 sq. feet
|
3 baths 4 beds |
show details | |

|
#10
Lyons St
Lowell, MA 01852
|
1,314 sq. feet
|
1 baths 2 beds |
show details |
| Photo | Address | Area | Beds / Baths | Price | Details |
|---|---|---|---|---|---|

|
#11
Bridge St
Lowell, MA 01850
|
- sq. feet
|
1 baths 3 beds |
show details | |

|
#12
Thornton St
Lawrence, MA 01841
|
912 sq. feet
|
1 baths 2 beds |
show details | |

|
#13
Salem St
North Andover, MA 01845
|
1,572 sq. feet
|
1 baths 2 beds |
show details | |

|
#14
Aiken Ave Apt 15
Lowell, MA 01850
|
1,100 sq. feet
|
1 baths 2 beds |
show details | |

|
#15
Chase St
Beverly, MA 01915
|
1,407 sq. feet
|
1 baths 3 beds |
show details | |

|
#16
Pierce St
Reading, MA 01867
|
1,837 sq. feet
|
2 baths 4 beds |
show details | |

|
#17
Lawrence Rd
Salem, NH 03079
|
1,305 sq. feet
|
1 baths 1 beds |
show details | |

|
#18
Maclarnon Rd
Salem, NH 03079
|
1,578 sq. feet
|
2 baths 3 beds |
show details | |

|
#19
Mill River Ln
Rowley, MA 01969
|
2,705 sq. feet
|
2 baths 4 beds |
show details | |

|
#20
Trull Rd
Tewksbury, MA 01876
|
1,942 sq. feet
|
2 baths 4 beds |
show details |
| Photo | Address | Area | Beds / Baths | Price | Details |
|---|---|---|---|---|---|

|
#21
Walden St
Beverly, MA 01915
|
1,854 sq. feet
|
2 baths 4 beds |
show details | |

|
#22
Baldwin Rd
Danvers, MA 01923
|
958 sq. feet
|
1 baths 2 beds |
show details | |

|
#23
Cider Mill Rd
Lynnfield, MA 01940
|
4,348 sq. feet
|
2 baths 2 beds |
show details | |

|
#24
Radcliffe Rd
Beverly, MA 01915
|
1,798 sq. feet
|
2 baths 3 beds |
show details | |

|
#25
Collins St
Danvers, MA 01923
|
1,729 sq. feet
|
2 baths 2 beds |
show details | |

|
#26
Sylvan St
Danvers, MA 01923
|
1,996 sq. feet
|
2 baths 3 beds |
show details | |

|
#27
South St
Tewksbury, MA 01876
|
1,068 sq. feet
|
1 baths 3 beds |
show details | |

|
#28
Meredith Rd
Peabody, MA 01960
|
1,542 sq. feet
|
1 baths 4 beds |
show details | |

|
#29
Flint St
Danvers, MA 01923
|
1,923 sq. feet
|
2 baths 4 beds |
show details | |

|
#30
Holten St Apt 8
Danvers, MA 01923
|
620 sq. feet
|
1 baths 2 beds |
show details |
| Photo | Address | Area | Beds / Baths | Price | Details |
|---|---|---|---|---|---|

|
#31
Tellier Way
Dracut, MA 01826
|
2,674 sq. feet
|
2 baths 4 beds |
show details | |

|
#32
Tokanel Rd
Windham, NH 03087
|
- sq. feet
|
1 baths 3 beds |
show details | |

|
#33
Trull Rd
Tewksbury, MA 01876
|
1,942 sq. feet
|
2 baths 4 beds |
show details | |

|
#34
Radcliffe Rd
Beverly, MA 01915
|
1,494 sq. feet
|
1 baths 3 beds |
show details | |

|
#35
Broad St
Wilmington, MA 01887
|
1,138 sq. feet
|
1 baths 3 beds |
show details | |

|
#36
Main St
Lynnfield, MA 01940
|
960 sq. feet
|
1 baths 2 beds |
show details | |

|
#37
Hinckley Rd
Tewksbury, MA 01876
|
1,306 sq. feet
|
1 baths 3 beds |
show details | |

|
#38
Albert Rd
Peabody, MA 01960
|
1,352 sq. feet
|
1 baths 3 beds |
show details | |

|
#39
Sudbury Ave
Wilmington, MA 01887
|
2,379 sq. feet
|
2 baths 5 beds |
show details | |

|
#40
Main St
Reading, MA 01867
|
2,337 sq. feet
|
2 baths 4 beds |
show details |
| Photo | Address | Area | Beds / Baths | Price | Details |
|---|---|---|---|---|---|

|
#41
Broad St
Peabody, MA 01960
|
1,560 sq. feet
|
2 baths 3 beds |
show details | |

|
#42
Cabot St
Beverly, MA 01915
|
1,697 sq. feet
|
1 baths 2 beds |
show details | |

|
#43
Erlin Ave
Tewksbury, MA 01876
|
1,917 sq. feet
|
2 baths 3 beds |
show details | |

|
#44
Beaver Ave
Lynnfield, MA 01940
|
1,344 sq. feet
|
1 baths 3 beds |
show details | |

|
#45
Madeline Rd
Tewksbury, MA 01876
|
1,152 sq. feet
|
1 baths 3 beds |
show details | |

|
#46
Summer St
Tewksbury, MA 01876
|
1,245 sq. feet
|
1 baths 2 beds |
show details | |

|
#47
Broad St
Wilmington, MA 01887
|
1,138 sq. feet
|
1 baths 3 beds |
show details | |

|
#48
Nugent Ln
Reading, MA 01867
|
1,350 sq. feet
|
2 baths 4 beds |
show details | |

|
#49
Collins St
Danvers, MA 01923
|
2,516 sq. feet
|
2 baths 3 beds |
show details | |

|
Check over 1 million property listings on Foreclosure.com!
|
browse all offers | |||
Latest news about housing in Groveland, MA collected exclusively by city-data.com from local newspapers, TV, and radio stations

 | How Much Massachusetts Households Make Per Year: Census Data (37 replies) |
| Home selling season in Northeast Mass.: Timing a visit from out of state to look for home to buy (30 replies) |
| Log house - experience/price? (9 replies) |
| towns that offer the most jobs per dollar of house (58 replies) |
| How important are school rankings? (119 replies) |
| Coronavirus in Massachusetts (18048 replies) |

Household type by relationship:
Households: 726,687- In family households: 606,990 (122,043 male householders, 65,962 female householders)
136,841 spouses, 221,565 children (210,337 natural, 5,012 adopted, 6,216 stepchildren), 11,988 grandchildren, 7,913 brothers or sisters, 8,558 parents, foster children, 9,566 other relatives, 17,265 non-relatives
- In nonfamily households: 119,697 (41,801 male householders (32,274 living alone)), 56,150 female householders (48,012 living alone)), 21,746 nonrelatives
- In group quarters: 16,472 (6,766 institutionalized population)
125,244 married couples with children.
42,832 single-parent households (7,363 men, 35,469 women).
95.3% of residents of Groveland speak English at home.
0.5% of residents speak Spanish at home (78% speak English very well, 22% speak English not well).
3.9% of residents speak other Indo-European language at home (86% speak English very well, 6% speak English well, 7% speak English not well).
0.3% of residents speak other language at home (47% speak English very well, 53% speak English well).
Foreign born population: 446 (6.6%)
(75.8% of them are naturalized citizens)
| Here: | 6.6 |
| State: | 6.5 |
| Here: | 4.1 |
| State: | 4.0 |
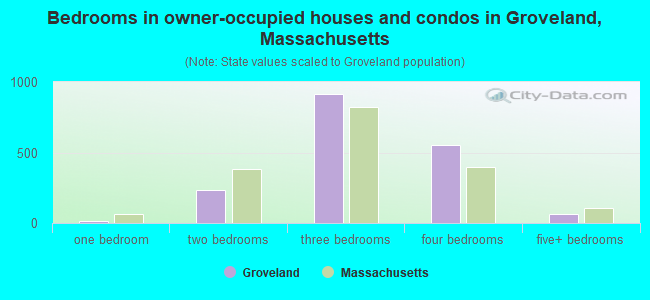
- Bedrooms in owner-occupied houses and condos in Groveland, Massachusetts
- 0no bedroom
- 171 bedroom
- 2322 bedrooms
- 9143 bedrooms
- 5514 bedrooms
- 625+ bedrooms
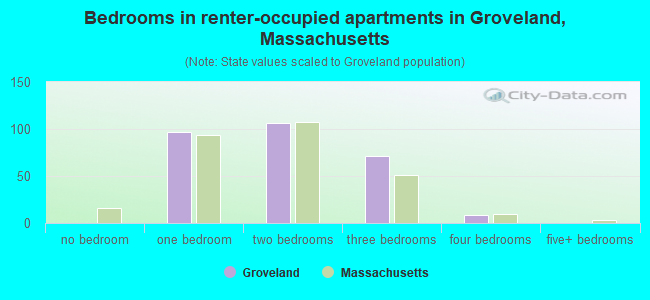
- Bedrooms in renter-occupied apartments in Groveland, Massachusetts
- 0no bedroom
- 971 bedroom
- 1062 bedrooms
- 713 bedrooms
- 84 bedrooms
- 05+ bedrooms
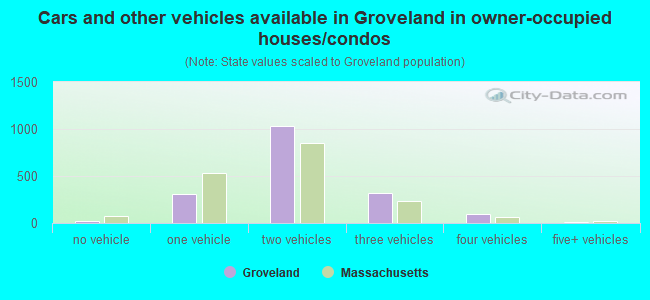
- Cars and other vehicles available in Groveland in owner-occupied houses/condos
- 23no vehicle
- 3051 vehicle
- 1,0332 vehicles
- 3163 vehicles
- 924 vehicles
- 75+ vehicles
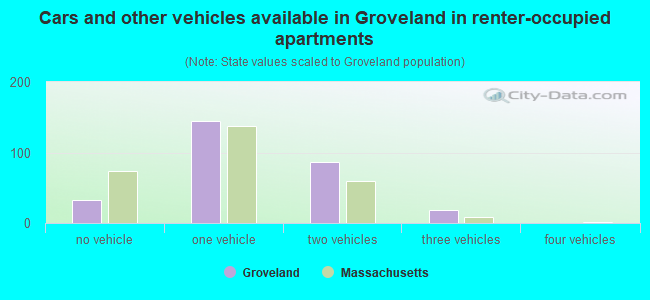
- Cars and other vehicles available in Groveland in renter-occupied apartments
- 32no vehicle
- 1441 vehicle
- 872 vehicles
- 193 vehicles
- 04 vehicles
- 05+ vehicles
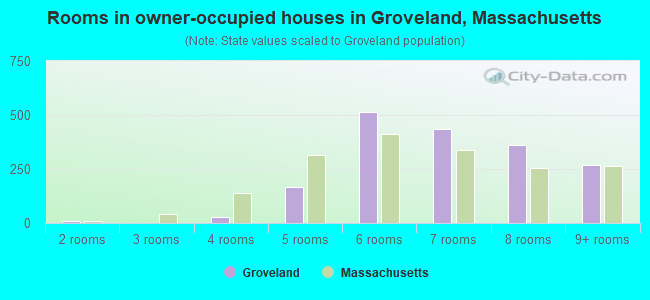
- Rooms in owner-occupied houses in Groveland, Massachusetts
- 01 room
- 82 rooms
- 03 rooms
- 264 rooms
- 1655 rooms
- 5146 rooms
- 4347 rooms
- 3628 rooms
- 2679+ rooms
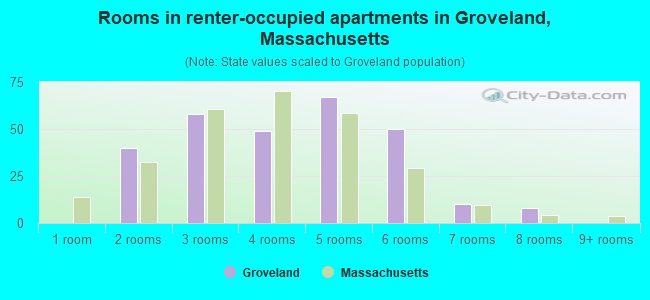
- Rooms in renter-occupied apartments in Groveland, Massachusetts
- 01 room
- 402 rooms
- 583 rooms
- 494 rooms
- 675 rooms
- 506 rooms
- 107 rooms
- 88 rooms
- 09+ rooms
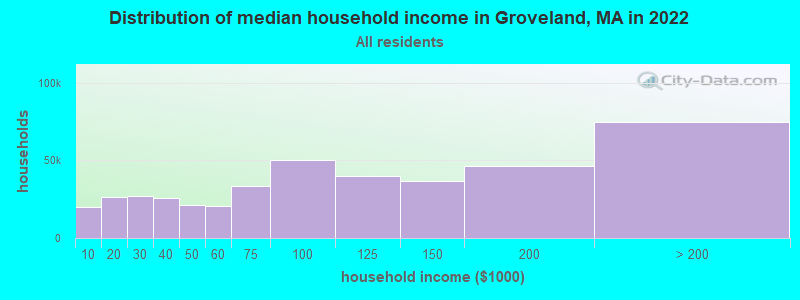
Groveland, MA household income distribution

- 19,676Less than $10,000
- 26,167$10,000 to $19,999
- 26,976$20,000 to $29,999
- 25,654$30,000 to $39,999
- 21,314$40,000 to $49,999
- 20,663$50,000 to $59,999
- 33,292$60,000 to $74,999
- 49,873$75,000 to $99,999
- 39,800$100,000 to $124,999
- 36,760$125,000 to $149,999
- 46,283$150,000 to $199,999
- 74,643$200,000 or more
Percentage of workers working in this county: 73.7%
Number of people working at home: 616 (16.3% of all workers)
Travel time to work (commute)
- Less than 5 minutes: 59
- 5 to 9 minutes: 353
- 10 to 14 minutes: 324
- 15 to 19 minutes: 338
- 20 to 24 minutes: 395
- 25 to 29 minutes: 229
- 30 to 34 minutes: 400
- 35 to 39 minutes: 221
- 40 to 44 minutes: 89
- 45 to 59 minutes: 319
- 60 to 89 minutes: 238
- 90 or more minutes: 77
Means of transportation to work:
- Drove a car alone: 2,710 (87.3%)
- Carpooled: 258 (8.3%)
- Bus or trolley bus: 12 (0.4%)
- Railroad: 35 (1.1%)
- Walked: 27 (0.9%)
- Worked at home: 62 (2.0%)
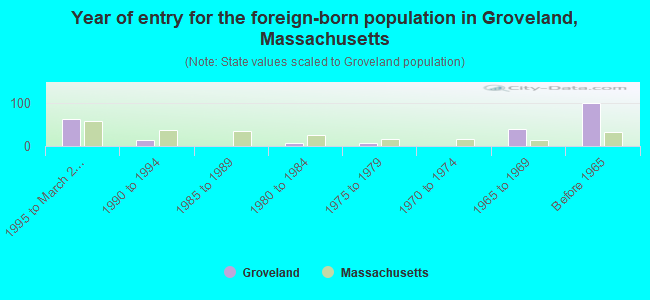
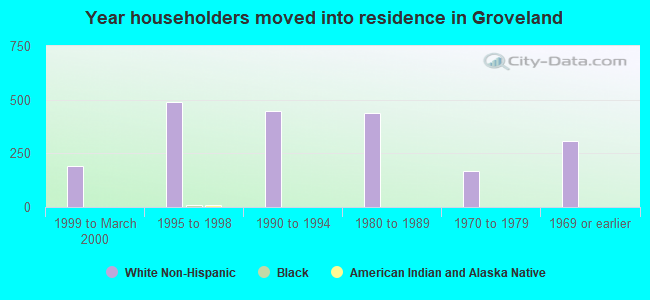
- Year of entry for the foreign-born population in Groveland, Massachusetts
- 631995 to March 2000
- 141990 to 1994
- 01985 to 1989
- 81980 to 1984
- 71975 to 1979
- 01970 to 1974
- 401965 to 1969
- 99Before 1965
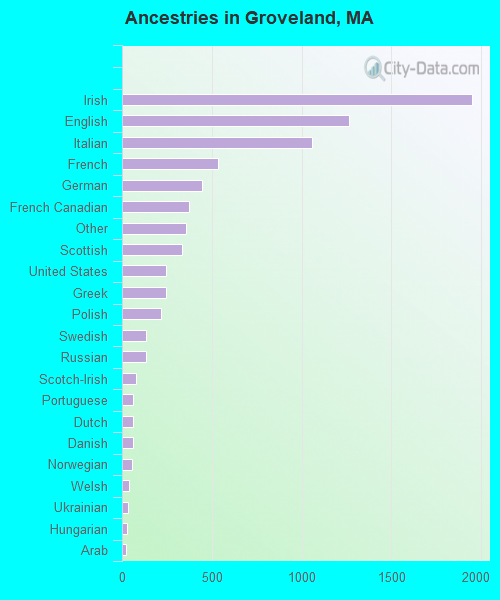
First ancestries reported:
- Irish: 1,946 (25.0%)
- English: 1,263 (16.3%)
- Italian: 1,059 (13.6%)
- French: 536 (6.9%)
- German: 446 (5.7%)
- French Canadian: 371 (4.8%)
- Other: 355 (4.6%)
- Scottish: 335 (4.3%)
- United States: 246 (3.2%)
- Greek: 243 (3.1%)
- Polish: 216 (2.8%)
- Swedish: 134 (1.7%)
- Russian: 133 (1.7%)
- Scotch-Irish: 78 (1.0%)
- Portuguese: 64 (0.8%)
- Dutch: 62 (0.8%)
- Danish: 59 (0.8%)
- Norwegian: 58 (0.7%)
- Welsh: 38 (0.5%)
- Ukrainian: 36 (0.5%)
- Hungarian: 26 (0.3%)
- Arab: 20 (0.3%)
- Swiss: 17 (0.2%)
- West Indian: 14 (0.2%)
- Czech: 8 (0.1%)
- Slovak: 8 (0.1%)
Most common places of birth for foreign-born residents (%):
| Groveland: | 19.0% (44) |
| Massachusetts: | 3.3% (25,403) |
| Groveland: | 13.9% (32) |
| Massachusetts: | 1.7% (12,975) |
| Groveland: | 10.4% (24) |
| Massachusetts: | 5.2% (40,247) |
| Groveland: | 8.2% (19) |
| Massachusetts: | 1.6% (12,350) |
| Groveland: | 7.4% (17) |
| Massachusetts: | 1.9% (14,883) |
| Groveland: | 6.1% (14) |
| Massachusetts: | 1.7% (12,808) |
| Groveland: | 5.6% (13) |
| Massachusetts: | 2.3% (17,449) |
| Groveland: | 5.6% (13) |
| Massachusetts: | 2.0% (15,286) |
| Groveland: | 5.2% (12) |
| Massachusetts: | 8.6% (66,627) |
| Groveland: | 3.5% (8) |
| Massachusetts: | 0.8% (5,895) |
| Groveland: | 3.5% (8) |
| Massachusetts: | 3.9% (30,457) |
| Groveland: | 3.0% (7) |
| Massachusetts: | 0.3% (2,511) |
| Groveland: | 3.0% (7) |
| Massachusetts: | 0.5% (3,810) |
| Groveland: | 3.0% (7) |
| Massachusetts: | 0.2% (1,729) |
| Groveland: | 2.6% (6) |
| Massachusetts: | 0.2% (1,273) |
Place of birth for U.S.-born residents:
- This state: 4,858
- Other state: 949
- Northeast: 707
- Midwest: 118
- South: 99
- West: 25
66% of Groveland residents lived in the same house 5 years ago.
Out of people who lived in different houses, 70% lived in this county.
Out of people who lived in different counties, 52% lived in Massachusetts.
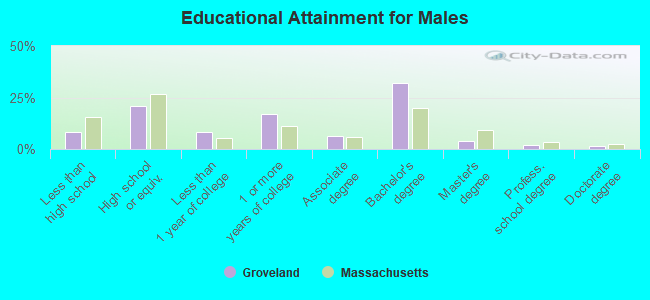
Education attainment for males 25 years and older:
- No schooling: 0
- Nursery to 4th grade: 0
- 5th and 6th grade: 12
- 7th and 8th grade: 19
- 9th grade: 7
- 10th grade: 33
- 11th grade: 25
- 12th grade, no diploma: 62
- High school graduate (or equivalency): 396
- Less than 1 year of college: 156
- Some college more than 1 year, no degree: 328
- Associate degree: 122
- Bachelor's degree: 613
- Master's degree: 79
- Professional school degree: 35
- Doctorate degree: 30
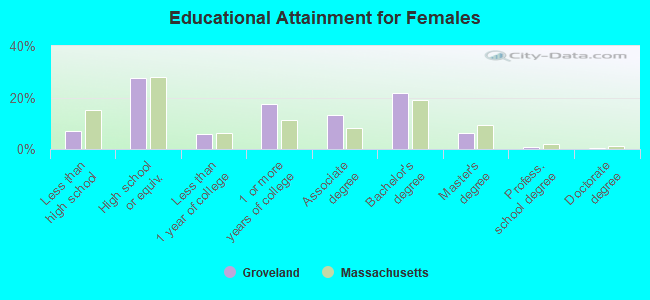
Education attainment for females 25 years and older:
- No schooling: 26
- Nursery to 4th grade: 0
- 5th and 6th grade: 0
- 7th and 8th grade: 8
- 9th grade: 14
- 10th grade: 24
- 11th grade: 39
- 12th grade, no diploma: 35
- High school graduate (or equivalency): 563
- Less than 1 year of college: 115
- Some college more than 1 year, no degree: 353
- Associate degree: 268
- Bachelor's degree: 445
- Master's degree: 123
- Professional school degree: 18
- Doctorate degree: 8
Housing units in structures:
- One, detached: 1,813
- One, attached: 22
- Two: 149
- 3 or 4: 72
- 5 to 9: 32
- 10 to 19: 8
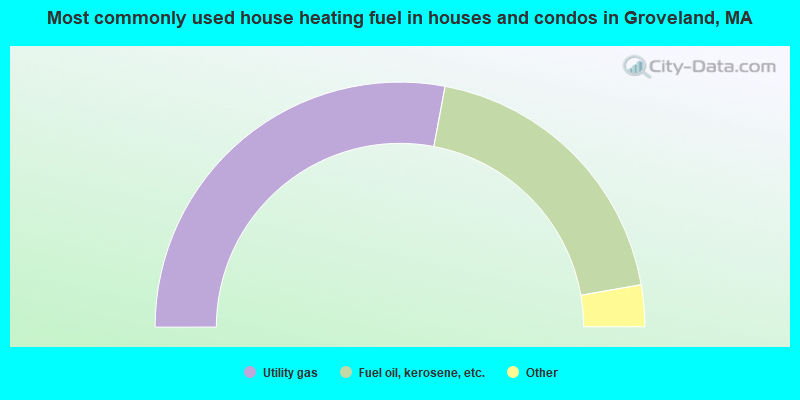
- 55.9%Utility gas
- 38.6%Fuel oil, kerosene, etc.
- 2.0%Electricity
- 1.5%Bottled, tank, or LP gas
- 1.0%Wood
- 1.0%Other fuel
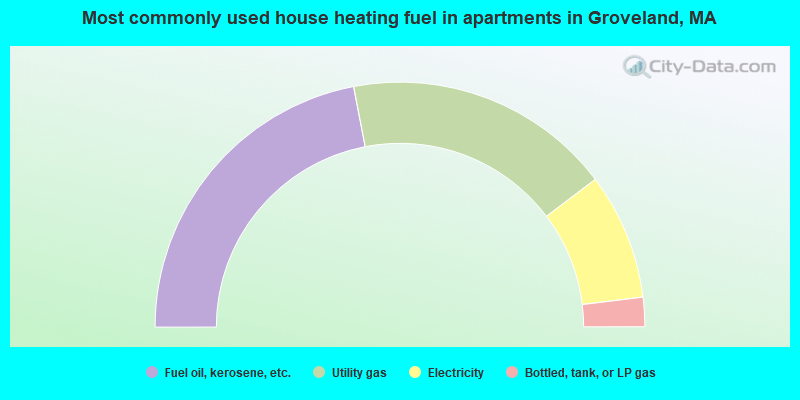
- 44.0%Fuel oil, kerosene, etc.
- 35.5%Utility gas
- 16.7%Electricity
- 3.9%Bottled, tank, or LP gas
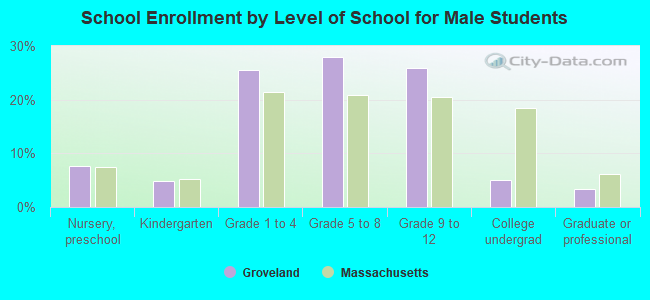
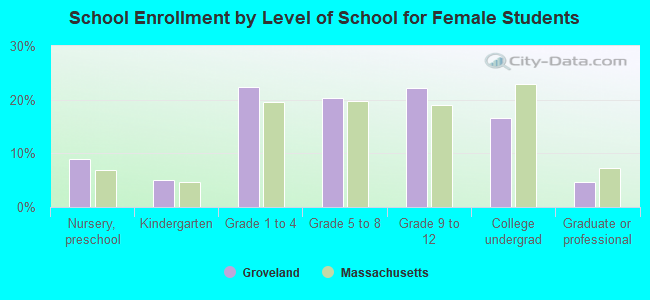
Private vs. public school enrollment:
| Here: | 0.8% |
| Massachusetts: | 10.8% |
| Here: | 3.3% |
| Massachusetts: | 12.2% |
| Here: | 28.7% |
| Massachusetts: | 48.2% |