Greensboro, NC (North Carolina) Houses and Residents
Estimated median house or condo value in 2022: $228,400 (it was $104,700 in 2000 )
Greensboro:
$228,400North Carolina:
$280,600
Lower value quartile - upper value quartile: $152,900 - $347,000Mean price in 2022: Detached houses: $297,193 Here:
$297,193State:
$375,326
Townhouses or other attached units: $222,694 Here:
$222,694State:
$317,935
In 2-unit structures: $152,447 Here:
$152,447State:
$250,488
In 3-to-4-unit structures: $105,205 Here:
$105,205State:
$254,939
In 5-or-more-unit structures: $131,562 Here:
$131,562State:
$329,290
Mobile homes: $145,091 Here:
$145,091State:
$124,933
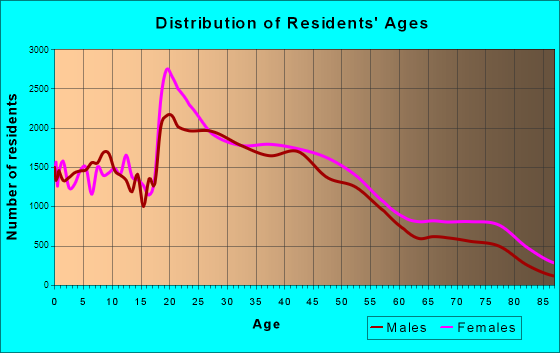
Total population: 282,586 (Urban population: 222,029, Rural population: 1,270 (6 farm, 1,264 nonfarm ))
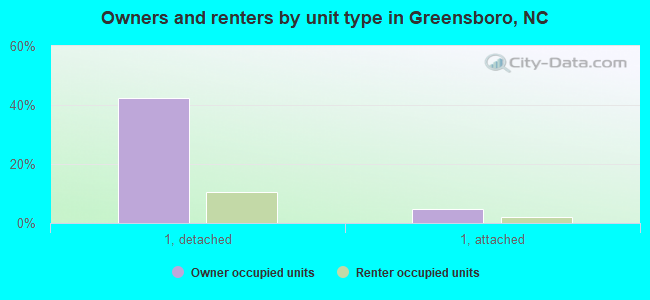
Houses: 133,125 (122,726 occupied: 61,485 owner occupied, 61,241 renter occupied )
% of renters here:
50%State:
33%
Housing density: 1,271 houses/condos per square mile
Median price asked for vacant for-sale houses and condos in 2022: $229,961.
Median contract rent in 2022: $915 (lower quartile is $688, upper quartile is $1,170)
Median rent asked for vacant for-rent units in 2022: $548
Median gross rent in Greensboro, NC in 2022: $1,081
Housing units in Greensboro with a mortgage: 41,425 (5,319 second mortgage, 132 home equity loan, 3,957 both second mortgage and home equity loan )Houses without a mortgage: 1,476
Median household income for houses/condos with a mortgage: $92,217
Median household income for apartments without a mortgage: $56,785
Median monthly housing costs: $1,029
Data:
Median house or condo value ($)
Median house or condo value ($ change since 2000)
Median house or condo value ($) - White
Median house or condo value ($) - Black or African American
Median house or condo value ($) - Asian
Median house or condo value ($) - Hispanic or Latino
Median house or condo value ($) - American Indian and Alaska Native
Median house or condo value ($) - Multirace
Median house or condo value ($) - Other Race
Median price asked for mobile homes ($)
Household density (households per square mile)
Mean house or condo value by units in structure - 1, detached ($)
Mean house or condo value by units in structure - 1, attached ($)
Mean house or condo value by units in structure - 2 ($)
Mean house or condo value by units in structure by units in structure - 3 or 4 ($)
Mean house or condo value by units in structure - 5 or more ($)
Mean house or condo value by units in structure - Boat, RV, van, etc. ($)
Mean house or condo value by units in structure - Mobile home ($)
Median contract rent ($)
Median contract rent - Lower quartile ($)
Median contract rent - Upper quartile ($)
Median gross rent ($)
Urban houses (%)
Rural houses (%)
Houses occupied (%)
Houses occupied (% change since 2000)
Houses owner occupied (%)
Houses owner occupied (% change since 2000)
Houses renter occupied (%)
Houses renter occupied (% change since 2000)
Vacant housing units - For rent (%)
Vacant housing units - For rent (% change since 2000)
Vacant housing units - For sale only (%)
Vacant housing units - For sale only (% change since 2000)
Vacant housing units - Rented or sold, not occupied (%)
Vacant housing units - Rented or sold, not occupied (% change since 2000)
Vacant housing units - For seasonal, recreational, or occasional use (%)
Vacant housing units - For seasonal, recreational, or occasional use (% change since 2000)
Vacant housing units - For migrant workers (%)
Vacant housing units - For migrant workers (% change since 2000)
Vacant housing units - Other vacant (%)
Vacant housing units - Other vacant (% change since 2000)
Median monthly housing costs ($)
Median household income for houses/condos with a mortgage ($)
Median household income for houses/condos without a mortgage ($)
Median household income ($)
Median household income ($) - White
Median household income ($) - Black or African American
Median household income ($) - Asian
Median household income ($) - Hispanic or Latino
Median household income ($) - American Indian and Alaska Native
Median household income ($) - Multirace
Median household income ($) - Other Race
Mortgage status - with mortgage (%)
Mortgage status - with second mortgage (%)
Mortgage status - with home equity loan (%)
Mortgage status - with both second mortgage and home equity loan (%)
Mortgage status - without a mortgage (%)
Median year house/condo built
Median year apartment built
Household type by relationship - Male householder living alone (%)
Household type by relationship - Male householder not living alone (%)
Household type by relationship - Female householder living alone (%)
Household type by relationship - Female householder not living alone (%)
Household type by relationship - Opposite-Sex spouse (%)
Household type by relationship - Same-Sex spouse (%)
Household type by relationship - Opposite-Sex unmarried partner (%)
Household type by relationship - Same-Sex unmarried partner (%)
Household type by relationship - In group quarters (%)
Size of family households - 2-person household (%)
Size of family households - 3-person household (%)
Size of family households - 4-person household (%)
Size of family households - 5-person household (%)
Size of family households - 6-person household (%)
Size of family households - 7-or-more-person household (%)
Size of nonfamily households - 1-person household (%)
Size of nonfamily households - 2-person household (%)
Size of nonfamily households - 3-person household (%)
Size of nonfamily households - 4-person household (%)
Size of nonfamily households - 5-person household (%)
Size of nonfamily households - 6-person household (%)
Size of nonfamily households - 7-or-moreperson household (%)
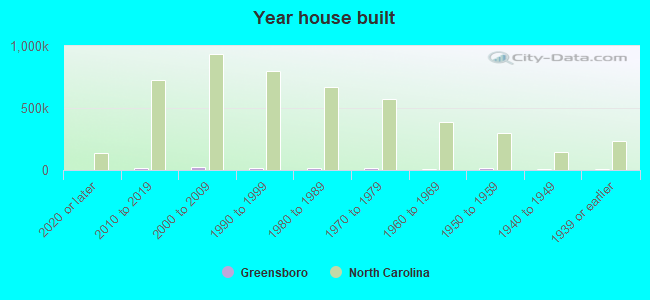
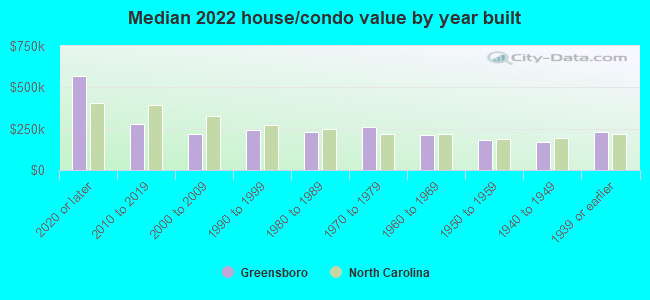
Year house built - Built 2010 or later (%)
Year house built - Built 2000 to 2009 (%)
Year house built - Built 1990 to 1999 (%)
Year house built - Built 1980 to 1989 (%)
Year house built - Built 1970 to 1979 (%)
Year house built - Built 1960 to 1969 (%)
Year house built - Built 1950 to 1959 (%)
Year house built - Built 1940 to 1949 (%)
Year house built - Built 1939 or earlier (%)
Median number of rooms in houses and condos
Median number of rooms in apartments
Median number of bedrooms in owner occupied houses
Mean number of bedrooms in owner occupied houses
Median number of bedrooms in renter occupied houses
Mean number of bedrooms in renter occupied houses
Median number of vehichles in owner occupied houses
Mean number of vehichles in owner occupied houses
Median number of vehichles in renter occupied houses
Mean number of vehichles in renter occupied houses
Rooms in owner-occupied houses - 1 room (%)
Rooms in owner-occupied houses - 2 rooms (%)
Rooms in owner-occupied houses - 3 rooms (%)
Rooms in owner-occupied houses - 4 rooms (%)
Rooms in owner-occupied houses - 5 rooms (%)
Rooms in owner-occupied houses - 6 rooms (%)
Rooms in owner-occupied houses - 7 rooms (%)
Rooms in owner-occupied houses - 8 rooms (%)
Rooms in owner-occupied houses - 9+ rooms (%)
Rooms in renter-occupied houses - 1 room (%)
Rooms in renter-occupied houses - 2 rooms (%)
Rooms in renter-occupied houses - 3 rooms (%)
Rooms in renter-occupied houses - 4 rooms (%)
Rooms in renter-occupied houses - 5 rooms (%)
Rooms in renter-occupied houses - 6 rooms (%)
Rooms in renter-occupied houses - 7 rooms (%)
Rooms in renter-occupied houses - 8 rooms (%)
Rooms in renter-occupied houses - 9+ rooms (%)
Bedrooms in owner-occupied houses - no bedrooms (%)
Bedrooms in owner-occupied houses - 1 bedroom (%)
Bedrooms in owner-occupied houses - 2 bedrooms (%)
Bedrooms in owner-occupied houses - 3 bedrooms (%)
Bedrooms in owner-occupied houses - 4 bedrooms (%)
Bedrooms in owner-occupied houses - 5+ bedrooms (%)
Bedrooms in renter-occupied houses - no bedrooms (%)
Bedrooms in renter-occupied houses - 1 bedroom (%)
Bedrooms in renter-occupied houses - 2 bedrooms (%)
Bedrooms in renter-occupied houses - 3 bedrooms (%)
Bedrooms in renter-occupied houses - 4 bedrooms (%)
Bedrooms in renter-occupied houses - 5+ bedrooms (%)
Vehicles available in owner-occupied houses - no vehicle available (%)
Vehicles available in owner-occupied houses - 1 vehicle available(%)
Vehicles available in owner-occupied houses - 2 Vehicles available (%)
Vehicles available in owner-occupied houses - 3 Vehicles available (%)
Vehicles available in owner-occupied houses - 4 Vehicles available (%)
Vehicles available in owner-occupied houses - 5+ Vehicles available (%)
Vehicles available in renter-occupied houses - no vehicle available (%)
Vehicles available in renter-occupied houses - 1 vehicle available (%)
Vehicles available in renter-occupied houses - 2 Vehicles available (%)
Vehicles available in renter-occupied houses - 3 Vehicles available (%)
Vehicles available in renter-occupied houses - 4 Vehicles available (%)
Vehicles available in renter-occupied houses - 5+ Vehicles available (%)
Housing units in structures - 1, detached (%)
Housing units in structures - 1, attached (%)
Housing units in structures - 2 (%)
Housing units in structures - 3 or 4 (%)
Housing units in structures - 5 to 9 (%)
Housing units in structures - 10 to 19 (%)
Housing units in structures - 20 to 49 (%)
Housing units in structures - 50 or more (%)
Housing units in structures - Mobile home (%)
Housing units in structures - Boat, RV, van, etc. (%)
Housing units in structures - Owners - 1, detached (%)
Housing units in structures - Owners - 1, attached (%)
Housing units in structures - Owners - 2 (%)
Housing units in structures - Owners - 3 or 4 (%)
Housing units in structures - Owners - 5 to 9 (%)
Housing units in structures - Owners - 10 to 19 (%)
Housing units in structures - Owners - 20 to 49 (%)
Housing units in structures - Owners - 50 or more (%)
Housing units in structures - Owners - Mobile home (%)
Housing units in structures - Owners - Boat, RV, van, etc. (%)
Housing units in structures - Renters - 1, detached (%)
Housing units in structures - Renters - 1, attached (%)
Housing units in structures - Renters - 2 (%)
Housing units in structures - Renters - 3 or 4 (%)
Housing units in structures - Renters - 5 to 9 (%)
Housing units in structures - Renters - 10 to 19 (%)
Housing units in structures - Renters - 20 to 49 (%)
Housing units in structures - Renters - 50 or more (%)
Housing units in structures - Renters - Mobile home (%)
Housing units in structures - Renters - Boat, RV, van, etc. (%)
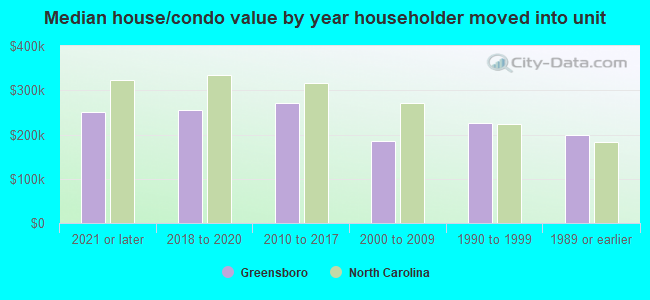
House/condo owner moved in on average (years ago)
Renter moved in on average (years ago)
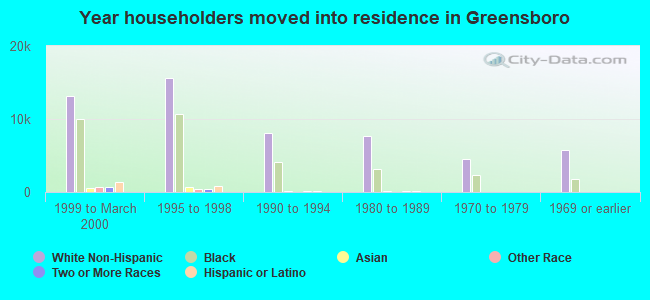
Year householder moved into unit - Moved in 1999 to March 2000 (%)
Year householder moved into unit - Moved in 1999 to March 2000 (%) - White
Year householder moved into unit - Moved in 1999 to March 2000 (%) - Black or African American
Year householder moved into unit - Moved in 1999 to March 2000 (%) - Asian
Year householder moved into unit - Moved in 1999 to March 2000 (%) - Hispanic or Latino
Year householder moved into unit - Moved in 1999 to March 2000 (%) - American Indian and Alaska Native
Year householder moved into unit - Moved in 1999 to March 2000 (%) - Multirace
Year householder moved into unit - Moved in 1999 to March 2000 (%) - Other Race
Year householder moved into unit - Moved in 1995 to 1998 (%)
Year householder moved into unit - Moved in 1995 to 1998 (%) - White
Year householder moved into unit - Moved in 1995 to 1998 (%) - Black or African American
Year householder moved into unit - Moved in 1995 to 1998 (%) - Asian
Year householder moved into unit - Moved in 1995 to 1998 (%) - Hispanic or Latino
Year householder moved into unit - Moved in 1995 to 1998 (%) - American Indian and Alaska Native
Year householder moved into unit - Moved in 1995 to 1998 (%) - Multirace
Year householder moved into unit - Moved in 1995 to 1998 (%) - Other Race
Year householder moved into unit - Moved in 1990 to 1994 (%)
Year householder moved into unit - Moved in 1990 to 1994 (%) - White
Year householder moved into unit - Moved in 1990 to 1994 (%) - Black or African American
Year householder moved into unit - Moved in 1990 to 1994 (%) - Asian
Year householder moved into unit - Moved in 1990 to 1994 (%) - Hispanic or Latino
Year householder moved into unit - Moved in 1990 to 1994 (%) - American Indian and Alaska Native
Year householder moved into unit - Moved in 1990 to 1994 (%) - Multirace
Year householder moved into unit - Moved in 1990 to 1994 (%) - Other Race
Year householder moved into unit - Moved in 1980 to 1989 (%)
Year householder moved into unit - Moved in 1980 to 1989 (%) - White
Year householder moved into unit - Moved in 1980 to 1989 (%) - Black or African American
Year householder moved into unit - Moved in 1980 to 1989 (%) - Asian
Year householder moved into unit - Moved in 1980 to 1989 (%) - Hispanic or Latino
Year householder moved into unit - Moved in 1980 to 1989 (%) - American Indian and Alaska Native
Year householder moved into unit - Moved in 1980 to 1989 (%) - Multirace
Year householder moved into unit - Moved in 1980 to 1989 (%) - Other Race
Year householder moved into unit - Moved in 1970 to 1979 (%)
Year householder moved into unit - Moved in 1970 to 1979 (%) - White
Year householder moved into unit - Moved in 1970 to 1979 (%) - Black or African American
Year householder moved into unit - Moved in 1970 to 1979 (%) - Asian
Year householder moved into unit - Moved in 1970 to 1979 (%) - Hispanic or Latino
Year householder moved into unit - Moved in 1970 to 1979 (%) - American Indian and Alaska Native
Year householder moved into unit - Moved in 1970 to 1979 (%) - Multirace
Year householder moved into unit - Moved in 1970 to 1979 (%) - Other Race
Year householder moved into unit - Moved in 1969 or earlier (%)
Year householder moved into unit - Moved in 1969 or earlier (%) - White
Year householder moved into unit - Moved in 1969 or earlier (%) - Black or African American
Year householder moved into unit - Moved in 1969 or earlier (%) - Asian
Year householder moved into unit - Moved in 1969 or earlier (%) - Hispanic or Latino
Year householder moved into unit - Moved in 1969 or earlier (%) - American Indian and Alaska Native
Year householder moved into unit - Moved in 1969 or earlier (%) - Multirace
Year householder moved into unit - Moved in 1969 or earlier (%) - Other Race
Housing units lacking complete plumbing facilities (%)
Housing units lacking complete kitchen facilities (%)
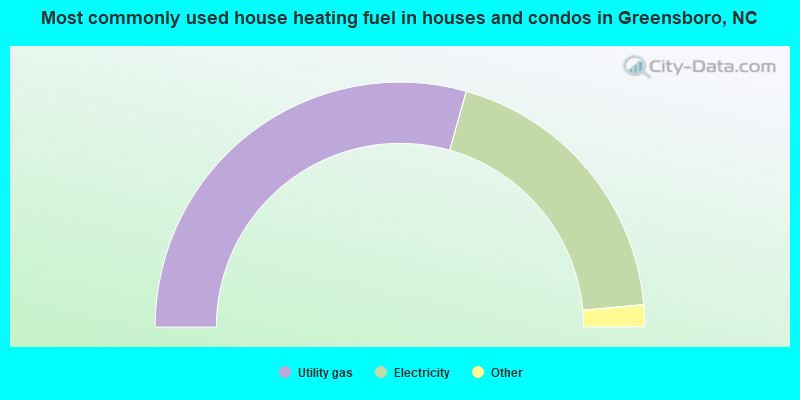
House heating fuel used in houses and condos - Utility gas (%)
House heating fuel used in houses and condos - Bottled, tank, or LP gas (%)
House heating fuel used in houses and condos - Electricity (%)
House heating fuel used in houses and condos - Fuel oil, kerosene, etc. (%)
House heating fuel used in houses and condos - Coal or coke (%)
House heating fuel used in houses and condos - Wood (%)
House heating fuel used in houses and condos - Solar energy (%)
House heating fuel used in houses and condos - Other fuel (%)
House heating fuel used in houses and condos - No fuel used (%)
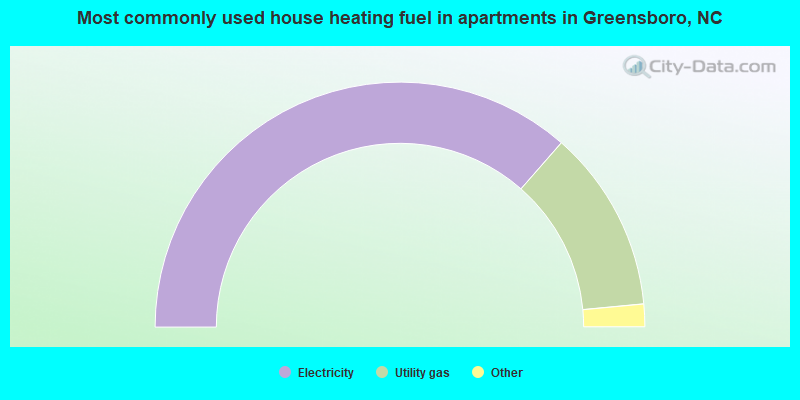
House heating fuel used in apartments - Utility gas (%)
House heating fuel used in apartments - Bottled, tank, or LP gas (%)
House heating fuel used in apartments - Electricity (%)
House heating fuel used in apartments - Fuel oil, kerosene, etc. (%)
House heating fuel used in apartments - Coal or coke (%)
House heating fuel used in apartments - Wood (%)
House heating fuel used in apartments - Solar energy (%)
House heating fuel used in apartments - Other fuel (%)
House heating fuel used in apartments - No fuel used (%)
Latest news about housing in Greensboro, NC collected exclusively by city-data.com from local newspapers, TV, and radio stations
Median year house/condo built: 1985Median year apartment built: 1986Household type by relationship:
Households: 301,118
Male householders: 52,526 (16,420 living alone ), Female householders: 70,200 (26,557 living alone )43,887 spouses (43,056 opposite-sex spouses ), 8,783 unmarried partners , (7,685 opposite-sex unmarried partners ), 81,207 children (76,663 natural , 1,632 adopted , 2,912 stepchildren ), 5,294 grandchildren , 5,304 brothers or sisters , 2,343 parents , 226 foster children , 4,267 other relatives , 9,958 non-relatives In group quarters: 17,123
Size of family households: 32,369 2-persons , 16,233 3-persons , 12,233 4-persons , 5,784 5-persons , 2,253 6-persons , 2,216 7-or-more-persons .
Size of nonfamily households: 42,977 1-person , 6,235 2-persons , 2,097 3-persons , 329 4-persons .
32,077 married couples with children. single-parent households (4,127 men , 22,126 women ).
82.8% of residents of Greensboro speak English at home. of residents speak Spanish at home (57% speak English very well , 23% speak English well , 15% speak English not well , 5% don't speak English at all ).of residents speak other Indo-European language at home (78% speak English very well , 18% speak English well , 4% speak English not well ).of residents speak Asian or Pacific Island language at home (53% speak English very well , 17% speak English well , 27% speak English not well , 3% don't speak English at all ).of residents speak other language at home (54% speak English very well , 30% speak English well , 10% speak English not well , 6% don't speak English at all ).
Foreign born population: 36,244 (12.0%)of them are naturalized citizens )
Median number of rooms in houses and condos:
Median number of rooms in apartments
Owner-occupied Renter-occupied
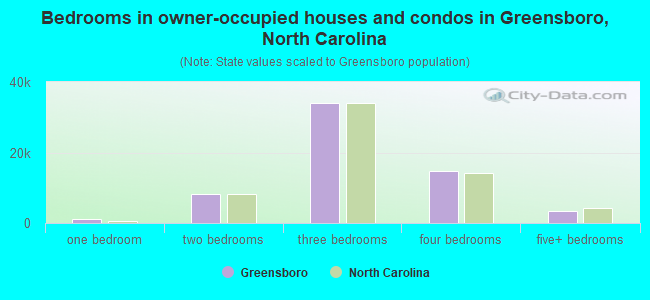
Bedrooms in owner-occupied houses and condos in Greensboro, North Carolina
252 no bedroom 1,000 1 bedroom 8,176 2 bedrooms 33,944 3 bedrooms 14,764 4 bedrooms 3,349 5+ bedrooms
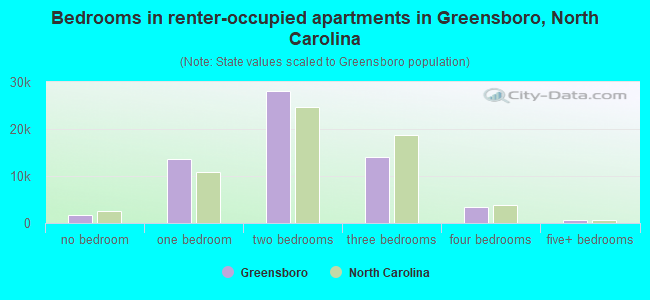
Bedrooms in renter-occupied apartments in Greensboro, North Carolina
1,721 no bedroom 13,512 1 bedroom 28,046 2 bedrooms 13,967 3 bedrooms 3,413 4 bedrooms 582 5+ bedrooms
Owner-occupied Renter-occupied
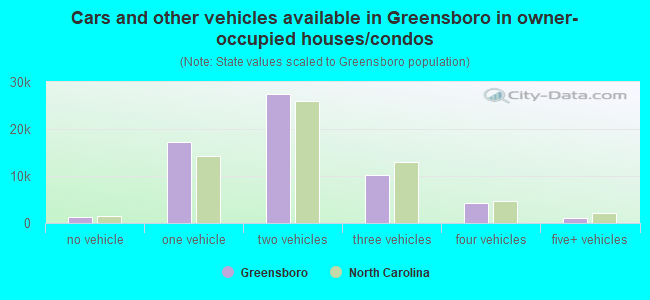
Cars and other vehicles available in Greensboro in owner-occupied houses/condos
1,262 no vehicle 17,279 1 vehicle 27,439 2 vehicles 10,314 3 vehicles 4,197 4 vehicles 994 5+ vehicles
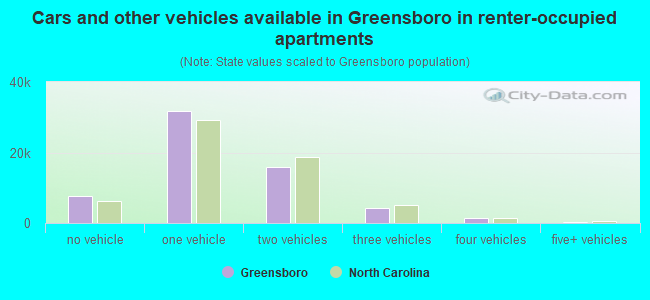
Cars and other vehicles available in Greensboro in renter-occupied apartments
7,725 no vehicle 31,705 1 vehicle 15,812 2 vehicles 4,304 3 vehicles 1,499 4 vehicles 196 5+ vehicles
Owner-occupied Renter-occupied
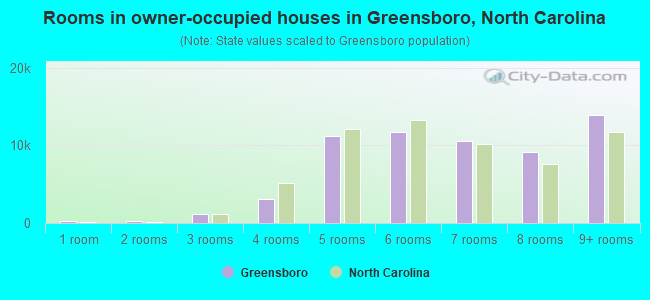
Rooms in owner-occupied houses in Greensboro, North Carolina
252 1 room 271 2 rooms 1,185 3 rooms 3,145 4 rooms 11,232 5 rooms 11,784 6 rooms 10,579 7 rooms 9,106 8 rooms 13,931 9+ rooms
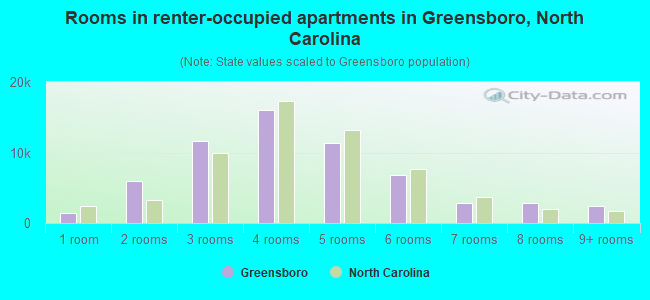
Rooms in renter-occupied apartments in Greensboro, North Carolina
1,481 1 room 5,911 2 rooms 11,607 3 rooms 15,970 4 rooms 11,409 5 rooms 6,806 6 rooms 2,846 7 rooms 2,833 8 rooms 2,378 9+ rooms
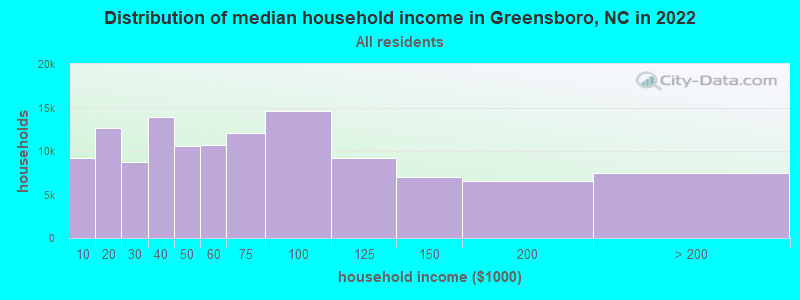
Greensboro, NC household income distribution 9,201 Less than $10,00012,661 $10,000 to $19,9998,738 $20,000 to $29,99913,872 $30,000 to $39,99910,519 $40,000 to $49,99910,661 $50,000 to $59,99912,033 $60,000 to $74,99914,652 $75,000 to $99,9999,247 $100,000 to $124,9997,057 $125,000 to $149,9996,605 $150,000 to $199,9997,480 $200,000 or more
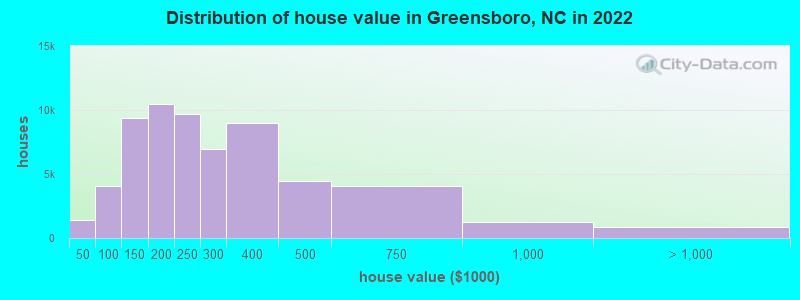
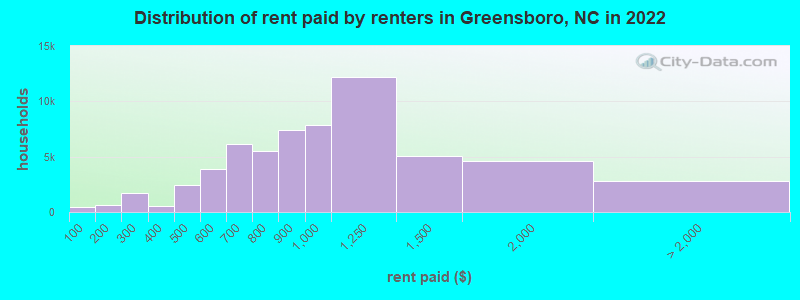
Home value of owner - occupied houses in 2022 in Greensboro, NC 273 Less than $10,000119 $10,000 to $14,999498 $15,000 to $19,999114 $20,000 to $24,99966 $25,000 to $29,999157 $30,000 to $34,999208 $40,000 to $49,999288 $50,000 to $59,9991,000 $60,000 to $69,999224 $70,000 to $79,999819 $80,000 to $89,9991,546 $90,000 to $99,9996,158 $100,000 to $124,9993,245 $125,000 to $149,9995,586 $150,000 to $174,9994,920 $175,000 to $199,9999,713 $200,000 to $249,9996,944 $250,000 to $299,9999,017 $300,000 to $399,9994,459 $400,000 to $499,9994,028 $500,000 to $749,9991,257 $750,000 to $999,999480 $1,000,000 to $1,499,999106 $1,500,000 to $1,999,999260 $2,000,000 or moreRent paid by renters in 2022 in Greensboro, NC 441 Less than $100510 $100 to $149149 $150 to $1991,086 $200 to $249588 $250 to $299364 $300 to $349206 $350 to $3991,301 $400 to $4491,124 $450 to $4991,539 $500 to $5492,335 $550 to $5992,818 $600 to $6493,312 $650 to $6993,247 $700 to $7492,305 $750 to $7997,396 $800 to $8997,851 $900 to $99912,208 $1,000 to $1,2495,056 $1,250 to $1,4994,621 $1,500 to $1,999597 $2,000 to $2,49945 $2,500 to $2,999103 $3,000 to $3,499638 $3,500 or more1,401 No cash rent
Percentage of workers working in this county: 85.9%Number of people working at home: 19,986 (13.7% of all workers )
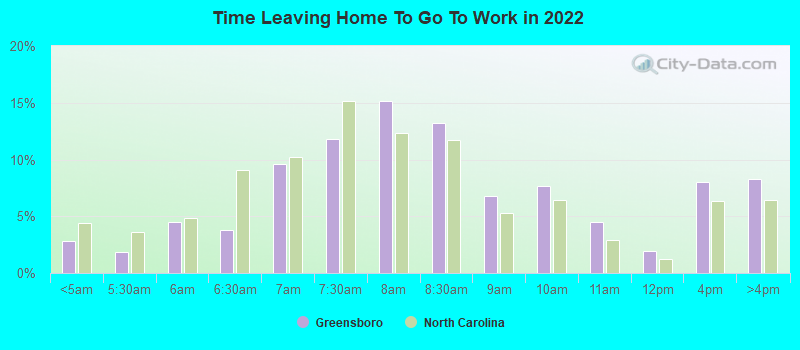
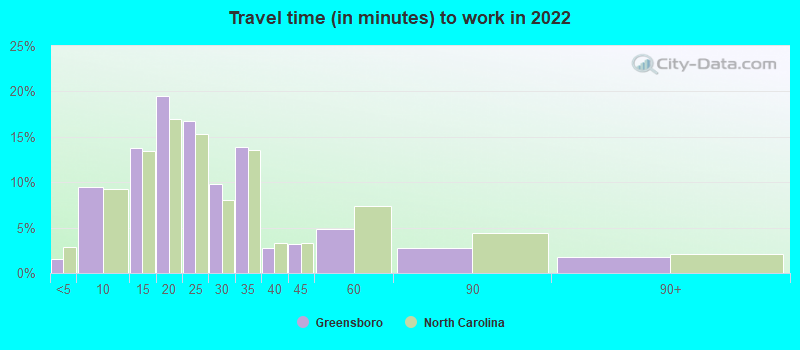
Travel time to work (commute)
Less than 5 minutes: 3,1735 to 9 minutes: 15,65510 to 14 minutes: 23,77815 to 19 minutes: 30,64620 to 24 minutes: 17,90225 to 29 minutes: 8,07530 to 34 minutes: 13,04235 to 39 minutes: 2,48040 to 44 minutes: 1,19745 to 59 minutes: 6,17460 to 89 minutes: 2,00090 or more minutes: 2,072
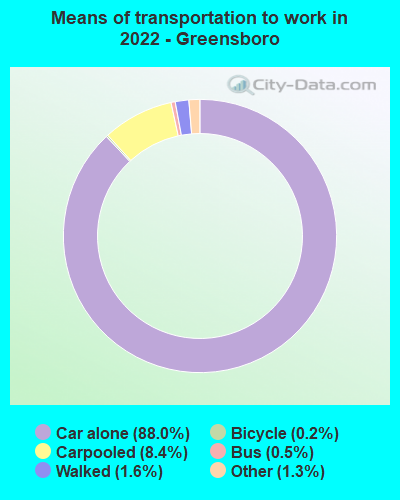
Means of transportation to work:
Drove a car alone: 159,861 (79.3%)Carpooled: 15,211 (7.5%)Bus : 868 (0.4%)Taxi: 2,383 (1.2%)Bicycle: 381 (0.2%)Walked: 2,873 (1.4%)Worked at home: 19,986 (9.9%)
Unemployment by race in 2022
Unemployment rate for White non-Hispanic residents 2.9% Males2.9% FemalesUnemployment rate for Black residents 4.0% Males2.4% FemalesUnemployment rate for American Indian and Alaska Native residents 18.1% MalesUnemployment rate for Asian residents 4.1% Males4.3% FemalesUnemployment rate for other race residents 1.9% Males0.8% FemalesUnemployment rate for two or more race residents 14.7% Males7.4% FemalesUnemployment rate for Hispanic or Latino residents 2.5% Males1.1% Females
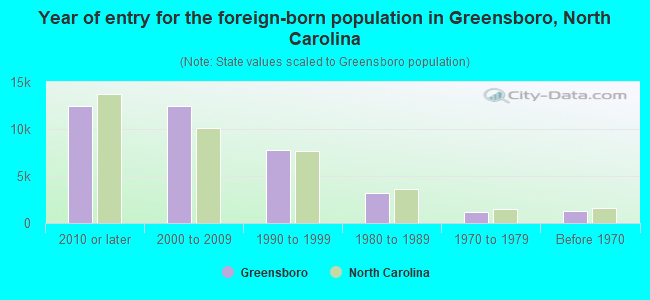
Year of entry for the foreign-born population in Greensboro, North Carolina
12,435 2010 or later 12,406 2000 to 2009 7,810 1990 to 1999 3,212 1980 to 1989 1,131 1970 to 1979 1,272 Before 1970
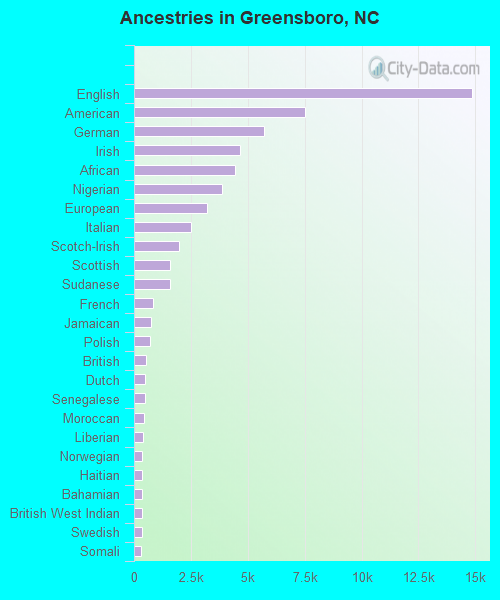
First ancestries reported:
English: 14,861 (8.2%)
American: 7,532 (4.2%)
German: 5,696 (3.1%)
Irish: 4,674 (2.6%)
African: 4,432 (2.4%)
Nigerian: 3,877 (2.1%)
European: 3,187 (1.8%)
Italian: 2,510 (1.4%)
Scotch-Irish: 1,999 (1.1%)
Scottish: 1,592 (0.9%)
Sudanese: 1,583 (0.9%)
French: 822 (0.5%)
Jamaican: 740 (0.4%)
Polish: 707 (0.4%)
British: 509 (0.3%)
Dutch: 473 (0.3%)
Senegalese: 467 (0.3%)
Moroccan: 460 (0.3%)
Liberian: 392 (0.2%)
Norwegian: 361 (0.2%)
Haitian: 350 (0.2%)
Bahamian: 347 (0.2%)
British West Indian: 340 (0.2%)
Swedish: 336 (0.2%)
Somali: 329 (0.2%)
Sierra Leonean: 284 (0.2%)
Afghan: 277 (0.2%)
Ethiopian: 273 (0.2%)
Eastern European: 254 (0.1%)
Iranian: 240 (0.1%)
Barbadian: 230 (0.1%)
Ghanaian: 227 (0.1%)
Iraqi: 221 (0.1%)
Russian: 218 (0.1%)
Greek: 216 (0.1%)
French Canadian: 214 (0.1%)
Canadian: 205 (0.1%)
Guyanese: 203 (0.1%)
Yugoslavian: 200 (0.1%)
Northern European: 191 (0.1%)
Bulgarian: 178 (0.10%)
Danish: 169 (0.09%)
Welsh: 160 (0.09%)
Hungarian: 154 (0.09%)
Zimbabwean: 135 (0.07%)
Arab: 128 (0.07%)
Ukrainian: 122 (0.07%)
West Indian: 120 (0.07%)
Lithuanian: 101 (0.06%)
Austrian: 87 (0.05%)
Brazilian: 85 (0.05%)
Armenian: 84 (0.05%)
Scandinavian: 79 (0.04%)
Swiss: 75 (0.04%)
Trinidadian and Tobagonian: 74 (0.04%)
Egyptian: 71 (0.04%)
Romanian: 70 (0.04%)
Turkish: 67 (0.04%)
Czech: 63 (0.03%)
Kenyan: 59 (0.03%)
Israeli: 58 (0.03%)
Lebanese: 56 (0.03%)
Belgian: 48 (0.03%)
Slovak: 45 (0.02%)
Serbian: 41 (0.02%)
Jordanian: 40 (0.02%)
Slavic: 38 (0.02%)
New Zealander: 38 (0.02%)
Palestinian: 36 (0.02%)
Slovene: 34 (0.02%)
South African: 33 (0.02%)
Syrian: 32 (0.02%)
Maltese: 26 (0.01%)
Pennsylvania German: 25 (0.01%)
Finnish: 24 (0.01%)
Estonian: 20 (0.01%)
Croatian: 14 (0.01%)
Portuguese: 12 (0.01%)
Most common places of birth for foreign-born residents (%): Mexico Greensboro:
13.1% (5,066)North Carolina:
24.7% (214,776)
Vietnam Greensboro:
10.8% (4,161)North Carolina:
2.9% (24,965)
India Greensboro:
8.7% (3,365)North Carolina:
9.3% (80,594)
Nigeria Greensboro:
5.4% (2,081)North Carolina:
1.1% (9,173)
Sudan Greensboro:
3.4% (1,310)North Carolina:
0.3% (2,638)
Other Western Africa Greensboro:
2.7% (1,062)North Carolina:
0.3% (2,644)
Africa, n.e.c. Greensboro:
2.4% (928)North Carolina:
0.5% (4,032)
Philippines Greensboro:
2.3% (904)North Carolina:
2.4% (20,695)
China, excluding Hong Kong and Taiwan Greensboro:
2.3% (890)North Carolina:
3.2% (27,477)
Canada Greensboro:
2.1% (807)North Carolina:
2.1% (18,105)
Honduras Greensboro:
1.9% (737)North Carolina:
4.7% (40,707)
Democratic Republic of Congo (Zaire) Greensboro:
1.8% (703)North Carolina:
0.5% (4,046)
England Greensboro:
1.7% (639)North Carolina:
1.2% (10,140)
Brazil Greensboro:
1.6% (627)North Carolina:
1.0% (8,426)
Place of birth for U.S.-born residents:
This state: 158,719Other state: 101,464Northeast: 32,333Midwest: 13,919South: 46,051West: 9,161 83.0% of Greensboro residents lived in the same house 1 years ago.
Out of people who lived in different houses, 34.1% lived in this county.
Out of people who lived in different counties, 63.5% lived in North Carolina.
Greensboro:
83.0%State average:
87.3%
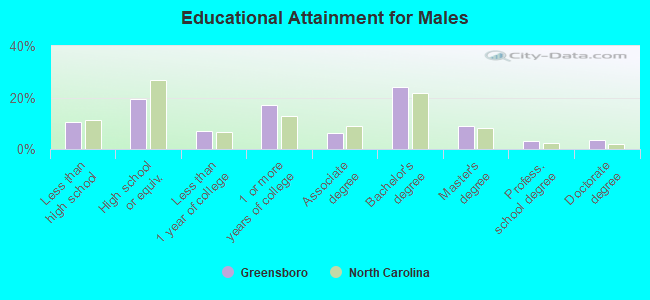
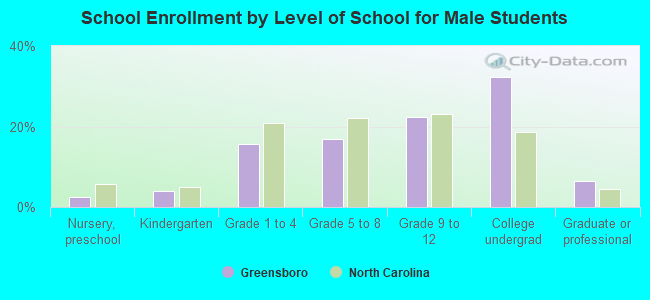
Education attainment for males 25 years and older:
No schooling: 2,433Nursery to 4th grade: 8145th and 6th grade: 2667th and 8th grade: 9829th grade: 1,12410th grade: 1,18111th grade: 74712th grade, no diploma: 1,435High school graduate (or equivalency): 16,894Less than 1 year of college: 6,201Some college more than 1 year, no degree: 14,897Associate degree: 5,285Bachelor's degree: 21,055Master's degree: 7,888Professional school degree: 2,649Doctorate degree: 2,963
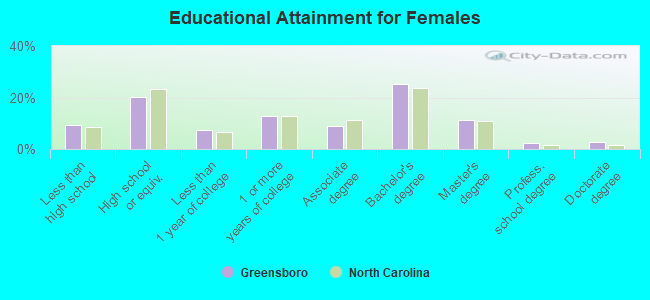
Education attainment for females 25 years and older:
No schooling: 2,258Nursery to 4th grade: 5245th and 6th grade: 2307th and 8th grade: 4569th grade: 15410th grade: 2,58411th grade: 1,93712th grade, no diploma: 1,641High school graduate (or equivalency): 21,146Less than 1 year of college: 7,897Some college more than 1 year, no degree: 13,253Associate degree: 9,185Bachelor's degree: 26,526Master's degree: 11,994Professional school degree: 2,446Doctorate degree: 2,686
Housing units in structures:
One, detached: 68,628One, attached: 8,451Two: 2,8843 or 4: 9,5865 to 9: 14,60810 to 19: 12,24320 to 49: 10,17850 or more: 5,087Mobile homes: 1,460Median worth of mobile homes: $151,200
Housing units lacking complete plumbing facilities in 2022: 0.7%Housing units lacking complete kitchen facilities in 2022: 1.5%House/condo owner moved in on average 12 years ago
Renter moved in on average 2 years ago
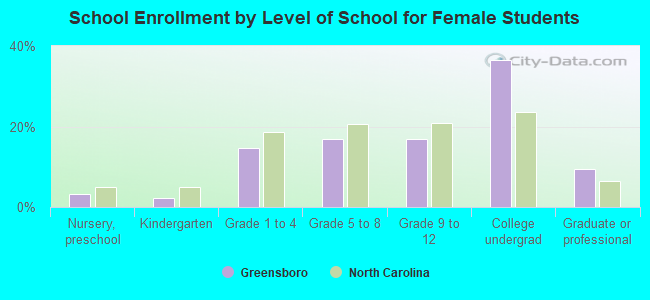
Private vs. public school enrollment:
Students in private schools in grades 1 to 8 (elementary and middle school): 4,406 Here:
14.6%North Carolina:
13.8%
Students in private schools in grades 9 to 12 (high school): 1,530 Here:
8.4%North Carolina:
11.9%
Students in private undergraduate colleges: 5,552 Here:
17.0%North Carolina:
19.3%