Greenback, TN (Tennessee) Houses and Residents
| Greenback: | $282,837 |
| Tennessee: | $284,800 |
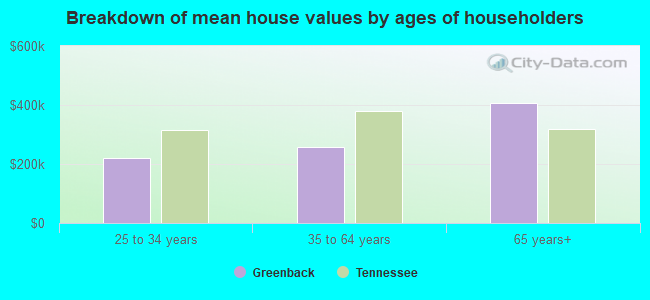
Mean price in 2022:
Detached houses: $388,627
Here: $388,627 State: $374,382 Mobile homes: $155,823
Here: $155,823 State: $101,421
Total population: 1,103 (Urban population: 0, Rural population: 973 (18 farm, 955 nonfarm))
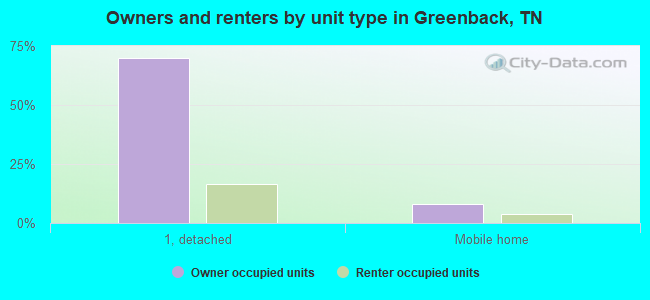
Houses: 506 (428 occupied: 341 owner occupied, 94 renter occupied)
| % of renters here: | 22% |
| State: | 33% |
Housing density: 71 houses/condos per square mile
Median price asked for vacant for-sale houses and condos in 2022: $282,023.
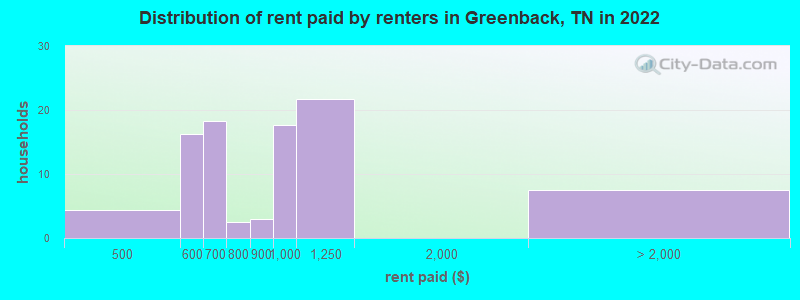
Median contract rent in 2022: $770 (lower quartile is $620, upper quartile is $1,064)
Median rent asked for vacant for-rent units in 2022: $759
Median gross rent in Greenback, TN in 2022: $1,147
Housing units in Greenback with a mortgage: 203 (6 second mortgage, 0 home equity loan, 3 both second mortgage and home equity loan)
Houses without a mortgage: 0
Median household income for houses/condos with a mortgage: $102,139
Median monthly housing costs: $1,071
Compare current foreclosures near Greenback, TN:
| Photo | Address | Area | Beds / Baths | Price | Details |
|---|---|---|---|---|---|

|
#1
Old Niles Ferry Pike
Greenback, TN 37742
|
1,689 sq. feet
|
2 baths 3 beds |
show details | |

|
#2
E Coast Tellico Pkwy
Greenback, TN 37742
|
2,816 sq. feet
|
2 baths - beds |
show details | |

|
#3
Buford Ct
Greenback, TN 37742
|
1,540 sq. feet
|
2 baths - beds |
show details | |

|
#4
Cloyds Church Rd
Greenback, TN 37742
|
1,968 sq. feet
|
2 baths - beds |
show details | |

|
#5
Deer Cv
Greenback, TN 37742
|
- sq. feet
|
- baths - beds |
show details | |

|
#6
N Trigonia Rd
Greenback, TN 37742
|
- sq. feet
|
- baths - beds |
show details | |

|
#7
Tennessee Ave
Greenback, TN 37742
|
- sq. feet
|
- baths - beds |
show details | |

|
#8
Gregory Rd
Greenback, TN 37742
|
2,052 sq. feet
|
- baths - beds |
show details | |

|
#9
Elm St
Greenback, TN 37742
|
1,248 sq. feet
|
- baths - beds |
show details | |

|
#10
Maple Ln Lot 20
Greenback, TN 37742
|
- sq. feet
|
- baths - beds |
show details |
| Photo | Address | Area | Beds / Baths | Price | Details |
|---|---|---|---|---|---|

|
#11
Prairie Pl
Greenback, TN 37742
|
- sq. feet
|
- baths - beds |
show details | |

|
#12
Chilhowee Ave
Greenback, TN 37742
|
- sq. feet
|
- baths - beds |
show details | |

|
#13
Deer Cv
Greenback, TN 37742
|
- sq. feet
|
- baths - beds |
show details | |

|
#14
Eagle Glen Dr
Knoxville, TN 37922
|
3,664 sq. feet
|
3 baths 4 beds |
show details | |

|
#15
Willow View Ln
Knoxville, TN 37922
|
1,742 sq. feet
|
3 baths 4 beds |
show details | |

|
#16
Calderwood Hwy
Maryville, TN 37801
|
1,271 sq. feet
|
2 baths 2 beds |
show details | |

|
#17
Crowder Rd
Madisonville, TN 37354
|
2,400 sq. feet
|
2 baths 4 beds |
show details | |

|
#18
College St N
Madisonville, TN 37354
|
2,992 sq. feet
|
2 baths 4 beds |
show details | |

|
#19
W Fulton St
Alcoa, TN 37701
|
625 sq. feet
|
1 baths 2 beds |
show details | |

|
#20
Grenada Blvd
Knoxville, TN 37922
|
2,508 sq. feet
|
2 baths 3 beds |
show details |
| Photo | Address | Area | Beds / Baths | Price | Details |
|---|---|---|---|---|---|

|
#21
Arthur Ave
Maryville, TN 37804
|
836 sq. feet
|
1 baths 3 beds |
show details | |

|
#22
Old Tellico Hwy N
Madisonville, TN 37354
|
2,024 sq. feet
|
2 baths 3 beds |
show details | |

|
#23
Sedgewick Dr
Knoxville, TN 37922
|
2,004 sq. feet
|
2 baths 3 beds |
show details | |

|
#24
Meriwether Ln
Knoxville, TN 37934
|
2,688 sq. feet
|
3 baths 5 beds |
show details | |

|
#25
Melford Ln
Knoxville, TN 37934
|
2,766 sq. feet
|
2 baths 3 beds |
show details | |

|
#26
Butternut Ln
Knoxville, TN 37934
|
2,640 sq. feet
|
2 baths 3 beds |
show details | |

|
#27
Grenada Blvd
Knoxville, TN 37922
|
2,086 sq. feet
|
2 baths 3 beds |
show details | |

|
#28
Glen Iris Ln
Knoxville, TN 37934
|
3,249 sq. feet
|
3 baths 4 beds |
show details | |

|
#29
Harts View Dr
Knoxville, TN 37922
|
1,092 sq. feet
|
2 baths 3 beds |
show details | |

|
#30
Banbury Rd
Knoxville, TN 37934
|
1,456 sq. feet
|
2 baths 3 beds |
show details |
| Photo | Address | Area | Beds / Baths | Price | Details |
|---|---|---|---|---|---|

|
#31
Shoreham Blvd
Knoxville, TN 37922
|
1,512 sq. feet
|
2 baths 3 beds |
show details | |

|
#32
Poplar Glen Dr
Knoxville, TN 37922
|
3,957 sq. feet
|
5 baths 4 beds |
show details | |

|
#33
Brampton Rd
Knoxville, TN 37934
|
1,144 sq. feet
|
1 baths 3 beds |
show details | |

|
#34
Willowood Rd
Knoxville, TN 37922
|
3,244 sq. feet
|
3 baths 4 beds |
show details | |

|
#35
Glenlock Rd
Sweetwater, TN 37874
|
1,144 sq. feet
|
3 baths - beds |
show details | |

|
#36
Sevierville Rd
Maryville, TN 37804
|
2,286 sq. feet
|
2 baths - beds |
show details | |

|
#37
Promontory Pt
Louisville, TN 37777
|
4,183 sq. feet
|
4 baths - beds |
show details | |

|
#38
Woodlawn Ave
Maryville, TN 37804
|
1,912 sq. feet
|
1 baths - beds |
show details | |

|
#39
Forkners Chapel Rd
Sweetwater, TN 37874
|
1,248 sq. feet
|
2 baths - beds |
show details | |

|
#40
Foxglove Ln
Maryville, TN 37801
|
1,878 sq. feet
|
2 baths - beds |
show details |
| Photo | Address | Area | Beds / Baths | Price | Details |
|---|---|---|---|---|---|

|
#41
Mcginley St
Maryville, TN 37804
|
728 sq. feet
|
1 baths - beds |
show details | |

|
#42
W Old Topside Rd
Louisville, TN 37777
|
816 sq. feet
|
1 baths - beds |
show details | |

|
#43
Dogwood Dr
Madisonville, TN 37354
|
1,912 sq. feet
|
1 baths - beds |
show details | |

|
#44
Irwin Ave
Maryville, TN 37804
|
2,220 sq. feet
|
1 baths - beds |
show details | |

|
#45
Jefferson Ave
Maryville, TN 37804
|
1,287 sq. feet
|
1 baths - beds |
show details | |

|
#46
Oak Grove Rd
Madisonville, TN 37354
|
1,200 sq. feet
|
1 baths - beds |
show details | |

|
#47
Martin St
Maryville, TN 37804
|
1,286 sq. feet
|
1 baths - beds |
show details | |

|
#48
Garfield St
Alcoa, TN 37701
|
2,132 sq. feet
|
1 baths - beds |
show details | |

|
#49
Gigi Ln
Loudon, TN 37774
|
1,534 sq. feet
|
2 baths - beds |
show details | |

|
Check over 1 million property listings on Foreclosure.com!
|
browse all offers | |||

Latest news about housing in Greenback, TN collected exclusively by city-data.com from local newspapers, TV, and radio stations

 | Igor Blevin's, "A Native Californian in Knoxville" (220 replies) |
| Tellico Village Master Thread (573 replies) |
| East TN, First Retirement Research Trip (13 replies) |
| eastern part of the state (5 replies) |
| Finally Made it To Maryville, First Impressions (66 replies) |
| Abandoned homes (9 replies) |

Median year apartment built: 1962
Household type by relationship:
Households: 1,499- Male householders: 238 (47 living alone), Female householders: 185 (22 living alone)
232 spouses (232 opposite-sex spouses), 54 unmarried partners, (54 opposite-sex unmarried partners), 566 children (512 natural, 42 adopted, 11 stepchildren), 130 grandchildren, 11 brothers or sisters, 17 parents, 0 foster children, 43 other relatives, 19 non-relatives
Size of family households: 100 2-persons, 81 3-persons, 89 4-persons, 18 5-persons, 52 7-or-more-persons.
Size of nonfamily households: 71 1-person, 23 2-persons, 3 3-persons.
170 married couples with children.
105 single-parent households (0 men, 105 women).
98.8% of residents of Greenback speak English at home.
0.2% of residents speak other Indo-European language at home (100% speak English very well).
0.4% of residents speak Asian or Pacific Island language at home (100% speak English very well).
Foreign born population: 11 (0.7%)
(27.3% of them are naturalized citizens)
| Here: | 6.5 |
| State: | 6.5 |
| Here: | 6.1 |
| State: | 4.4 |
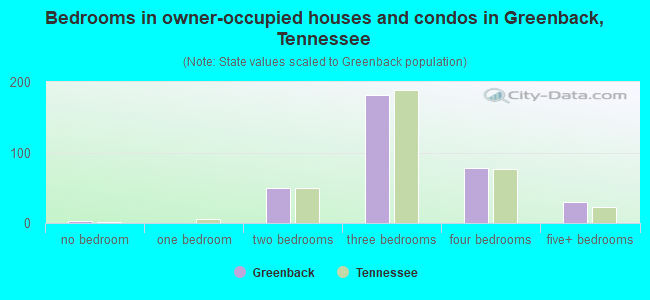
- Bedrooms in owner-occupied houses and condos in Greenback, Tennessee
- 3no bedroom
- 01 bedroom
- 492 bedrooms
- 1813 bedrooms
- 784 bedrooms
- 305+ bedrooms
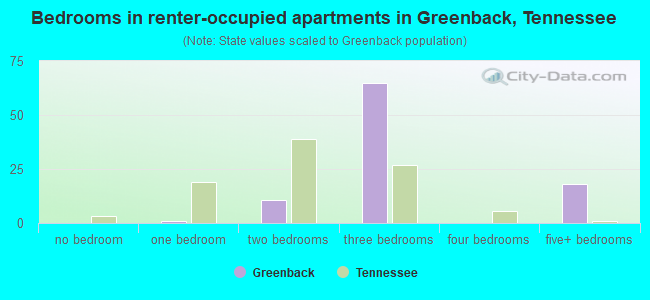
- Bedrooms in renter-occupied apartments in Greenback, Tennessee
- 0no bedroom
- 11 bedroom
- 102 bedrooms
- 653 bedrooms
- 04 bedrooms
- 185+ bedrooms
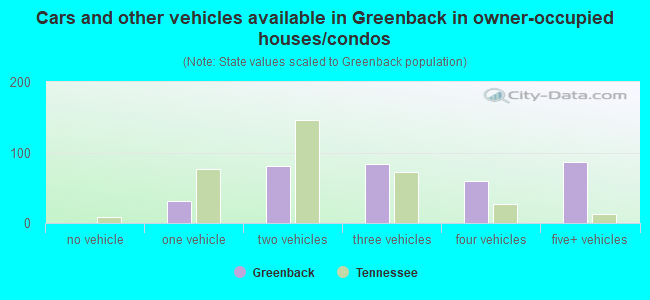
- Cars and other vehicles available in Greenback in owner-occupied houses/condos
- 0no vehicle
- 311 vehicle
- 812 vehicles
- 843 vehicles
- 594 vehicles
- 875+ vehicles
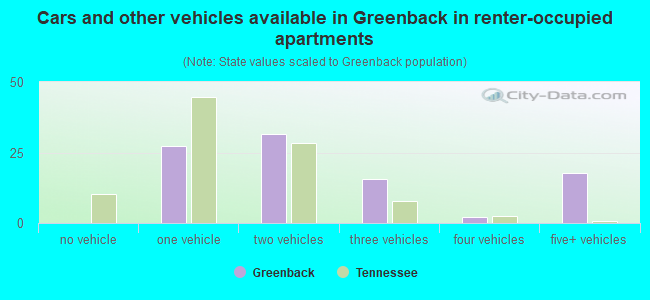
- Cars and other vehicles available in Greenback in renter-occupied apartments
- 0no vehicle
- 271 vehicle
- 312 vehicles
- 163 vehicles
- 24 vehicles
- 185+ vehicles
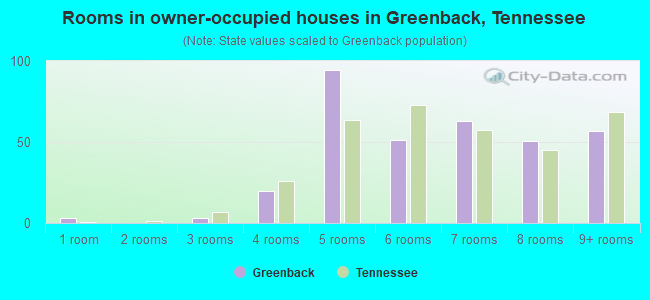
- Rooms in owner-occupied houses in Greenback, Tennessee
- 31 room
- 02 rooms
- 33 rooms
- 204 rooms
- 945 rooms
- 516 rooms
- 637 rooms
- 508 rooms
- 579+ rooms
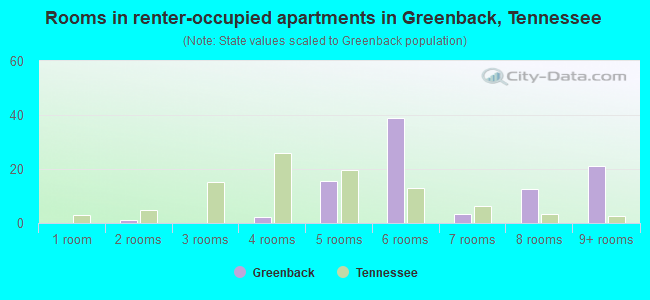
- Rooms in renter-occupied apartments in Greenback, Tennessee
- 01 room
- 12 rooms
- 03 rooms
- 24 rooms
- 165 rooms
- 396 rooms
- 37 rooms
- 138 rooms
- 219+ rooms

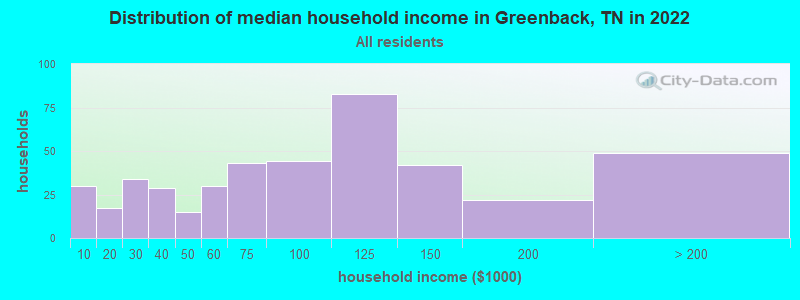
Greenback, TN household income distribution

- 30Less than $10,000
- 17$10,000 to $19,999
- 34$20,000 to $29,999
- 29$30,000 to $39,999
- 15$40,000 to $49,999
- 30$50,000 to $59,999
- 43$60,000 to $74,999
- 44$75,000 to $99,999
- 83$100,000 to $124,999
- 42$125,000 to $149,999
- 22$150,000 to $199,999
- 49$200,000 or more
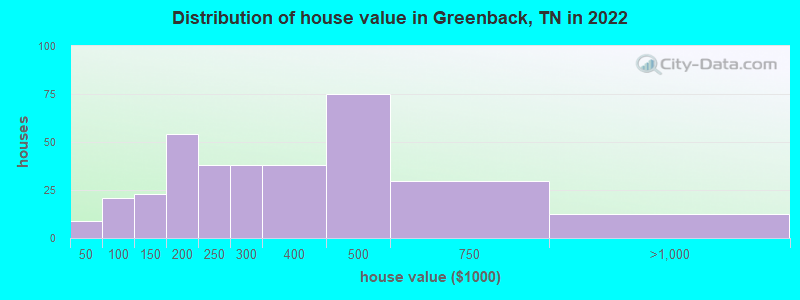
Home value of owner - occupied houses in 2022 in Greenback, TN
-
- 4Less than $10,000
- 4$10,000 to $14,999
- 17$50,000 to $59,999
- 3$80,000 to $89,999
- 4$100,000 to $124,999
- 18$125,000 to $149,999
- 32$150,000 to $174,999
- 21$175,000 to $199,999
- 37$200,000 to $249,999
- 38$250,000 to $299,999
- 37$300,000 to $399,999
- 74$400,000 to $499,999
- 29$500,000 to $749,999
- 12$750,000 to $999,999
Rent paid by renters in 2022 in Greenback, TN
-
- 4$450 to $499
- 14$500 to $549
- 1$550 to $599
- 1$600 to $649
- 17$650 to $699
- 2$700 to $749
- 3$800 to $899
- 17$900 to $999
- 21$1,000 to $1,249
- 7No cash rent
Percentage of workers working in this county: 18.9%
Number of people working at home: 84 (12.4% of all workers)
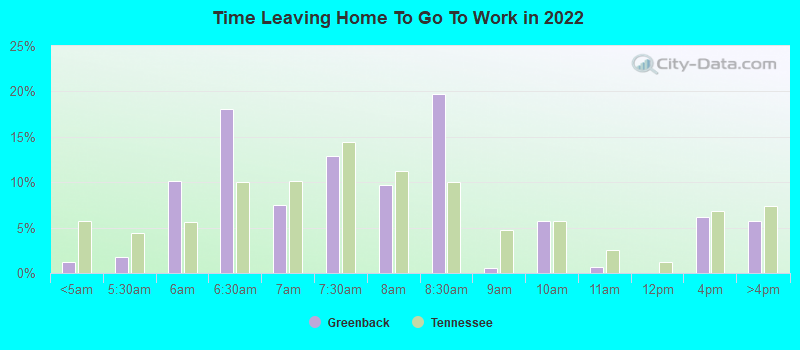
Travel time to work (commute)
- Less than 5 minutes: 3
- 5 to 9 minutes: 31
- 10 to 14 minutes: 28
- 15 to 19 minutes: 85
- 20 to 24 minutes: 63
- 25 to 29 minutes: 48
- 30 to 34 minutes: 41
- 35 to 39 minutes: 10
- 40 to 44 minutes: 84
- 45 to 59 minutes: 128
- 60 to 89 minutes: 56
- 90 or more minutes: 0
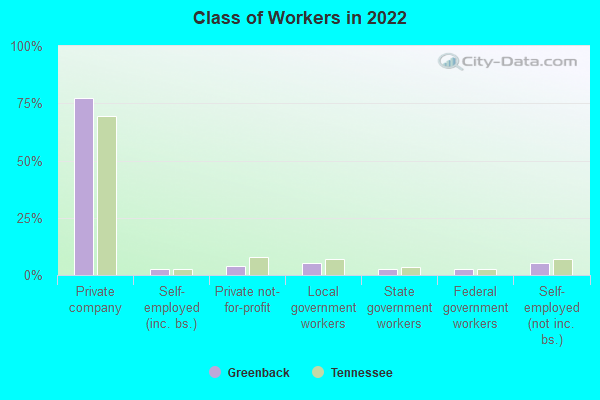
Means of transportation to work:
- Drove a car alone: 326 (82.3%)
- Carpooled: 49 (12.4%)
- Walked: 5 (1.3%)
- Other means: 11 (2.8%)
- Worked at home: 5 (1.3%)
- Unemployment by race in 2022
- Unemployment rate for White non-Hispanic residents
- 1.2%Males
- 1.5%Females
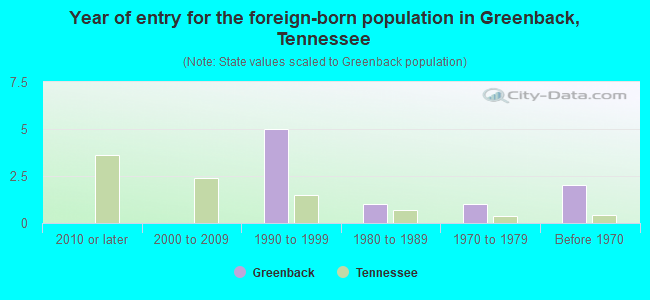
- Year of entry for the foreign-born population in Greenback, Tennessee
- 02010 or later
- 02000 to 2009
- 51990 to 1999
- 11980 to 1989
- 11970 to 1979
- 2Before 1970
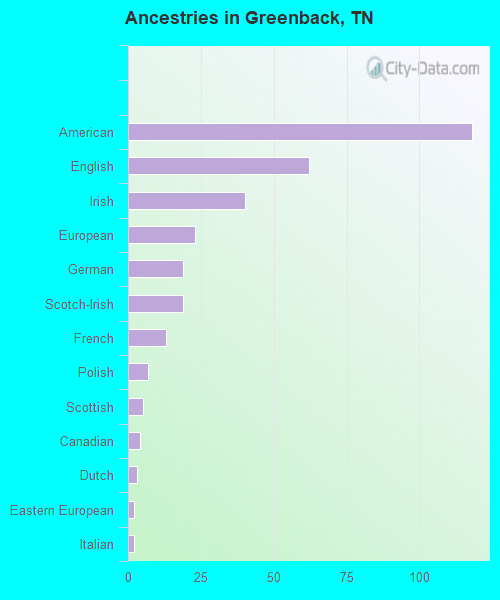
First ancestries reported:
- American: 118 (32.2%)
- English: 62 (16.9%)
- Irish: 40 (10.9%)
- European: 23 (6.3%)
- German: 19 (5.2%)
- Scotch-Irish: 19 (5.2%)
- French: 13 (3.6%)
- Polish: 7 (1.9%)
- Scottish: 5 (1.4%)
- Canadian: 4 (1.1%)
- Dutch: 3 (0.8%)
- Eastern European: 2 (0.5%)
- Italian: 2 (0.5%)
Most common places of birth for foreign-born residents (%):
| Greenback: | 27.3% (3) |
| Tennessee: | 0.9% (3,225) |
| Greenback: | 27.3% (3) |
| Tennessee: | 2.2% (8,261) |
| Greenback: | 27.3% (3) |
| Tennessee: | 1.2% (4,587) |
Place of birth for U.S.-born residents:
- This state: 1,016
- Other state: 463
- Northeast: 43
- Midwest: 132
- South: 225
- West: 62
98.5% of Greenback residents lived in the same house 1 years ago.
Out of people who lived in different houses, 8.3% lived in this county.
Out of people who lived in different counties, 77.4% lived in Tennessee.
| Greenback: | 98.5% |
| State average: | 87.0% |
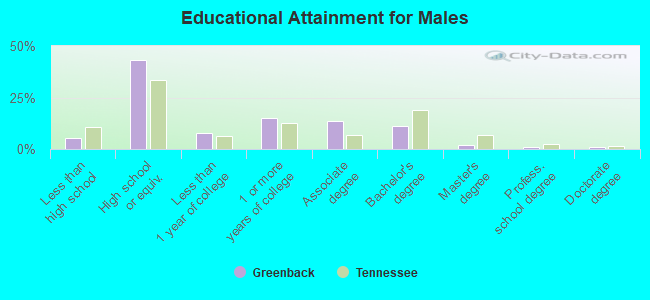
Education attainment for males 25 years and older:
- No schooling: 0
- Nursery to 4th grade: 0
- 5th and 6th grade: 0
- 7th and 8th grade: 3
- 9th grade: 5
- 10th grade: 0
- 11th grade: 2
- 12th grade, no diploma: 11
- High school graduate (or equivalency): 173
- Less than 1 year of college: 31
- Some college more than 1 year, no degree: 61
- Associate degree: 55
- Bachelor's degree: 44
- Master's degree: 8
- Professional school degree: 3
- Doctorate degree: 3
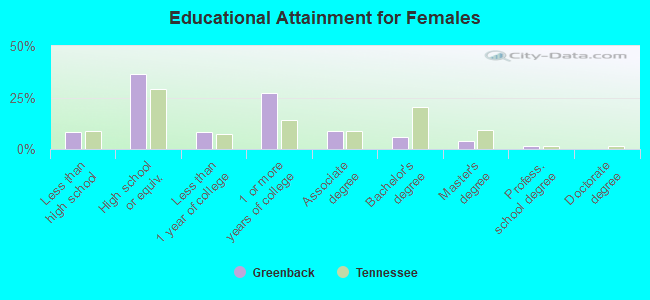
Education attainment for females 25 years and older:
- No schooling: 0
- Nursery to 4th grade: 0
- 5th and 6th grade: 0
- 7th and 8th grade: 3
- 9th grade: 1
- 10th grade: 14
- 11th grade: 2
- 12th grade, no diploma: 21
- High school graduate (or equivalency): 176
- Less than 1 year of college: 39
- Some college more than 1 year, no degree: 133
- Associate degree: 42
- Bachelor's degree: 29
- Master's degree: 20
- Professional school degree: 6
- Doctorate degree: 0


Housing units in structures:
- One, detached: 407
- One, attached: 11
- Mobile homes: 87
Housing units lacking complete kitchen facilities in 2022: 3.3%
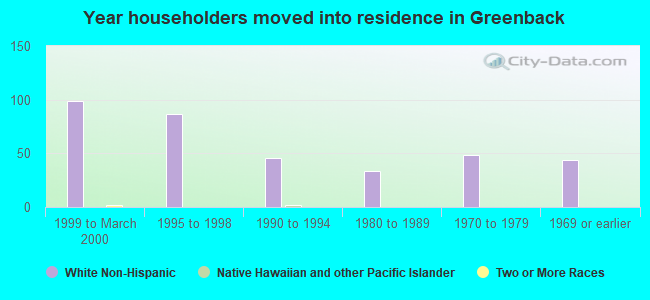
House/condo owner moved in on average 9 years ago
Renter moved in on average 3 years ago
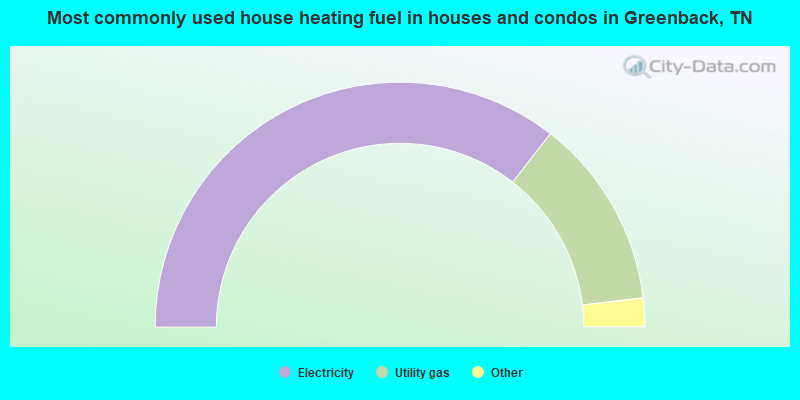
- 71.2%Electricity
- 25.2%Utility gas
- 2.1%Wood
- 1.5%Other fuel
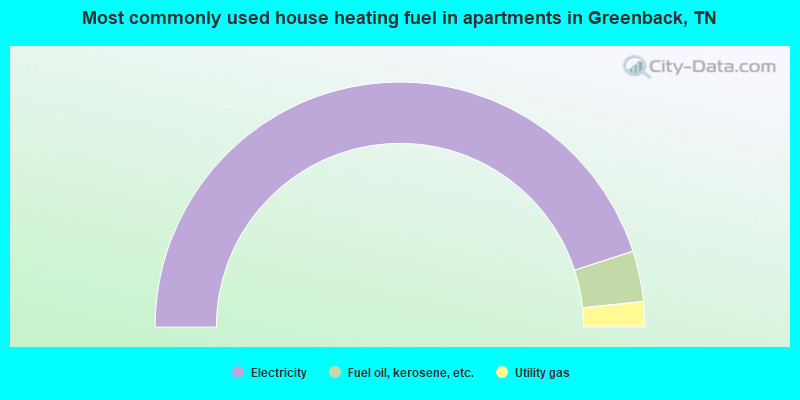
- 90.0%Electricity
- 6.7%Fuel oil, kerosene, etc.
- 3.3%Utility gas
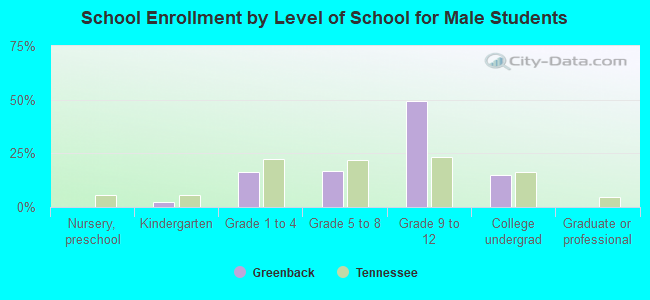
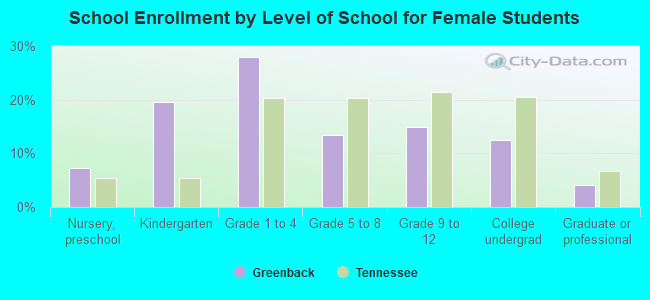
Private vs. public school enrollment:
| Here: | 11.9% |
| Tennessee: | 15.0% |
| Here: | 44.8% |
| Tennessee: | 16.2% |
| Here: | 34.0% |
| Tennessee: | 23.5% |