Grays-Tillman, SC (South Carolina) Houses and Residents
| Grays-Tillman: | $232,594 |
| South Carolina: | $254,600 |
Total population: 5,628 (Urban population: 0, Rural population: 5,247 (52 farm, 5,195 nonfarm))
Houses: 2,294 (1,959 occupied: 1,660 owner occupied, 299 renter occupied)
| % of renters here: | 15% |
| State: | 28% |
Housing density: 9 houses/condos per square mile
Median price asked for vacant for-sale houses and condos in 2022 in this county: $88,938.
Median contract rent in 2022: $794 (lower quartile is $526, upper quartile is $1,048)
Median rent asked for vacant for-rent units in 2022: $1,386
Median gross rent in Grays-Tillman, SC in 2022: $995
Housing units in Grays-Tillman with a mortgage: 400 (6 second mortgage, 67 home equity loan, 0 both second mortgage and home equity loan)
Houses without a mortgage: 404


Household type by relationship:
Households: 23,289- In family households: 20,091 (3,491 male householders, 2,453 female householders)
3,768 spouses, 6,909 children (6,343 natural, 163 adopted, 403 stepchildren), 1,063 grandchildren, 403 brothers or sisters, 261 parents, foster children, 706 other relatives, 900 non-relatives
- In nonfamily households: 3,198 (1,270 male householders (1,005 living alone)), 1,303 female householders (1,110 living alone)), 625 nonrelatives
- In group quarters: 1,488 (1,452 institutionalized population)
2,838 married couples with children.
1,620 single-parent households (310 men, 1,310 women).
98.4% of residents of Grays-Tillman speak English at home.
0.8% of residents speak Spanish at home (77% speak English very well, 23% speak English not well).
0.8% of residents speak other Indo-European language at home (61% speak English very well, 39% speak English well).
Foreign born population: 60 (1.1%)
(128.3% of them are naturalized citizens)
| Here: | 6.2 |
| State: | 6.4 |
| Here: | 6.1 |
| State: | 4.5 |

- Bedrooms in owner-occupied houses and condos in Grays-Tillman, South Carolina
- 16no bedroom
- 801 bedroom
- 3162 bedrooms
- 9833 bedrooms
- 2044 bedrooms
- 615+ bedrooms

- Bedrooms in renter-occupied apartments in Grays-Tillman, South Carolina
- 7no bedroom
- 171 bedroom
- 1102 bedrooms
- 1453 bedrooms
- 204 bedrooms
- 05+ bedrooms

- Cars and other vehicles available in Grays-Tillman in owner-occupied houses/condos
- 132no vehicle
- 6351 vehicle
- 6242 vehicles
- 2013 vehicles
- 604 vehicles
- 85+ vehicles

- Cars and other vehicles available in Grays-Tillman in renter-occupied apartments
- 54no vehicle
- 1041 vehicle
- 922 vehicles
- 493 vehicles
- 04 vehicles
- 05+ vehicles

- Rooms in owner-occupied houses in Grays-Tillman, South Carolina
- 161 room
- 72 rooms
- 923 rooms
- 2294 rooms
- 5025 rooms
- 3326 rooms
- 2417 rooms
- 928 rooms
- 1499+ rooms

- Rooms in renter-occupied apartments in Grays-Tillman, South Carolina
- 71 room
- 102 rooms
- 273 rooms
- 684 rooms
- 575 rooms
- 816 rooms
- 337 rooms
- 168 rooms
- 09+ rooms


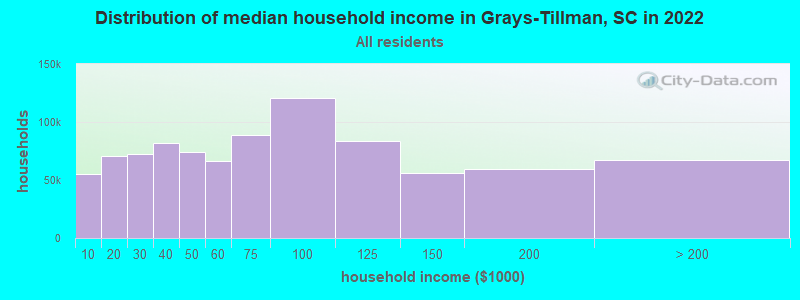
Grays-Tillman, SC household income distribution

- 38,175Less than $10,000
- 58,396$10,000 to $19,999
- 51,083$20,000 to $29,999
- 56,721$30,000 to $39,999
- 52,356$40,000 to $49,999
- 40,892$50,000 to $59,999
- 54,527$60,000 to $74,999
- 72,271$75,000 to $99,999
- 50,997$100,000 to $124,999
- 31,948$125,000 to $149,999
- 31,781$150,000 to $199,999
- 31,332$200,000 or more
Percentage of workers working in this county: 46.9%
Number of people working at home: 161 (7.4% of all workers)
Travel time to work (commute)
- Less than 5 minutes: 29
- 5 to 9 minutes: 131
- 10 to 14 minutes: 166
- 15 to 19 minutes: 222
- 20 to 24 minutes: 210
- 25 to 29 minutes: 93
- 30 to 34 minutes: 293
- 35 to 39 minutes: 42
- 40 to 44 minutes: 69
- 45 to 59 minutes: 290
- 60 to 89 minutes: 409
- 90 or more minutes: 164
Means of transportation to work:
- Drove a car alone: 1,500 (70.1%)
- Carpooled: 503 (23.5%)
- Bus or trolley bus: 29 (1.4%)
- Walked: 38 (1.8%)
- Other means: 48 (2.2%)
- Worked at home: 21 (1.0%)


- Year of entry for the foreign-born population in Grays-Tillman, South Carolina
- 01995 to March 2000
- 01990 to 1994
- 71985 to 1989
- 01980 to 1984
- 71975 to 1979
- 01970 to 1974
- 141965 to 1969
- 0Before 1965
Most common places of birth for foreign-born residents (%):
| Grays-Tillman: | 50.0% (14) |
| South Carolina: | 0.2% (279) |
| Grays-Tillman: | 25.0% (7) |
| South Carolina: | 0.6% (645) |
| Grays-Tillman: | 25.0% (7) |
| South Carolina: | 4.4% (5,108) |
Place of birth for U.S.-born residents:
- This state: 3,740
- Other state: 1,463
- Northeast: 288
- Midwest: 100
- South: 1,050
- West: 25
70% of Grays-Tillman residents lived in the same house 5 years ago.
Out of people who lived in different houses, 47% lived in this county.
Out of people who lived in different counties, 52% lived in South Carolina.
Education attainment for males 25 years and older:
- No schooling: 43
- Nursery to 4th grade: 24
- 5th and 6th grade: 40
- 7th and 8th grade: 110
- 9th grade: 53
- 10th grade: 136
- 11th grade: 128
- 12th grade, no diploma: 67
- High school graduate (or equivalency): 635
- Less than 1 year of college: 120
- Some college more than 1 year, no degree: 114
- Associate degree: 50
- Bachelor's degree: 104
- Master's degree: 5
- Professional school degree: 0
- Doctorate degree: 0

Education attainment for females 25 years and older:
- No schooling: 46
- Nursery to 4th grade: 22
- 5th and 6th grade: 19
- 7th and 8th grade: 80
- 9th grade: 111
- 10th grade: 145
- 11th grade: 62
- 12th grade, no diploma: 79
- High school graduate (or equivalency): 601
- Less than 1 year of college: 97
- Some college more than 1 year, no degree: 210
- Associate degree: 71
- Bachelor's degree: 164
- Master's degree: 70
- Professional school degree: 0
- Doctorate degree: 0


Housing units in structures:
- One, detached: 1,325
- Two: 5
- 3 or 4: 6
- 10 to 19: 7
- Mobile homes: 944
- Boats, RVs, vans, etc.: 7
Median worth of mobile homes: $57,621
Housing units lacking complete kitchen facilities: 4.6%

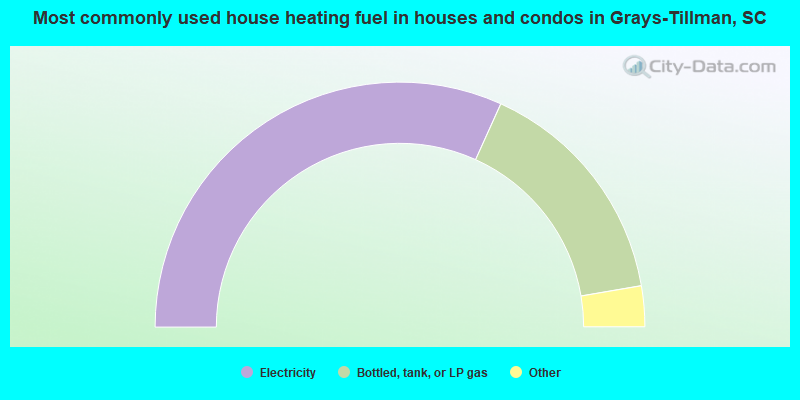
- 63.6%Electricity
- 31.1%Bottled, tank, or LP gas
- 2.4%Wood
- 1.0%No fuel used
- 0.7%Utility gas
- 0.7%Fuel oil, kerosene, etc.
- 0.5%Solar energy
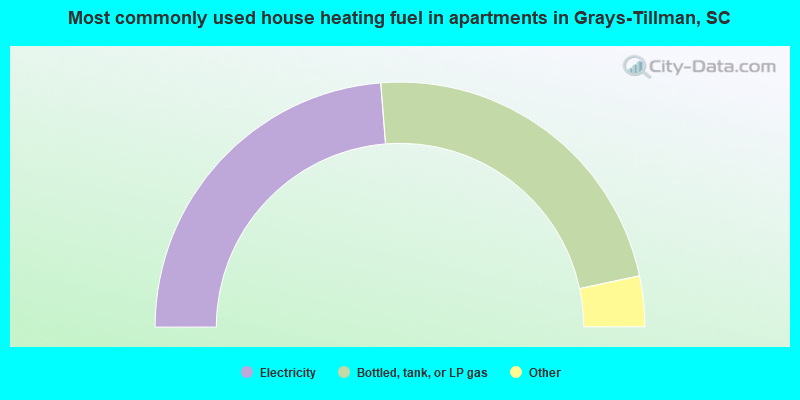
- 47.5%Electricity
- 45.8%Bottled, tank, or LP gas
- 2.3%Utility gas
- 2.3%Fuel oil, kerosene, etc.
- 2.0%Wood
Private vs. public school enrollment:
| Here: | 16.5% |
| South Carolina: | 9.2% |
| Here: | 15.6% |
| South Carolina: | 8.1% |
| Here: | 33.3% |
| South Carolina: | 20.3% |


