Grants Lick, KY (Kentucky) Houses and Residents
| Grants Lick: | $268,061 |
| Kentucky: | $196,300 |
Total population: 7,067 (Urban population: 0, Rural population: 7,177 (381 farm, 6,796 nonfarm))
Houses: 2,654 (2,529 occupied: 2,235 owner occupied, 294 renter occupied)
| % of renters here: | 12% |
| State: | 31% |
Housing density: 36 houses/condos per square mile
Median price asked for vacant for-sale houses and condos in 2022 in this county: $180,815.
Median contract rent in 2022: $750 (lower quartile is $611, upper quartile is $906)
Median rent asked for vacant for-rent units in 2022: $900
Median gross rent in Grants Lick, KY in 2022: $1,067
Housing units in Grants Lick with a mortgage: 990 (110 second mortgage, 318 home equity loan, 15 both second mortgage and home equity loan)
Houses without a mortgage: 363


Household type by relationship:
Households: 87,373- In family households: 70,785 (15,597 male householders, 7,026 female householders)
16,468 spouses, 24,973 children (23,319 natural, 547 adopted, 1,107 stepchildren), 2,191 grandchildren, 713 brothers or sisters, 571 parents, foster children, 840 other relatives, 2,030 non-relatives
- In nonfamily households: 16,588 (6,235 male householders (4,782 living alone)), 7,211 female householders (6,072 living alone)), 3,142 nonrelatives
- In group quarters: 2,963 (1,133 institutionalized population)
15,412 married couples with children.
5,398 single-parent households (1,082 men, 4,316 women).
98.1% of residents of Grants Lick speak English at home.
0.6% of residents speak Spanish at home (79% speak English very well, 21% speak English not well).
1.0% of residents speak other Indo-European language at home (100% speak English very well).
0.3% of residents speak Asian or Pacific Island language at home (100% speak English very well).
Foreign born population: 101 (1.3%)
(89.1% of them are naturalized citizens)
| Here: | 6.5 |
| State: | 6.4 |
| Here: | 5.0 |
| State: | 4.4 |

- Bedrooms in owner-occupied houses and condos in Grants Lick, Kentucky
- 0no bedroom
- 481 bedroom
- 4612 bedrooms
- 1,2043 bedrooms
- 4404 bedrooms
- 825+ bedrooms

- Bedrooms in renter-occupied apartments in Grants Lick, Kentucky
- 0no bedroom
- 581 bedroom
- 852 bedrooms
- 1223 bedrooms
- 294 bedrooms
- 05+ bedrooms

- Cars and other vehicles available in Grants Lick in owner-occupied houses/condos
- 64no vehicle
- 3891 vehicle
- 8952 vehicles
- 5863 vehicles
- 2034 vehicles
- 985+ vehicles

- Cars and other vehicles available in Grants Lick in renter-occupied apartments
- 10no vehicle
- 1021 vehicle
- 1262 vehicles
- 513 vehicles
- 04 vehicles
- 55+ vehicles

- Rooms in owner-occupied houses in Grants Lick, Kentucky
- 01 room
- 02 rooms
- 483 rooms
- 1684 rooms
- 5415 rooms
- 5496 rooms
- 4127 rooms
- 2338 rooms
- 2849+ rooms

- Rooms in renter-occupied apartments in Grants Lick, Kentucky
- 01 room
- 132 rooms
- 183 rooms
- 484 rooms
- 1375 rooms
- 426 rooms
- 247 rooms
- 108 rooms
- 29+ rooms


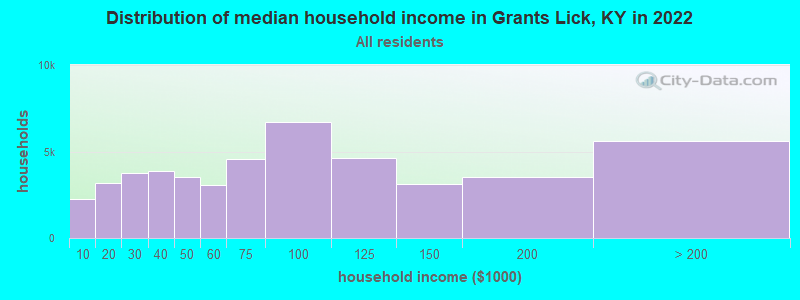
Grants Lick, KY household income distribution

- 2,284Less than $10,000
- 3,166$10,000 to $19,999
- 3,752$20,000 to $29,999
- 3,884$30,000 to $39,999
- 3,510$40,000 to $49,999
- 3,076$50,000 to $59,999
- 4,545$60,000 to $74,999
- 6,716$75,000 to $99,999
- 4,636$100,000 to $124,999
- 3,154$125,000 to $149,999
- 3,550$150,000 to $199,999
- 5,596$200,000 or more
Percentage of workers working in this county: 56.3%
Number of people working at home: 306 (8.6% of all workers)
Travel time to work (commute)
- Less than 5 minutes: 58
- 5 to 9 minutes: 69
- 10 to 14 minutes: 165
- 15 to 19 minutes: 280
- 20 to 24 minutes: 345
- 25 to 29 minutes: 191
- 30 to 34 minutes: 680
- 35 to 39 minutes: 278
- 40 to 44 minutes: 437
- 45 to 59 minutes: 582
- 60 to 89 minutes: 183
- 90 or more minutes: 62
Means of transportation to work:
- Drove a car alone: 2,906 (84.5%)
- Carpooled: 354 (10.3%)
- Bus or trolley bus: 60 (1.7%)
- Ferryboat: 2 (0.1%)
- Walked: 8 (0.2%)
- Worked at home: 108 (3.1%)


- Year of entry for the foreign-born population in Grants Lick, Kentucky
- 91995 to March 2000
- 91990 to 1994
- 01985 to 1989
- 01980 to 1984
- 01975 to 1979
- 01970 to 1974
- 01965 to 1969
- 25Before 1965
Most common places of birth for foreign-born residents (%):
| Grants Lick: | 41.9% (18) |
| Kentucky: | 6.2% (4,983) |
| Grants Lick: | 32.6% (14) |
| Kentucky: | 8.3% (6,658) |
| Grants Lick: | 20.9% (9) |
| Kentucky: | 19.3% (15,511) |
| Grants Lick: | 4.7% (2) |
| Kentucky: | 0.7% (575) |
Place of birth for U.S.-born residents:
- This state: 5,418
- Other state: 1,716
- Northeast: 84
- Midwest: 1,351
- South: 215
- West: 66
72% of Grants Lick residents lived in the same house 5 years ago.
Out of people who lived in different houses, 55% lived in this county.
Out of people who lived in different counties, 72% lived in Kentucky.
Education attainment for males 25 years and older:
- No schooling: 29
- Nursery to 4th grade: 0
- 5th and 6th grade: 28
- 7th and 8th grade: 123
- 9th grade: 99
- 10th grade: 78
- 11th grade: 57
- 12th grade, no diploma: 39
- High school graduate (or equivalency): 962
- Less than 1 year of college: 197
- Some college more than 1 year, no degree: 244
- Associate degree: 113
- Bachelor's degree: 217
- Master's degree: 70
- Professional school degree: 18
- Doctorate degree: 1

Education attainment for females 25 years and older:
- No schooling: 42
- Nursery to 4th grade: 0
- 5th and 6th grade: 12
- 7th and 8th grade: 152
- 9th grade: 114
- 10th grade: 63
- 11th grade: 39
- 12th grade, no diploma: 74
- High school graduate (or equivalency): 982
- Less than 1 year of college: 171
- Some college more than 1 year, no degree: 250
- Associate degree: 169
- Bachelor's degree: 184
- Master's degree: 56
- Professional school degree: 25
- Doctorate degree: 0


Housing units in structures:
- One, detached: 2,126
- One, attached: 9
- Two: 23
- 3 or 4: 39
- 5 to 9: 22
- 10 to 19: 61
- Mobile homes: 374
Median worth of mobile homes: $266,773
Housing units lacking complete kitchen facilities: 0.3%

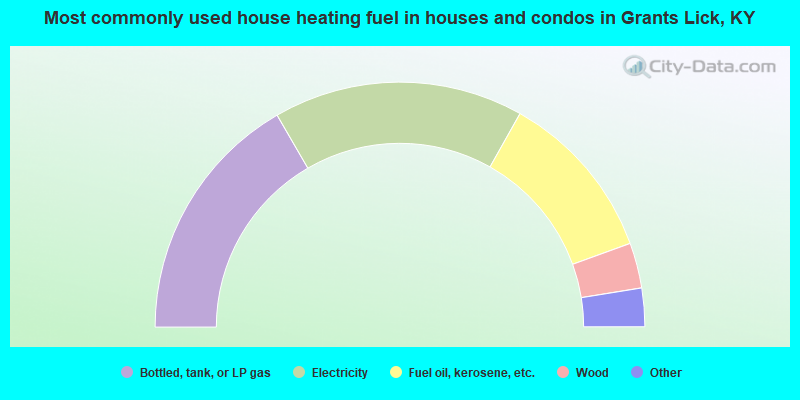
- 33.3%Bottled, tank, or LP gas
- 33.1%Electricity
- 22.6%Fuel oil, kerosene, etc.
- 6.0%Wood
- 2.6%Utility gas
- 1.2%Coal or coke
- 0.9%Other fuel
- 0.4%Solar energy
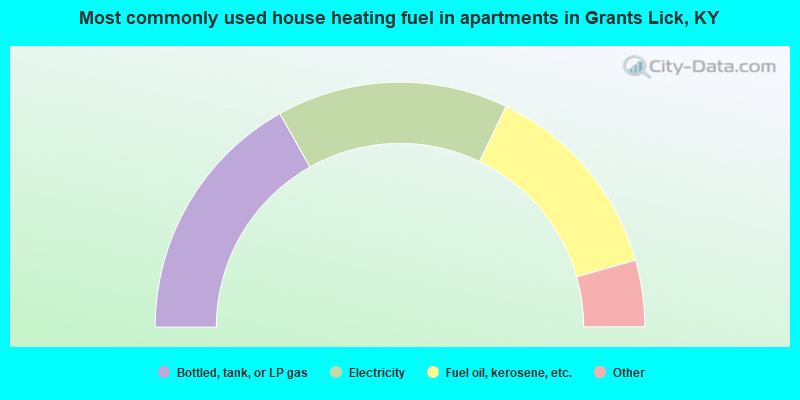
- 33.7%Bottled, tank, or LP gas
- 30.6%Electricity
- 26.9%Fuel oil, kerosene, etc.
- 3.7%Wood
- 3.4%Utility gas
- 1.7%Other fuel
Private vs. public school enrollment:
| Here: | 29.9% |
| Kentucky: | 11.9% |
| Here: | 34.0% |
| Kentucky: | 10.6% |
| Here: | 6.3% |
| Kentucky: | 18.1% |


