Graham, NC (North Carolina) Houses and Residents
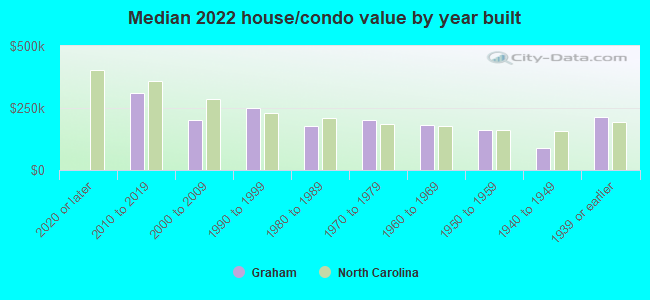
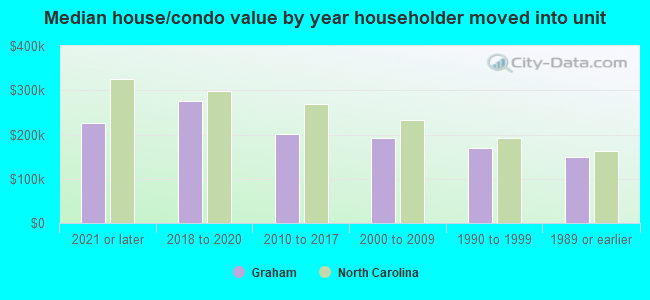
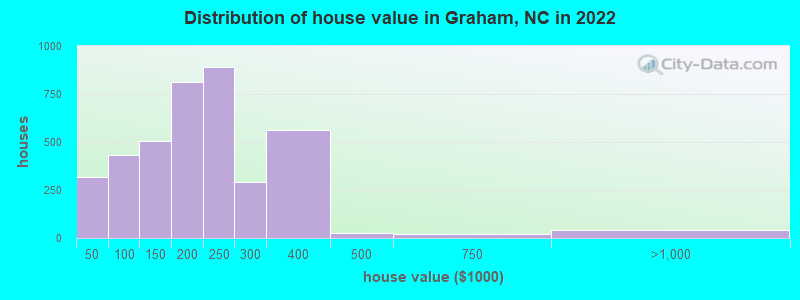
Estimated median house or condo value in 2022: $205,888 (it was $92,200 in 2000 )
Graham:
$205,888North Carolina:
$280,600
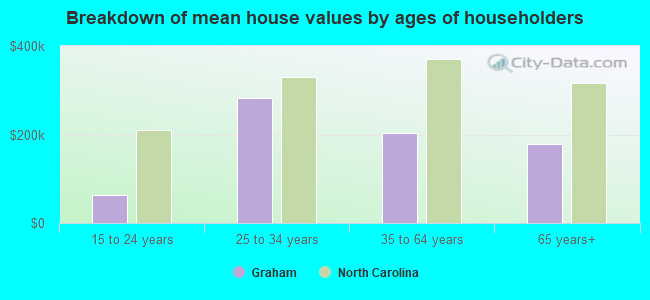
Lower value quartile - upper value quartile: $139,303 - $272,289Mean price in 2022: Detached houses: $222,633 Here:
$222,633State:
$375,326
Townhouses or other attached units: $225,559 Here:
$225,559State:
$317,935
Mobile homes: $31,143 Here:
$31,143State:
$124,933
Total population: 14,479 (Urban population: 12,635, Rural population: 48 (all nonfarm) )
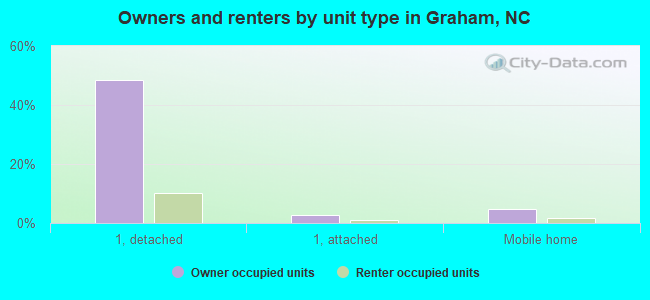
Houses: 8,662 (7,828 occupied: 4,209 owner occupied, 3,593 renter occupied )
% of renters here:
46%State:
33%
Housing density: 1,066 houses/condos per square mile
Median price asked for vacant for-sale houses and condos in 2022: $351,429.
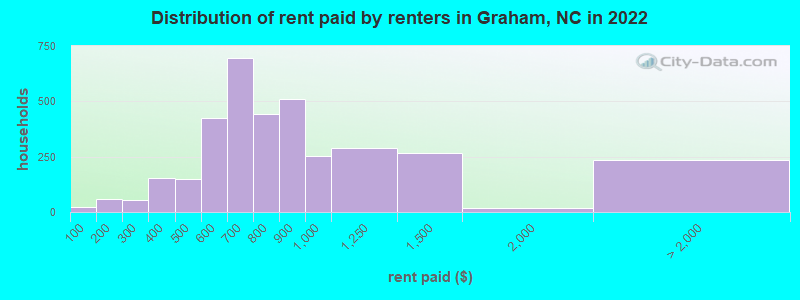
Median contract rent in 2022: $754 (lower quartile is $598, upper quartile is $1,008)
Median rent asked for vacant for-rent units in 2022: $1,465
Median gross rent in Graham, NC in 2022: $926
Housing units in Graham with a mortgage: 2,484 (224 second mortgage, 22 home equity loan, 206 both second mortgage and home equity loan )Houses without a mortgage: 37
Median household income for houses/condos with a mortgage: $78,649
Median household income for apartments without a mortgage: $44,481
Median monthly housing costs: $892
Data:
Median house or condo value ($)
Median house or condo value ($ change since 2000)
Median house or condo value ($) - White
Median house or condo value ($) - Black or African American
Median house or condo value ($) - Asian
Median house or condo value ($) - Hispanic or Latino
Median house or condo value ($) - American Indian and Alaska Native
Median house or condo value ($) - Multirace
Median house or condo value ($) - Other Race
Median price asked for mobile homes ($)
Household density (households per square mile)
Mean house or condo value by units in structure - 1, detached ($)
Mean house or condo value by units in structure - 1, attached ($)
Mean house or condo value by units in structure - 2 ($)
Mean house or condo value by units in structure by units in structure - 3 or 4 ($)
Mean house or condo value by units in structure - 5 or more ($)
Mean house or condo value by units in structure - Boat, RV, van, etc. ($)
Mean house or condo value by units in structure - Mobile home ($)
Median contract rent ($)
Median contract rent - Lower quartile ($)
Median contract rent - Upper quartile ($)
Median gross rent ($)
Urban houses (%)
Rural houses (%)
Houses occupied (%)
Houses occupied (% change since 2000)
Houses owner occupied (%)
Houses owner occupied (% change since 2000)
Houses renter occupied (%)
Houses renter occupied (% change since 2000)
Vacant housing units - For rent (%)
Vacant housing units - For rent (% change since 2000)
Vacant housing units - For sale only (%)
Vacant housing units - For sale only (% change since 2000)
Vacant housing units - Rented or sold, not occupied (%)
Vacant housing units - Rented or sold, not occupied (% change since 2000)
Vacant housing units - For seasonal, recreational, or occasional use (%)
Vacant housing units - For seasonal, recreational, or occasional use (% change since 2000)
Vacant housing units - For migrant workers (%)
Vacant housing units - For migrant workers (% change since 2000)
Vacant housing units - Other vacant (%)
Vacant housing units - Other vacant (% change since 2000)
Median monthly housing costs ($)
Median household income for houses/condos with a mortgage ($)
Median household income for houses/condos without a mortgage ($)
Median household income ($)
Median household income ($) - White
Median household income ($) - Black or African American
Median household income ($) - Asian
Median household income ($) - Hispanic or Latino
Median household income ($) - American Indian and Alaska Native
Median household income ($) - Multirace
Median household income ($) - Other Race
Mortgage status - with mortgage (%)
Mortgage status - with second mortgage (%)
Mortgage status - with home equity loan (%)
Mortgage status - with both second mortgage and home equity loan (%)
Mortgage status - without a mortgage (%)
Median year house/condo built
Median year apartment built
Household type by relationship - Male householder living alone (%)
Household type by relationship - Male householder not living alone (%)
Household type by relationship - Female householder living alone (%)
Household type by relationship - Female householder not living alone (%)
Household type by relationship - Opposite-Sex spouse (%)
Household type by relationship - Same-Sex spouse (%)
Household type by relationship - Opposite-Sex unmarried partner (%)
Household type by relationship - Same-Sex unmarried partner (%)
Household type by relationship - In group quarters (%)
Size of family households - 2-person household (%)
Size of family households - 3-person household (%)
Size of family households - 4-person household (%)
Size of family households - 5-person household (%)
Size of family households - 6-person household (%)
Size of family households - 7-or-more-person household (%)
Size of nonfamily households - 1-person household (%)
Size of nonfamily households - 2-person household (%)
Size of nonfamily households - 3-person household (%)
Size of nonfamily households - 4-person household (%)
Size of nonfamily households - 5-person household (%)
Size of nonfamily households - 6-person household (%)
Size of nonfamily households - 7-or-moreperson household (%)
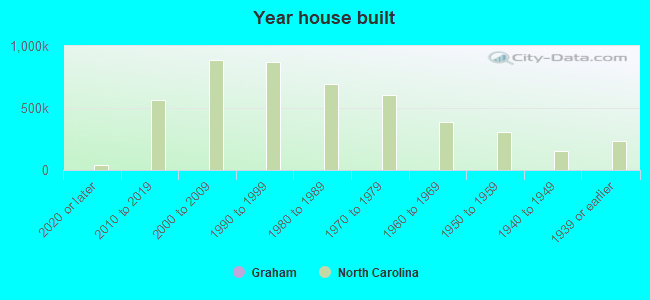
Year house built - Built 2010 or later (%)
Year house built - Built 2000 to 2009 (%)
Year house built - Built 1990 to 1999 (%)
Year house built - Built 1980 to 1989 (%)
Year house built - Built 1970 to 1979 (%)
Year house built - Built 1960 to 1969 (%)
Year house built - Built 1950 to 1959 (%)
Year house built - Built 1940 to 1949 (%)
Year house built - Built 1939 or earlier (%)
Median number of rooms in houses and condos
Median number of rooms in apartments
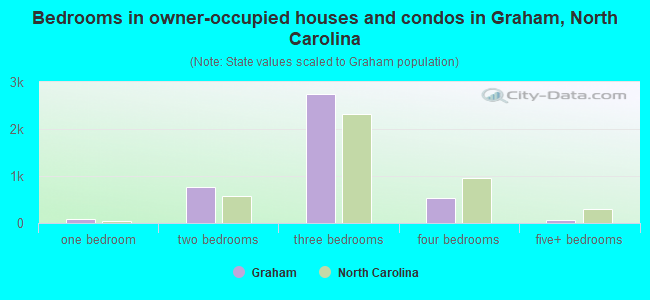
Median number of bedrooms in owner occupied houses
Mean number of bedrooms in owner occupied houses
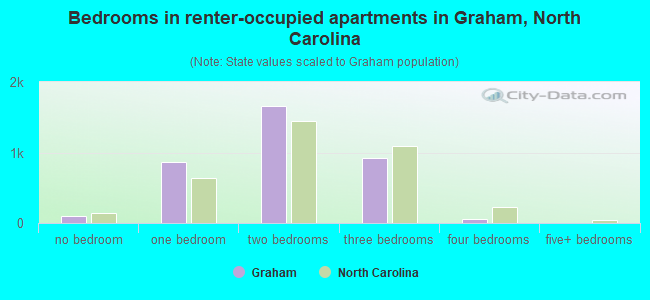
Median number of bedrooms in renter occupied houses
Mean number of bedrooms in renter occupied houses
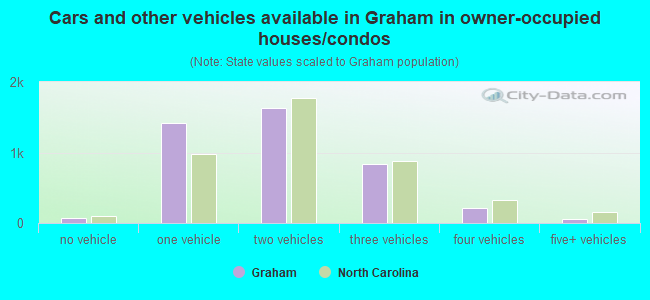
Median number of vehichles in owner occupied houses
Mean number of vehichles in owner occupied houses
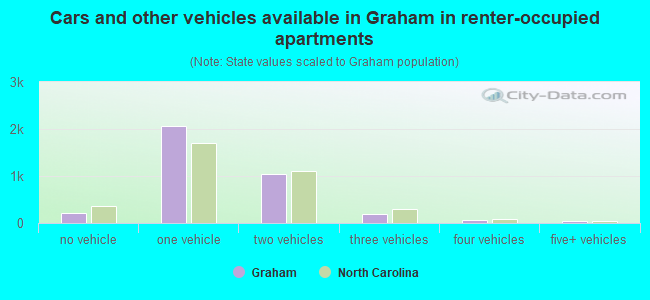
Median number of vehichles in renter occupied houses
Mean number of vehichles in renter occupied houses
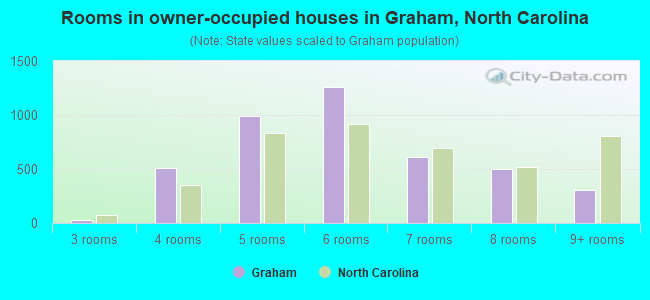
Rooms in owner-occupied houses - 1 room (%)
Rooms in owner-occupied houses - 2 rooms (%)
Rooms in owner-occupied houses - 3 rooms (%)
Rooms in owner-occupied houses - 4 rooms (%)
Rooms in owner-occupied houses - 5 rooms (%)
Rooms in owner-occupied houses - 6 rooms (%)
Rooms in owner-occupied houses - 7 rooms (%)
Rooms in owner-occupied houses - 8 rooms (%)
Rooms in owner-occupied houses - 9+ rooms (%)
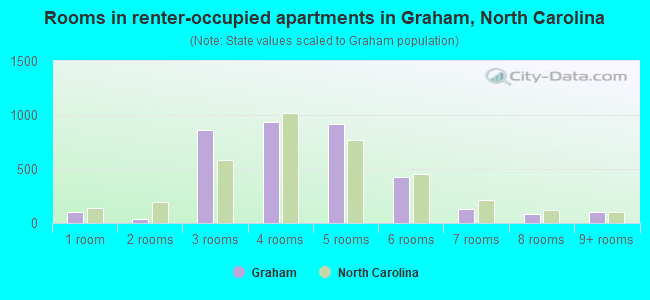
Rooms in renter-occupied houses - 1 room (%)
Rooms in renter-occupied houses - 2 rooms (%)
Rooms in renter-occupied houses - 3 rooms (%)
Rooms in renter-occupied houses - 4 rooms (%)
Rooms in renter-occupied houses - 5 rooms (%)
Rooms in renter-occupied houses - 6 rooms (%)
Rooms in renter-occupied houses - 7 rooms (%)
Rooms in renter-occupied houses - 8 rooms (%)
Rooms in renter-occupied houses - 9+ rooms (%)
Bedrooms in owner-occupied houses - no bedrooms (%)
Bedrooms in owner-occupied houses - 1 bedroom (%)
Bedrooms in owner-occupied houses - 2 bedrooms (%)
Bedrooms in owner-occupied houses - 3 bedrooms (%)
Bedrooms in owner-occupied houses - 4 bedrooms (%)
Bedrooms in owner-occupied houses - 5+ bedrooms (%)
Bedrooms in renter-occupied houses - no bedrooms (%)
Bedrooms in renter-occupied houses - 1 bedroom (%)
Bedrooms in renter-occupied houses - 2 bedrooms (%)
Bedrooms in renter-occupied houses - 3 bedrooms (%)
Bedrooms in renter-occupied houses - 4 bedrooms (%)
Bedrooms in renter-occupied houses - 5+ bedrooms (%)
Vehicles available in owner-occupied houses - no vehicle available (%)
Vehicles available in owner-occupied houses - 1 vehicle available(%)
Vehicles available in owner-occupied houses - 2 Vehicles available (%)
Vehicles available in owner-occupied houses - 3 Vehicles available (%)
Vehicles available in owner-occupied houses - 4 Vehicles available (%)
Vehicles available in owner-occupied houses - 5+ Vehicles available (%)
Vehicles available in renter-occupied houses - no vehicle available (%)
Vehicles available in renter-occupied houses - 1 vehicle available (%)
Vehicles available in renter-occupied houses - 2 Vehicles available (%)
Vehicles available in renter-occupied houses - 3 Vehicles available (%)
Vehicles available in renter-occupied houses - 4 Vehicles available (%)
Vehicles available in renter-occupied houses - 5+ Vehicles available (%)
Housing units in structures - 1, detached (%)
Housing units in structures - 1, attached (%)
Housing units in structures - 2 (%)
Housing units in structures - 3 or 4 (%)
Housing units in structures - 5 to 9 (%)
Housing units in structures - 10 to 19 (%)
Housing units in structures - 20 to 49 (%)
Housing units in structures - 50 or more (%)
Housing units in structures - Mobile home (%)
Housing units in structures - Boat, RV, van, etc. (%)
Housing units in structures - Owners - 1, detached (%)
Housing units in structures - Owners - 1, attached (%)
Housing units in structures - Owners - 2 (%)
Housing units in structures - Owners - 3 or 4 (%)
Housing units in structures - Owners - 5 to 9 (%)
Housing units in structures - Owners - 10 to 19 (%)
Housing units in structures - Owners - 20 to 49 (%)
Housing units in structures - Owners - 50 or more (%)
Housing units in structures - Owners - Mobile home (%)
Housing units in structures - Owners - Boat, RV, van, etc. (%)
Housing units in structures - Renters - 1, detached (%)
Housing units in structures - Renters - 1, attached (%)
Housing units in structures - Renters - 2 (%)
Housing units in structures - Renters - 3 or 4 (%)
Housing units in structures - Renters - 5 to 9 (%)
Housing units in structures - Renters - 10 to 19 (%)
Housing units in structures - Renters - 20 to 49 (%)
Housing units in structures - Renters - 50 or more (%)
Housing units in structures - Renters - Mobile home (%)
Housing units in structures - Renters - Boat, RV, van, etc. (%)
House/condo owner moved in on average (years ago)
Renter moved in on average (years ago)
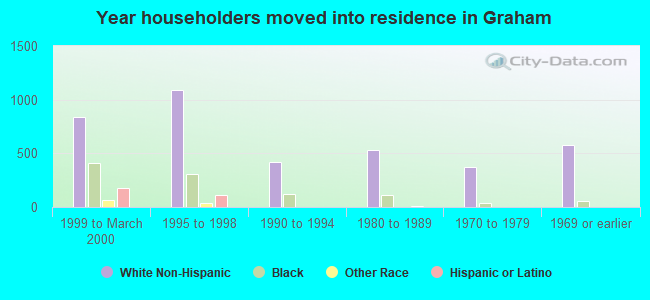
Year householder moved into unit - Moved in 1999 to March 2000 (%)
Year householder moved into unit - Moved in 1999 to March 2000 (%) - White
Year householder moved into unit - Moved in 1999 to March 2000 (%) - Black or African American
Year householder moved into unit - Moved in 1999 to March 2000 (%) - Asian
Year householder moved into unit - Moved in 1999 to March 2000 (%) - Hispanic or Latino
Year householder moved into unit - Moved in 1999 to March 2000 (%) - American Indian and Alaska Native
Year householder moved into unit - Moved in 1999 to March 2000 (%) - Multirace
Year householder moved into unit - Moved in 1999 to March 2000 (%) - Other Race
Year householder moved into unit - Moved in 1995 to 1998 (%)
Year householder moved into unit - Moved in 1995 to 1998 (%) - White
Year householder moved into unit - Moved in 1995 to 1998 (%) - Black or African American
Year householder moved into unit - Moved in 1995 to 1998 (%) - Asian
Year householder moved into unit - Moved in 1995 to 1998 (%) - Hispanic or Latino
Year householder moved into unit - Moved in 1995 to 1998 (%) - American Indian and Alaska Native
Year householder moved into unit - Moved in 1995 to 1998 (%) - Multirace
Year householder moved into unit - Moved in 1995 to 1998 (%) - Other Race
Year householder moved into unit - Moved in 1990 to 1994 (%)
Year householder moved into unit - Moved in 1990 to 1994 (%) - White
Year householder moved into unit - Moved in 1990 to 1994 (%) - Black or African American
Year householder moved into unit - Moved in 1990 to 1994 (%) - Asian
Year householder moved into unit - Moved in 1990 to 1994 (%) - Hispanic or Latino
Year householder moved into unit - Moved in 1990 to 1994 (%) - American Indian and Alaska Native
Year householder moved into unit - Moved in 1990 to 1994 (%) - Multirace
Year householder moved into unit - Moved in 1990 to 1994 (%) - Other Race
Year householder moved into unit - Moved in 1980 to 1989 (%)
Year householder moved into unit - Moved in 1980 to 1989 (%) - White
Year householder moved into unit - Moved in 1980 to 1989 (%) - Black or African American
Year householder moved into unit - Moved in 1980 to 1989 (%) - Asian
Year householder moved into unit - Moved in 1980 to 1989 (%) - Hispanic or Latino
Year householder moved into unit - Moved in 1980 to 1989 (%) - American Indian and Alaska Native
Year householder moved into unit - Moved in 1980 to 1989 (%) - Multirace
Year householder moved into unit - Moved in 1980 to 1989 (%) - Other Race
Year householder moved into unit - Moved in 1970 to 1979 (%)
Year householder moved into unit - Moved in 1970 to 1979 (%) - White
Year householder moved into unit - Moved in 1970 to 1979 (%) - Black or African American
Year householder moved into unit - Moved in 1970 to 1979 (%) - Asian
Year householder moved into unit - Moved in 1970 to 1979 (%) - Hispanic or Latino
Year householder moved into unit - Moved in 1970 to 1979 (%) - American Indian and Alaska Native
Year householder moved into unit - Moved in 1970 to 1979 (%) - Multirace
Year householder moved into unit - Moved in 1970 to 1979 (%) - Other Race
Year householder moved into unit - Moved in 1969 or earlier (%)
Year householder moved into unit - Moved in 1969 or earlier (%) - White
Year householder moved into unit - Moved in 1969 or earlier (%) - Black or African American
Year householder moved into unit - Moved in 1969 or earlier (%) - Asian
Year householder moved into unit - Moved in 1969 or earlier (%) - Hispanic or Latino
Year householder moved into unit - Moved in 1969 or earlier (%) - American Indian and Alaska Native
Year householder moved into unit - Moved in 1969 or earlier (%) - Multirace
Year householder moved into unit - Moved in 1969 or earlier (%) - Other Race
Housing units lacking complete plumbing facilities (%)
Housing units lacking complete kitchen facilities (%)
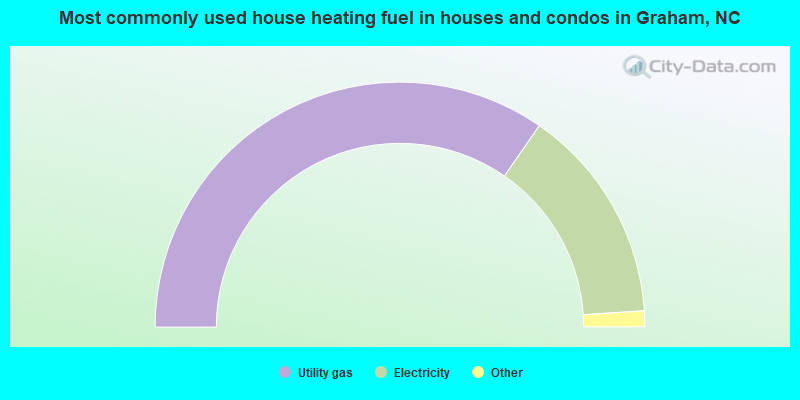
House heating fuel used in houses and condos - Utility gas (%)
House heating fuel used in houses and condos - Bottled, tank, or LP gas (%)
House heating fuel used in houses and condos - Electricity (%)
House heating fuel used in houses and condos - Fuel oil, kerosene, etc. (%)
House heating fuel used in houses and condos - Coal or coke (%)
House heating fuel used in houses and condos - Wood (%)
House heating fuel used in houses and condos - Solar energy (%)
House heating fuel used in houses and condos - Other fuel (%)
House heating fuel used in houses and condos - No fuel used (%)
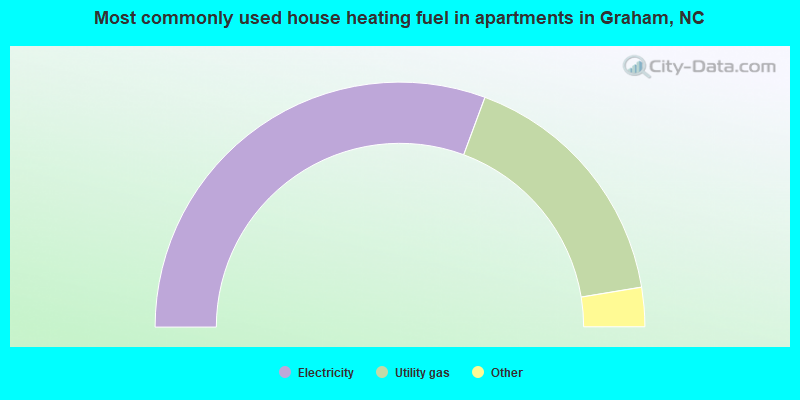
House heating fuel used in apartments - Utility gas (%)
House heating fuel used in apartments - Bottled, tank, or LP gas (%)
House heating fuel used in apartments - Electricity (%)
House heating fuel used in apartments - Fuel oil, kerosene, etc. (%)
House heating fuel used in apartments - Coal or coke (%)
House heating fuel used in apartments - Wood (%)
House heating fuel used in apartments - Solar energy (%)
House heating fuel used in apartments - Other fuel (%)
House heating fuel used in apartments - No fuel used (%)
Latest news about housing in Graham, NC collected exclusively by city-data.com from local newspapers, TV, and radio stations
Median year house/condo built: 1986Median year apartment built: 1981Household type by relationship:
Households: 17,592
Male householders: 3,481 (1,037 living alone ), Female householders: 4,214 (1,838 living alone )2,925 spouses (2,907 opposite-sex spouses ), 778 unmarried partners , (718 opposite-sex unmarried partners ), 4,376 children (4,113 natural , 62 adopted , 200 stepchildren ), 688 grandchildren , 234 brothers or sisters , 210 parents , 13 foster children , 136 other relatives , 312 non-relatives In group quarters: 220
Size of family households: 2,187 2-persons , 1,044 3-persons , 765 4-persons , 477 5-persons , 77 6-persons , 45 7-or-more-persons .
Size of nonfamily households: 2,898 1-person , 310 2-persons , 23 3-persons .
1,745 married couples with children. single-parent households (329 men , 1,016 women ).
83.5% of residents of Graham speak English at home. of residents speak Spanish at home (65% speak English very well , 15% speak English well , 13% speak English not well , 7% don't speak English at all ).of residents speak other Indo-European language at home (64% speak English very well , 36% speak English well ).of residents speak Asian or Pacific Island language at home (87% speak English very well , 8% speak English well , 5% speak English not well ).of residents speak other language at home (90% speak English very well , 10% speak English not well ).
Foreign born population: 1,801 (10.2%)of them are naturalized citizens )
Median number of rooms in houses and condos:
Median number of rooms in apartments
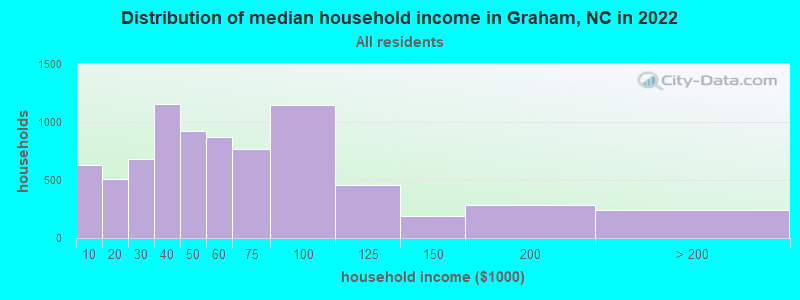
Graham, NC household income distribution 627 Less than $10,000512 $10,000 to $19,999683 $20,000 to $29,9991,155 $30,000 to $39,999920 $40,000 to $49,999872 $50,000 to $59,999768 $60,000 to $74,9991,144 $75,000 to $99,999456 $100,000 to $124,999188 $125,000 to $149,999285 $150,000 to $199,999245 $200,000 or more
Home value of owner - occupied houses in 2022 in Graham, NC 107 Less than $10,00025 $10,000 to $14,99957 $15,000 to $19,99954 $20,000 to $24,9995 $25,000 to $29,99969 $40,000 to $49,9994 $50,000 to $59,9997 $60,000 to $69,999137 $70,000 to $79,999105 $80,000 to $89,999104 $90,000 to $99,999335 $100,000 to $124,999170 $125,000 to $149,999448 $150,000 to $174,999361 $175,000 to $199,999891 $200,000 to $249,999294 $250,000 to $299,999562 $300,000 to $399,99927 $400,000 to $499,99921 $500,000 to $749,99941 $750,000 to $999,999Rent paid by renters in 2022 in Graham, NC 24 Less than $1009 $100 to $14947 $150 to $19943 $200 to $24912 $250 to $29967 $300 to $34986 $350 to $39942 $400 to $449104 $450 to $499185 $500 to $549237 $550 to $599431 $600 to $649266 $650 to $699197 $700 to $749244 $750 to $799511 $800 to $899253 $900 to $999287 $1,000 to $1,249265 $1,250 to $1,49916 $1,500 to $1,999233 No cash rent
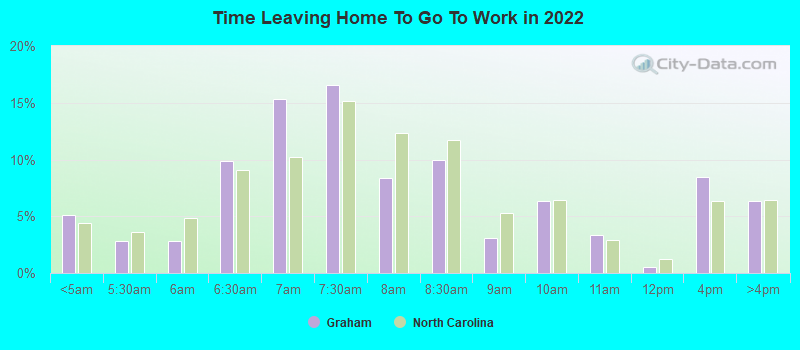
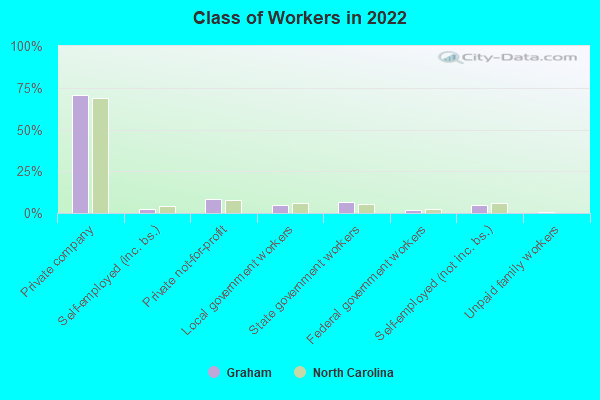
Percentage of workers working in this county: 58.5%Number of people working at home: 723 (9.2% of all workers )
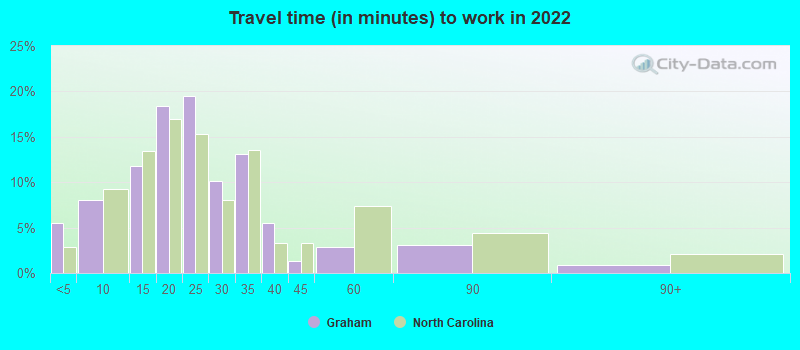
Travel time to work (commute)
Less than 5 minutes: 3855 to 9 minutes: 62810 to 14 minutes: 72515 to 19 minutes: 93820 to 24 minutes: 1,06025 to 29 minutes: 43930 to 34 minutes: 83135 to 39 minutes: 25240 to 44 minutes: 39745 to 59 minutes: 66960 to 89 minutes: 51290 or more minutes: 75
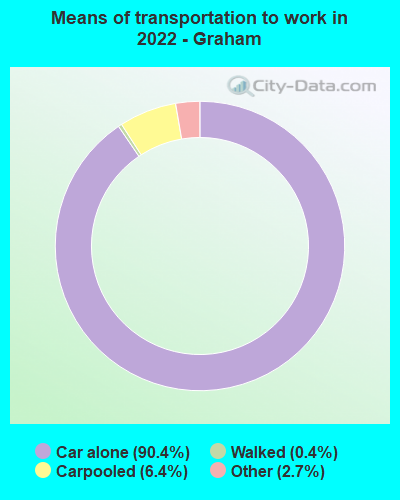
Means of transportation to work:
Drove a car alone: 6,343 (79.8%)Carpooled: 468 (5.9%)Taxi: 198 (2.5%)Walked: 32 (0.4%)Worked at home: 723 (9.1%)
Unemployment by race in 2022
Unemployment rate for White non-Hispanic residents 3.9% Males9.6% FemalesUnemployment rate for Black residents 16.1% Males4.1% FemalesUnemployment rate for other race residents 2.5% FemalesUnemployment rate for two or more race residents 7.4% FemalesUnemployment rate for Hispanic or Latino residents 2.3% Females
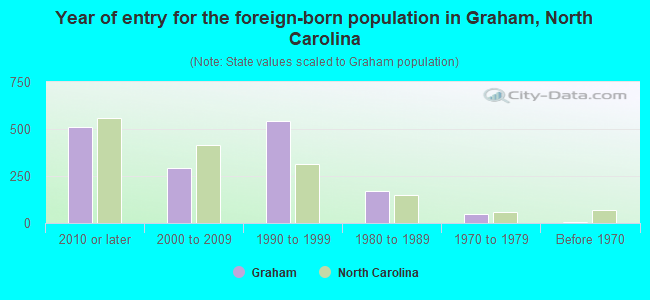
Year of entry for the foreign-born population in Graham, North Carolina
511 2010 or later 292 2000 to 2009 541 1990 to 1999 172 1980 to 1989 46 1970 to 1979 4 Before 1970
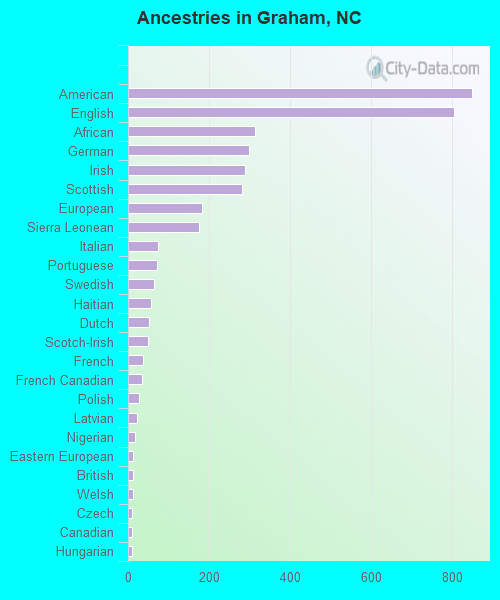
First ancestries reported:
American: 850 (10.2%)
English: 806 (9.7%)
African: 315 (3.8%)
German: 299 (3.6%)
Irish: 290 (3.5%)
Scottish: 282 (3.4%)
European: 182 (2.2%)
Sierra Leonean: 175 (2.1%)
Italian: 74 (0.9%)
Portuguese: 71 (0.9%)
Swedish: 65 (0.8%)
Haitian: 56 (0.7%)
Dutch: 53 (0.6%)
Scotch-Irish: 49 (0.6%)
French: 36 (0.4%)
French Canadian: 35 (0.4%)
Polish: 26 (0.3%)
Latvian: 22 (0.3%)
Nigerian: 18 (0.2%)
Eastern European: 13 (0.2%)
British: 12 (0.1%)
Welsh: 12 (0.1%)
Czech: 10 (0.1%)
Canadian: 9 (0.1%)
Hungarian: 9 (0.1%)
Slovak: 6 (0.07%)
Jamaican: 5 (0.06%)
Russian: 4 (0.05%) Most common places of birth for foreign-born residents (%): Mexico Graham:
34.3% (615)North Carolina:
24.7% (214,776)
El Salvador Graham:
9.7% (174)North Carolina:
3.8% (33,379)
Ghana Graham:
9.2% (165)North Carolina:
0.5% (4,233)
Sierra Leone Graham:
6.4% (114)North Carolina:
0.2% (1,485)
Argentina Graham:
6.3% (113)North Carolina:
0.4% (3,710)
Colombia Graham:
6.3% (113)North Carolina:
2.1% (18,275)
Guatemala Graham:
4.9% (87)North Carolina:
2.6% (22,964)
Thailand Graham:
4.0% (71)North Carolina:
0.7% (6,161)
Italy Graham:
3.0% (53)North Carolina:
0.5% (4,315)
Portugal Graham:
2.2% (39)North Carolina:
0.1% (903)
Place of birth for U.S.-born residents:
This state: 10,780Other state: 4,797Northeast: 2,040Midwest: 685South: 1,878West: 212 86.1% of Graham residents lived in the same house 1 years ago.
Out of people who lived in different houses, 41.0% lived in this county.
Out of people who lived in different counties, 58.9% lived in North Carolina.
Graham:
86.1%State average:
87.3%
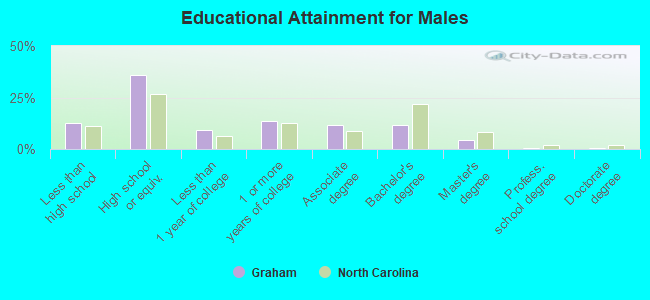
Education attainment for males 25 years and older:
No schooling: 93Nursery to 4th grade: 135th and 6th grade: 567th and 8th grade: 989th grade: 13410th grade: 10811th grade: 6212th grade, no diploma: 151High school graduate (or equivalency): 2,058Less than 1 year of college: 538Some college more than 1 year, no degree: 772Associate degree: 659Bachelor's degree: 669Master's degree: 247Professional school degree: 14Doctorate degree: 25
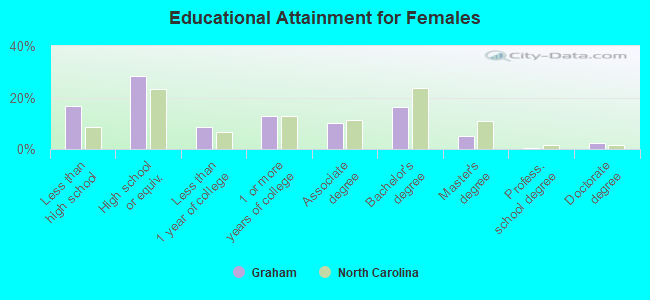
Education attainment for females 25 years and older:
No schooling: 209Nursery to 4th grade: 705th and 6th grade: 787th and 8th grade: 689th grade: 10010th grade: 13611th grade: 20512th grade, no diploma: 270High school graduate (or equivalency): 1,931Less than 1 year of college: 586Some college more than 1 year, no degree: 873Associate degree: 695Bachelor's degree: 1,105Master's degree: 351Professional school degree: 21Doctorate degree: 154
Housing units in structures:
One, detached: 5,565One, attached: 277Two: 2043 or 4: 5825 to 9: 74010 to 19: 55020 to 49: 24150 or more: 86Mobile homes: 413Median worth of mobile homes: $18,804
Housing units lacking complete plumbing facilities in 2022: 2.3%Housing units lacking complete kitchen facilities in 2022: 1.3%House/condo owner moved in on average 9 years ago
Renter moved in on average 3 years ago
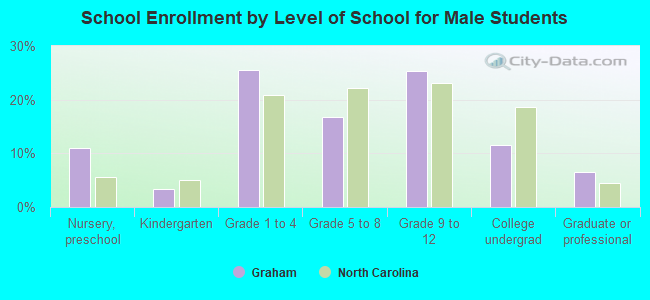
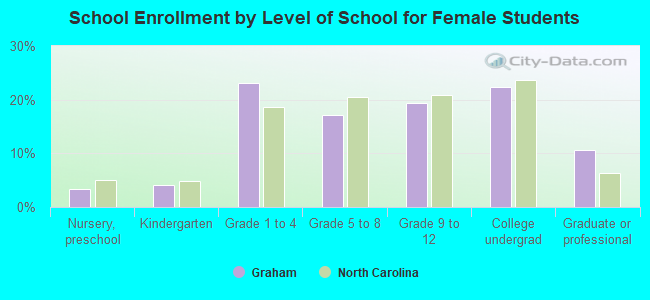
Private vs. public school enrollment:
Students in private schools in grades 1 to 8 (elementary and middle school): 190 Here:
13.5%North Carolina:
13.8%
Students in private schools in grades 9 to 12 (high school): 141 Here:
20.1%North Carolina:
11.9%
Students in private undergraduate colleges: 138 Here:
25.7%North Carolina:
19.3%