Goose Creek, SC (South Carolina) Houses and Residents
Estimated median house or condo value in 2022: $300,298 (it was $98,500 in 2000 )
Goose Creek:
$300,298South Carolina:
$254,600
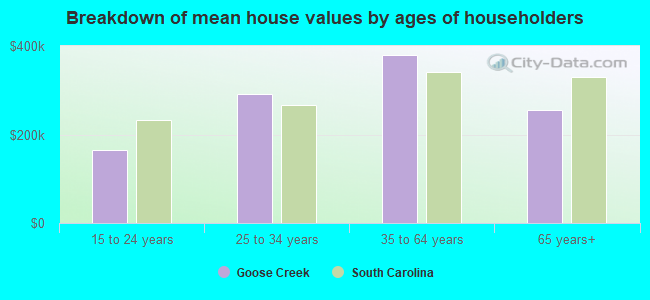
Lower value quartile - upper value quartile: $239,739 - $357,464Mean price in 2022: Detached houses: $298,092 Here:
$298,092State:
$368,255
Townhouses or other attached units: $171,455 Here:
$171,455State:
$292,023
In 5-or-more-unit structures: $215,813 Here:
$215,813State:
$326,361
Mobile homes: $67,651 Here:
$67,651State:
$102,531
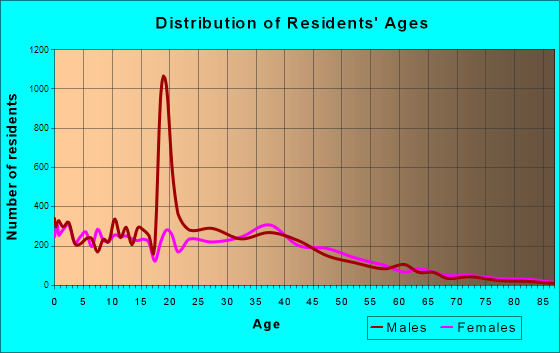
Total population: 40,370 (Urban population: 28,601, Rural population: 561 (all nonfarm) )
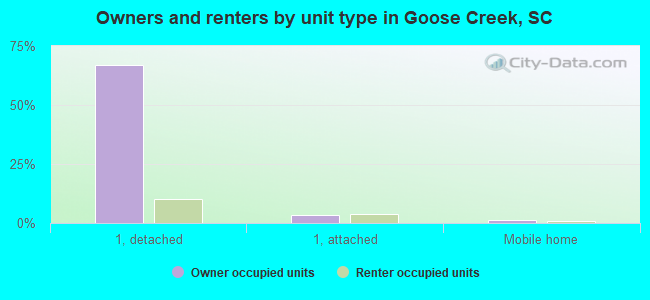
Houses: 17,976 (17,019 occupied: 12,179 owner occupied, 5,129 renter occupied )
% of renters here:
30%State:
28%
Housing density: 567 houses/condos per square mile
Median price asked for vacant for-sale houses and condos in 2022: $382,286.
Median contract rent in 2022: $1,586 (lower quartile is $1,366, upper quartile is over $2,000)
Median rent asked for vacant for-rent units in 2022: $1,431
Median gross rent in Goose Creek, SC in 2022: $1,659
Housing units in Goose Creek with a mortgage: 10,113 (240 second mortgage, 0 home equity loan, 202 both second mortgage and home equity loan )Houses without a mortgage: 176
Median household income for houses/condos with a mortgage: $94,563
Median household income for apartments without a mortgage: $81,473
Median monthly housing costs: $1,438
Data:
Median house or condo value ($)
Median house or condo value ($ change since 2000)
Median house or condo value ($) - White
Median house or condo value ($) - Black or African American
Median house or condo value ($) - Asian
Median house or condo value ($) - Hispanic or Latino
Median house or condo value ($) - American Indian and Alaska Native
Median house or condo value ($) - Multirace
Median house or condo value ($) - Other Race
Median price asked for mobile homes ($)
Household density (households per square mile)
Mean house or condo value by units in structure - 1, detached ($)
Mean house or condo value by units in structure - 1, attached ($)
Mean house or condo value by units in structure - 2 ($)
Mean house or condo value by units in structure by units in structure - 3 or 4 ($)
Mean house or condo value by units in structure - 5 or more ($)
Mean house or condo value by units in structure - Boat, RV, van, etc. ($)
Mean house or condo value by units in structure - Mobile home ($)
Median contract rent ($)
Median contract rent - Lower quartile ($)
Median contract rent - Upper quartile ($)
Median gross rent ($)
Urban houses (%)
Rural houses (%)
Houses occupied (%)
Houses occupied (% change since 2000)
Houses owner occupied (%)
Houses owner occupied (% change since 2000)
Houses renter occupied (%)
Houses renter occupied (% change since 2000)
Vacant housing units - For rent (%)
Vacant housing units - For rent (% change since 2000)
Vacant housing units - For sale only (%)
Vacant housing units - For sale only (% change since 2000)
Vacant housing units - Rented or sold, not occupied (%)
Vacant housing units - Rented or sold, not occupied (% change since 2000)
Vacant housing units - For seasonal, recreational, or occasional use (%)
Vacant housing units - For seasonal, recreational, or occasional use (% change since 2000)
Vacant housing units - For migrant workers (%)
Vacant housing units - For migrant workers (% change since 2000)
Vacant housing units - Other vacant (%)
Vacant housing units - Other vacant (% change since 2000)
Median monthly housing costs ($)
Median household income for houses/condos with a mortgage ($)
Median household income for houses/condos without a mortgage ($)
Median household income ($)
Median household income ($) - White
Median household income ($) - Black or African American
Median household income ($) - Asian
Median household income ($) - Hispanic or Latino
Median household income ($) - American Indian and Alaska Native
Median household income ($) - Multirace
Median household income ($) - Other Race
Mortgage status - with mortgage (%)
Mortgage status - with second mortgage (%)
Mortgage status - with home equity loan (%)
Mortgage status - with both second mortgage and home equity loan (%)
Mortgage status - without a mortgage (%)
Median year house/condo built
Median year apartment built
Household type by relationship - Male householder living alone (%)
Household type by relationship - Male householder not living alone (%)
Household type by relationship - Female householder living alone (%)
Household type by relationship - Female householder not living alone (%)
Household type by relationship - Opposite-Sex spouse (%)
Household type by relationship - Same-Sex spouse (%)
Household type by relationship - Opposite-Sex unmarried partner (%)
Household type by relationship - Same-Sex unmarried partner (%)
Household type by relationship - In group quarters (%)
Size of family households - 2-person household (%)
Size of family households - 3-person household (%)
Size of family households - 4-person household (%)
Size of family households - 5-person household (%)
Size of family households - 6-person household (%)
Size of family households - 7-or-more-person household (%)
Size of nonfamily households - 1-person household (%)
Size of nonfamily households - 2-person household (%)
Size of nonfamily households - 3-person household (%)
Size of nonfamily households - 4-person household (%)
Size of nonfamily households - 5-person household (%)
Size of nonfamily households - 6-person household (%)
Size of nonfamily households - 7-or-moreperson household (%)
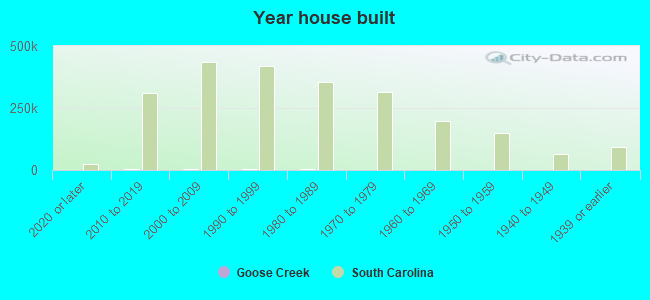
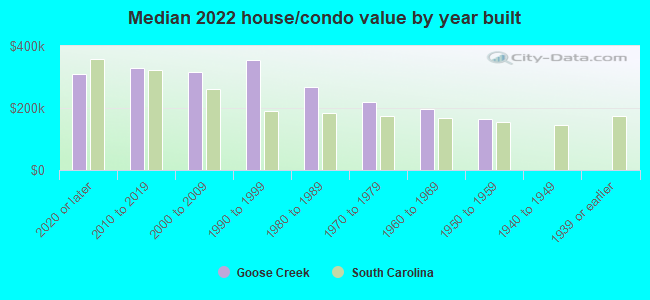
Year house built - Built 2010 or later (%)
Year house built - Built 2000 to 2009 (%)
Year house built - Built 1990 to 1999 (%)
Year house built - Built 1980 to 1989 (%)
Year house built - Built 1970 to 1979 (%)
Year house built - Built 1960 to 1969 (%)
Year house built - Built 1950 to 1959 (%)
Year house built - Built 1940 to 1949 (%)
Year house built - Built 1939 or earlier (%)
Median number of rooms in houses and condos
Median number of rooms in apartments
Median number of bedrooms in owner occupied houses
Mean number of bedrooms in owner occupied houses
Median number of bedrooms in renter occupied houses
Mean number of bedrooms in renter occupied houses
Median number of vehichles in owner occupied houses
Mean number of vehichles in owner occupied houses
Median number of vehichles in renter occupied houses
Mean number of vehichles in renter occupied houses
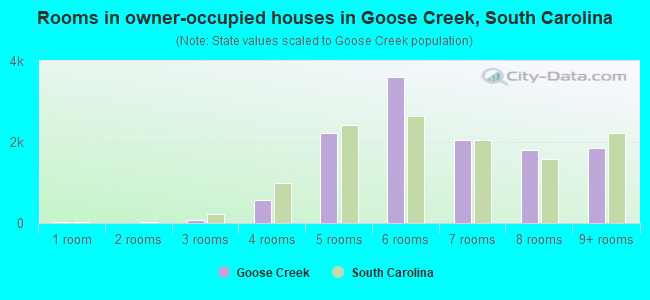
Rooms in owner-occupied houses - 1 room (%)
Rooms in owner-occupied houses - 2 rooms (%)
Rooms in owner-occupied houses - 3 rooms (%)
Rooms in owner-occupied houses - 4 rooms (%)
Rooms in owner-occupied houses - 5 rooms (%)
Rooms in owner-occupied houses - 6 rooms (%)
Rooms in owner-occupied houses - 7 rooms (%)
Rooms in owner-occupied houses - 8 rooms (%)
Rooms in owner-occupied houses - 9+ rooms (%)
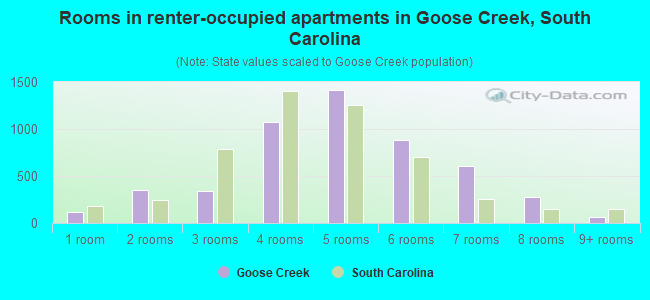
Rooms in renter-occupied houses - 1 room (%)
Rooms in renter-occupied houses - 2 rooms (%)
Rooms in renter-occupied houses - 3 rooms (%)
Rooms in renter-occupied houses - 4 rooms (%)
Rooms in renter-occupied houses - 5 rooms (%)
Rooms in renter-occupied houses - 6 rooms (%)
Rooms in renter-occupied houses - 7 rooms (%)
Rooms in renter-occupied houses - 8 rooms (%)
Rooms in renter-occupied houses - 9+ rooms (%)
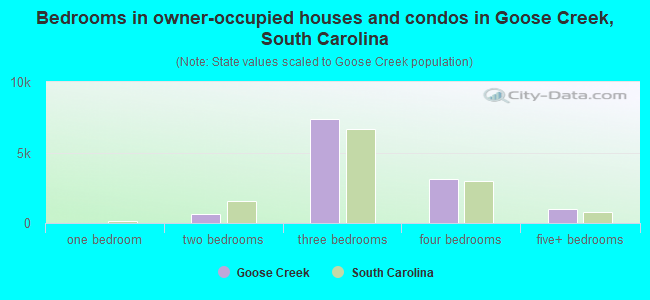
Bedrooms in owner-occupied houses - no bedrooms (%)
Bedrooms in owner-occupied houses - 1 bedroom (%)
Bedrooms in owner-occupied houses - 2 bedrooms (%)
Bedrooms in owner-occupied houses - 3 bedrooms (%)
Bedrooms in owner-occupied houses - 4 bedrooms (%)
Bedrooms in owner-occupied houses - 5+ bedrooms (%)
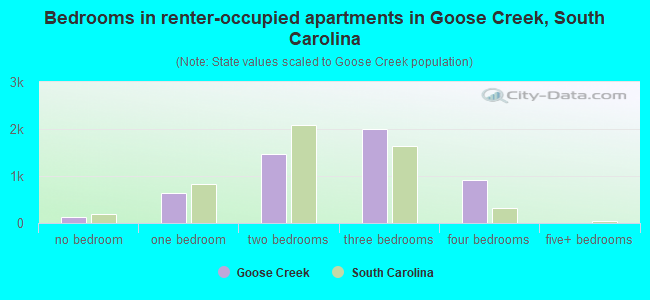
Bedrooms in renter-occupied houses - no bedrooms (%)
Bedrooms in renter-occupied houses - 1 bedroom (%)
Bedrooms in renter-occupied houses - 2 bedrooms (%)
Bedrooms in renter-occupied houses - 3 bedrooms (%)
Bedrooms in renter-occupied houses - 4 bedrooms (%)
Bedrooms in renter-occupied houses - 5+ bedrooms (%)
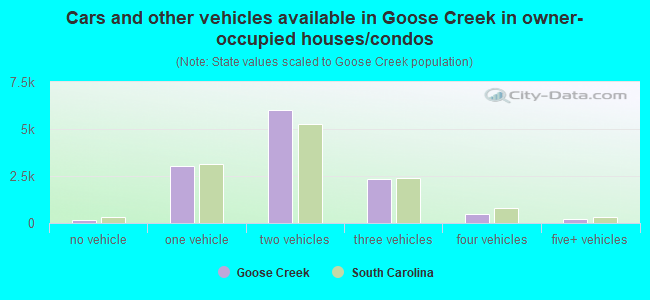
Vehicles available in owner-occupied houses - no vehicle available (%)
Vehicles available in owner-occupied houses - 1 vehicle available(%)
Vehicles available in owner-occupied houses - 2 Vehicles available (%)
Vehicles available in owner-occupied houses - 3 Vehicles available (%)
Vehicles available in owner-occupied houses - 4 Vehicles available (%)
Vehicles available in owner-occupied houses - 5+ Vehicles available (%)
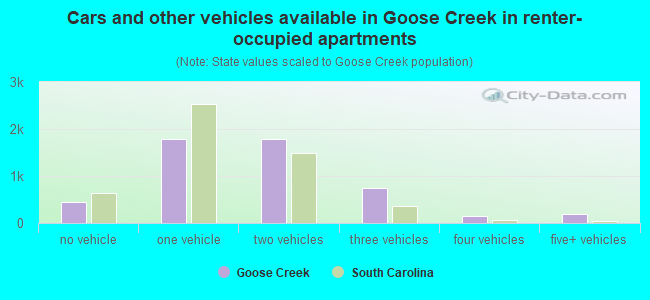
Vehicles available in renter-occupied houses - no vehicle available (%)
Vehicles available in renter-occupied houses - 1 vehicle available (%)
Vehicles available in renter-occupied houses - 2 Vehicles available (%)
Vehicles available in renter-occupied houses - 3 Vehicles available (%)
Vehicles available in renter-occupied houses - 4 Vehicles available (%)
Vehicles available in renter-occupied houses - 5+ Vehicles available (%)
Housing units in structures - 1, detached (%)
Housing units in structures - 1, attached (%)
Housing units in structures - 2 (%)
Housing units in structures - 3 or 4 (%)
Housing units in structures - 5 to 9 (%)
Housing units in structures - 10 to 19 (%)
Housing units in structures - 20 to 49 (%)
Housing units in structures - 50 or more (%)
Housing units in structures - Mobile home (%)
Housing units in structures - Boat, RV, van, etc. (%)
Housing units in structures - Owners - 1, detached (%)
Housing units in structures - Owners - 1, attached (%)
Housing units in structures - Owners - 2 (%)
Housing units in structures - Owners - 3 or 4 (%)
Housing units in structures - Owners - 5 to 9 (%)
Housing units in structures - Owners - 10 to 19 (%)
Housing units in structures - Owners - 20 to 49 (%)
Housing units in structures - Owners - 50 or more (%)
Housing units in structures - Owners - Mobile home (%)
Housing units in structures - Owners - Boat, RV, van, etc. (%)
Housing units in structures - Renters - 1, detached (%)
Housing units in structures - Renters - 1, attached (%)
Housing units in structures - Renters - 2 (%)
Housing units in structures - Renters - 3 or 4 (%)
Housing units in structures - Renters - 5 to 9 (%)
Housing units in structures - Renters - 10 to 19 (%)
Housing units in structures - Renters - 20 to 49 (%)
Housing units in structures - Renters - 50 or more (%)
Housing units in structures - Renters - Mobile home (%)
Housing units in structures - Renters - Boat, RV, van, etc. (%)
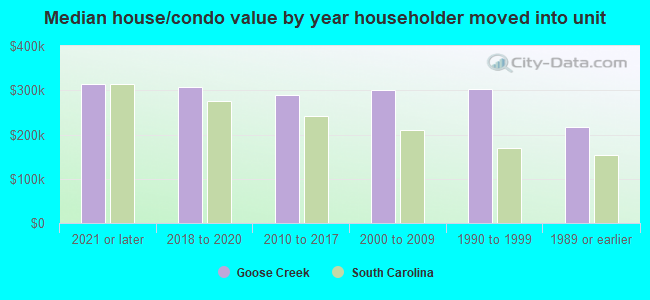
House/condo owner moved in on average (years ago)
Renter moved in on average (years ago)
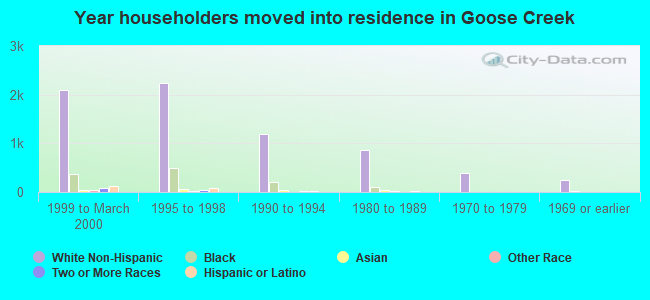
Year householder moved into unit - Moved in 1999 to March 2000 (%)
Year householder moved into unit - Moved in 1999 to March 2000 (%) - White
Year householder moved into unit - Moved in 1999 to March 2000 (%) - Black or African American
Year householder moved into unit - Moved in 1999 to March 2000 (%) - Asian
Year householder moved into unit - Moved in 1999 to March 2000 (%) - Hispanic or Latino
Year householder moved into unit - Moved in 1999 to March 2000 (%) - American Indian and Alaska Native
Year householder moved into unit - Moved in 1999 to March 2000 (%) - Multirace
Year householder moved into unit - Moved in 1999 to March 2000 (%) - Other Race
Year householder moved into unit - Moved in 1995 to 1998 (%)
Year householder moved into unit - Moved in 1995 to 1998 (%) - White
Year householder moved into unit - Moved in 1995 to 1998 (%) - Black or African American
Year householder moved into unit - Moved in 1995 to 1998 (%) - Asian
Year householder moved into unit - Moved in 1995 to 1998 (%) - Hispanic or Latino
Year householder moved into unit - Moved in 1995 to 1998 (%) - American Indian and Alaska Native
Year householder moved into unit - Moved in 1995 to 1998 (%) - Multirace
Year householder moved into unit - Moved in 1995 to 1998 (%) - Other Race
Year householder moved into unit - Moved in 1990 to 1994 (%)
Year householder moved into unit - Moved in 1990 to 1994 (%) - White
Year householder moved into unit - Moved in 1990 to 1994 (%) - Black or African American
Year householder moved into unit - Moved in 1990 to 1994 (%) - Asian
Year householder moved into unit - Moved in 1990 to 1994 (%) - Hispanic or Latino
Year householder moved into unit - Moved in 1990 to 1994 (%) - American Indian and Alaska Native
Year householder moved into unit - Moved in 1990 to 1994 (%) - Multirace
Year householder moved into unit - Moved in 1990 to 1994 (%) - Other Race
Year householder moved into unit - Moved in 1980 to 1989 (%)
Year householder moved into unit - Moved in 1980 to 1989 (%) - White
Year householder moved into unit - Moved in 1980 to 1989 (%) - Black or African American
Year householder moved into unit - Moved in 1980 to 1989 (%) - Asian
Year householder moved into unit - Moved in 1980 to 1989 (%) - Hispanic or Latino
Year householder moved into unit - Moved in 1980 to 1989 (%) - American Indian and Alaska Native
Year householder moved into unit - Moved in 1980 to 1989 (%) - Multirace
Year householder moved into unit - Moved in 1980 to 1989 (%) - Other Race
Year householder moved into unit - Moved in 1970 to 1979 (%)
Year householder moved into unit - Moved in 1970 to 1979 (%) - White
Year householder moved into unit - Moved in 1970 to 1979 (%) - Black or African American
Year householder moved into unit - Moved in 1970 to 1979 (%) - Asian
Year householder moved into unit - Moved in 1970 to 1979 (%) - Hispanic or Latino
Year householder moved into unit - Moved in 1970 to 1979 (%) - American Indian and Alaska Native
Year householder moved into unit - Moved in 1970 to 1979 (%) - Multirace
Year householder moved into unit - Moved in 1970 to 1979 (%) - Other Race
Year householder moved into unit - Moved in 1969 or earlier (%)
Year householder moved into unit - Moved in 1969 or earlier (%) - White
Year householder moved into unit - Moved in 1969 or earlier (%) - Black or African American
Year householder moved into unit - Moved in 1969 or earlier (%) - Asian
Year householder moved into unit - Moved in 1969 or earlier (%) - Hispanic or Latino
Year householder moved into unit - Moved in 1969 or earlier (%) - American Indian and Alaska Native
Year householder moved into unit - Moved in 1969 or earlier (%) - Multirace
Year householder moved into unit - Moved in 1969 or earlier (%) - Other Race
Housing units lacking complete plumbing facilities (%)
Housing units lacking complete kitchen facilities (%)
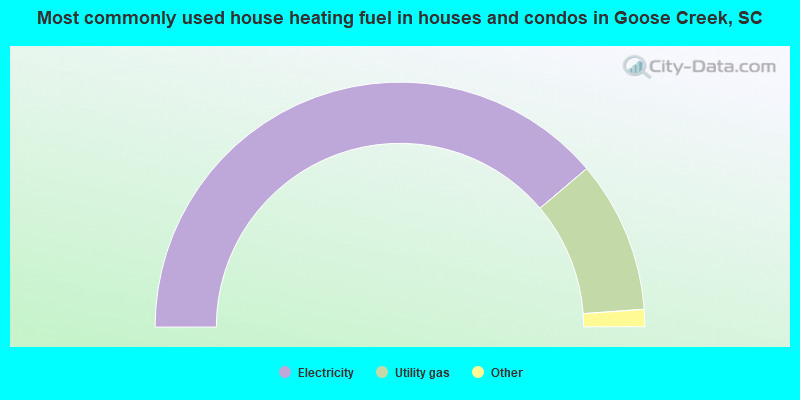
House heating fuel used in houses and condos - Utility gas (%)
House heating fuel used in houses and condos - Bottled, tank, or LP gas (%)
House heating fuel used in houses and condos - Electricity (%)
House heating fuel used in houses and condos - Fuel oil, kerosene, etc. (%)
House heating fuel used in houses and condos - Coal or coke (%)
House heating fuel used in houses and condos - Wood (%)
House heating fuel used in houses and condos - Solar energy (%)
House heating fuel used in houses and condos - Other fuel (%)
House heating fuel used in houses and condos - No fuel used (%)
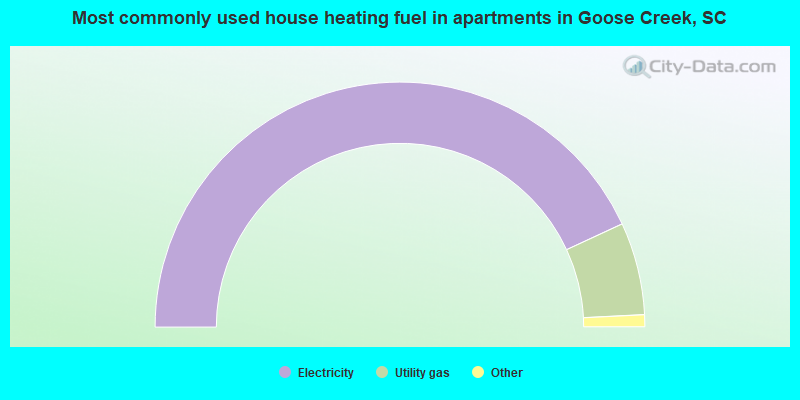
House heating fuel used in apartments - Utility gas (%)
House heating fuel used in apartments - Bottled, tank, or LP gas (%)
House heating fuel used in apartments - Electricity (%)
House heating fuel used in apartments - Fuel oil, kerosene, etc. (%)
House heating fuel used in apartments - Coal or coke (%)
House heating fuel used in apartments - Wood (%)
House heating fuel used in apartments - Solar energy (%)
House heating fuel used in apartments - Other fuel (%)
House heating fuel used in apartments - No fuel used (%)
Median year house/condo built: 1999Median year apartment built: 2007Household type by relationship:
Households: 48,572
Male householders: 8,490 (1,562 living alone ), Female householders: 8,418 (1,746 living alone )8,822 spouses (8,777 opposite-sex spouses ), 954 unmarried partners , (929 opposite-sex unmarried partners ), 13,890 children (13,300 natural , 121 adopted , 468 stepchildren ), 889 grandchildren , 776 brothers or sisters , 1,148 parents , 12 foster children , 490 other relatives , 2,071 non-relatives In group quarters: 2,607
Size of family households: 5,792 2-persons , 2,774 3-persons , 2,509 4-persons , 826 5-persons , 812 6-persons , 47 7-or-more-persons .
Size of nonfamily households: 3,362 1-person , 805 2-persons , 264 3-persons , 214 4-persons .
7,401 married couples with children. single-parent households (247 men , 1,457 women ).
88.1% of residents of Goose Creek speak English at home. of residents speak Spanish at home (61% speak English very well , 19% speak English well , 13% speak English not well , 7% don't speak English at all ).of residents speak other Indo-European language at home (84% speak English very well , 1% speak English well , 10% speak English not well , 5% don't speak English at all ).of residents speak Asian or Pacific Island language at home (76% speak English very well , 21% speak English well , 3% speak English not well ).of residents speak other language at home (59% speak English very well , 26% speak English well , 15% speak English not well ).
Foreign born population: 2,780 (5.7%)of them are naturalized citizens )
Median number of rooms in houses and condos:
Median number of rooms in apartments
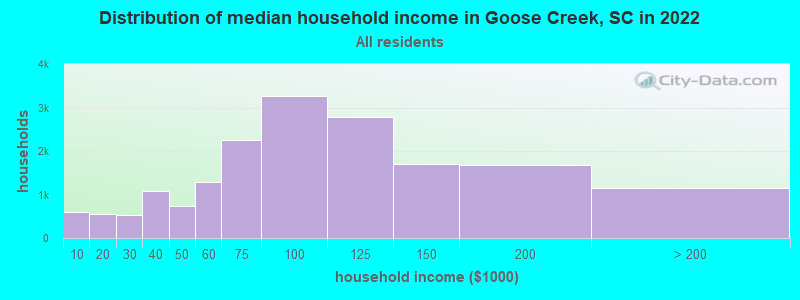
Goose Creek, SC household income distribution 590 Less than $10,000545 $10,000 to $19,999530 $20,000 to $29,9991,089 $30,000 to $39,999743 $40,000 to $49,9991,286 $50,000 to $59,9992,264 $60,000 to $74,9993,271 $75,000 to $99,9992,771 $100,000 to $124,9991,690 $125,000 to $149,9991,668 $150,000 to $199,9991,149 $200,000 or more
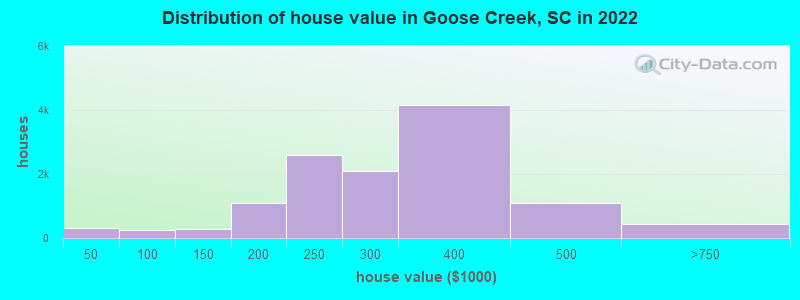
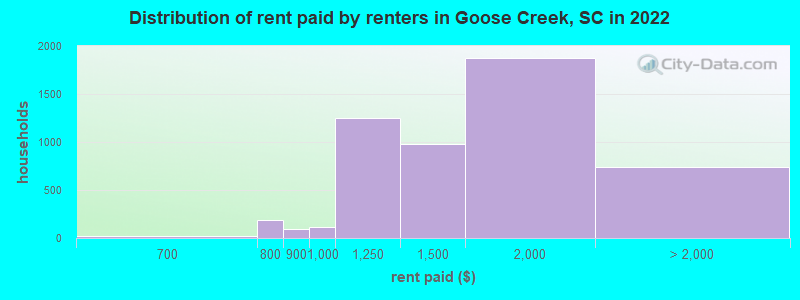
Home value of owner - occupied houses in 2022 in Goose Creek, SC 77 Less than $10,00085 $10,000 to $14,99920 $15,000 to $19,99942 $20,000 to $24,99927 $25,000 to $29,9992 $30,000 to $34,99923 $35,000 to $39,99937 $40,000 to $49,99984 $50,000 to $59,99957 $60,000 to $69,9996 $70,000 to $79,99917 $80,000 to $89,99939 $90,000 to $99,99951 $100,000 to $124,999217 $125,000 to $149,999465 $150,000 to $174,999632 $175,000 to $199,9992,591 $200,000 to $249,9992,085 $250,000 to $299,9994,157 $300,000 to $399,9991,088 $400,000 to $499,999380 $500,000 to $749,99969 $750,000 to $999,9993 $1,000,000 to $1,499,999Rent paid by renters in 2022 in Goose Creek, SC 11 Less than $10013 $100 to $1499 $200 to $2492 $250 to $2999 $400 to $4497 $450 to $4992 $500 to $54915 $550 to $5996 $600 to $64916 $650 to $69945 $700 to $749140 $750 to $79988 $800 to $899114 $900 to $9991,251 $1,000 to $1,249981 $1,250 to $1,4991,874 $1,500 to $1,999443 $2,000 to $2,49936 $2,500 to $2,999257 No cash rent
Percentage of workers working in this county: 51.8%Number of people working at home: 3,319 (12.6% of all workers )
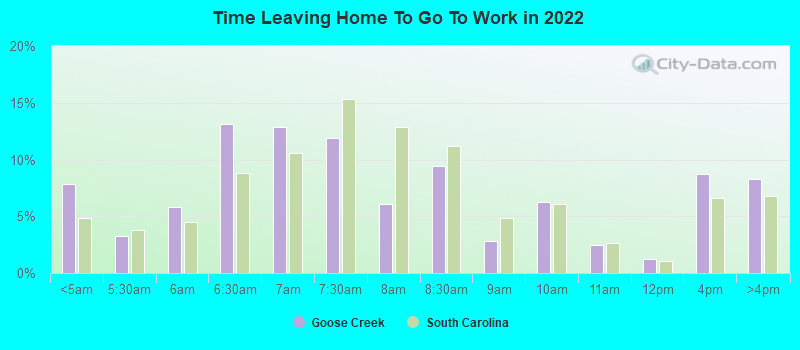
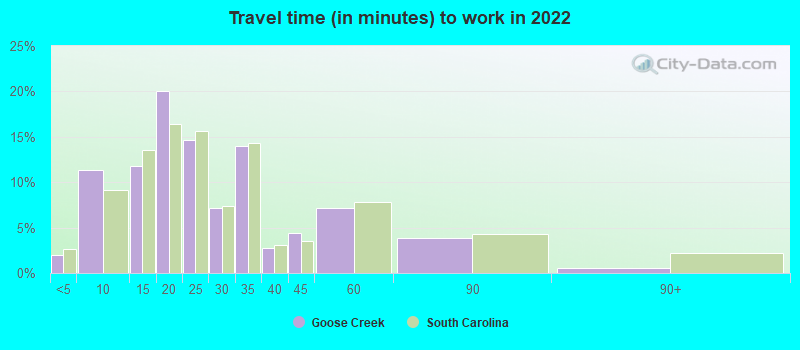
Travel time to work (commute)
Less than 5 minutes: 2465 to 9 minutes: 1,97710 to 14 minutes: 2,89815 to 19 minutes: 3,50220 to 24 minutes: 3,88925 to 29 minutes: 2,19630 to 34 minutes: 4,29035 to 39 minutes: 63140 to 44 minutes: 64145 to 59 minutes: 1,80660 to 89 minutes: 1,34790 or more minutes: 514
Means of transportation to work:
Drove a car alone: 13,666 (65.7%)Carpooled: 2,189 (10.5%)Light rail, streetcar or trolley : 9 (0.0%)Ferryboat: 4 (0.0%)Taxi: 296 (1.4%)Bicycle: 13 (0.1%)Walked: 1,490 (7.2%)Worked at home: 3,319 (16.0%)
Unemployment by race in 2022
Unemployment rate for White non-Hispanic residents 1.6% Males1.9% FemalesUnemployment rate for Black residents 3.4% Males3.4% FemalesUnemployment rate for other race residents 4.7% Males1.3% FemalesUnemployment rate for two or more race residents 1.6% FemalesUnemployment rate for Hispanic or Latino residents 3.1% Males3.7% Females
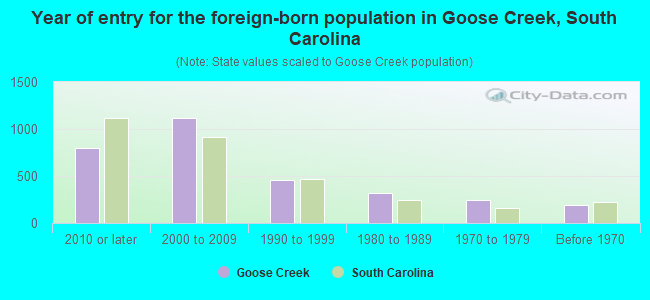
Year of entry for the foreign-born population in Goose Creek, South Carolina
798 2010 or later 1,115 2000 to 2009 461 1990 to 1999 319 1980 to 1989 244 1970 to 1979 191 Before 1970
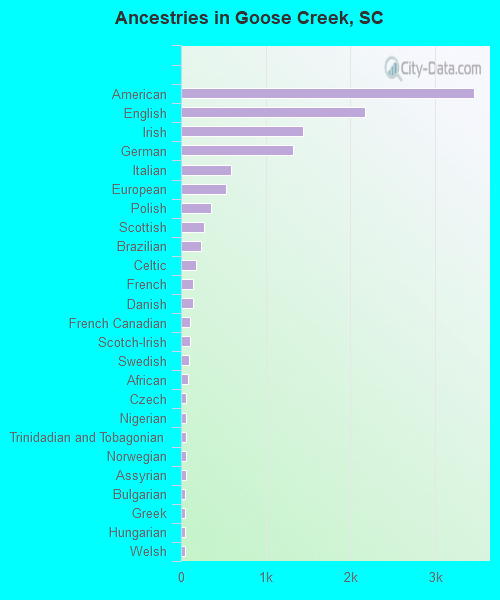
First ancestries reported:
American: 3,464 (15.4%)
English: 2,170 (9.6%)
Irish: 1,443 (6.4%)
German: 1,318 (5.8%)
Italian: 586 (2.6%)
European: 527 (2.3%)
Polish: 360 (1.6%)
Scottish: 272 (1.2%)
Brazilian: 232 (1.0%)
Celtic: 175 (0.8%)
French: 136 (0.6%)
Danish: 136 (0.6%)
French Canadian: 106 (0.5%)
Scotch-Irish: 101 (0.4%)
Swedish: 96 (0.4%)
African: 88 (0.4%)
Czech: 60 (0.3%)
Nigerian: 60 (0.3%)
Trinidadian and Tobagonian: 60 (0.3%)
Norwegian: 57 (0.3%)
Assyrian: 56 (0.2%)
Bulgarian: 53 (0.2%)
Greek: 52 (0.2%)
Hungarian: 48 (0.2%)
Welsh: 43 (0.2%)
Portuguese: 41 (0.2%)
Eastern European: 40 (0.2%)
British: 39 (0.2%)
Scandinavian: 37 (0.2%)
Ukrainian: 29 (0.1%)
Russian: 26 (0.1%)
Dutch: 24 (0.1%)
Yugoslavian: 17 (0.08%)
Arab: 16 (0.07%)
Finnish: 16 (0.07%)
Iraqi: 12 (0.05%)
Pennsylvania German: 12 (0.05%)
Ethiopian: 7 (0.03%)
Croatian: 3 (0.01%)
Jamaican: 3 (0.01%) Most common places of birth for foreign-born residents (%): Philippines Goose Creek:
29.6% (901)South Carolina:
4.1% (11,031)
Honduras Goose Creek:
8.9% (271)South Carolina:
4.8% (12,834)
Mexico Goose Creek:
6.5% (198)South Carolina:
22.5% (60,774)
Colombia Goose Creek:
5.9% (179)South Carolina:
4.3% (11,533)
Brazil Goose Creek:
5.2% (159)South Carolina:
2.0% (5,344)
China, excluding Hong Kong and Taiwan Goose Creek:
4.1% (124)South Carolina:
3.2% (8,721)
El Salvador Goose Creek:
3.1% (93)South Carolina:
1.1% (2,998)
Italy Goose Creek:
2.4% (73)South Carolina:
0.5% (1,444)
Scotland Goose Creek:
2.4% (72)South Carolina:
0.4% (1,092)
Poland Goose Creek:
2.1% (65)South Carolina:
0.6% (1,691)
Cuba Goose Creek:
2.0% (61)South Carolina:
1.5% (3,987)
Trinidad and Tobago Goose Creek:
1.8% (56)South Carolina:
0.4% (1,084)
Denmark Goose Creek:
1.7% (51)South Carolina:
0.1% (347)
Chile Goose Creek:
1.7% (51)South Carolina:
0.2% (567)
Place of birth for U.S.-born residents:
This state: 20,437Other state: 23,831Northeast: 5,840Midwest: 4,155South: 10,590West: 2,962 78.4% of Goose Creek residents lived in the same house 1 years ago.
Out of people who lived in different houses, 23.1% lived in this county.
Out of people who lived in different counties, 29.7% lived in South Carolina.
Goose Creek:
78.4%State average:
86.5%
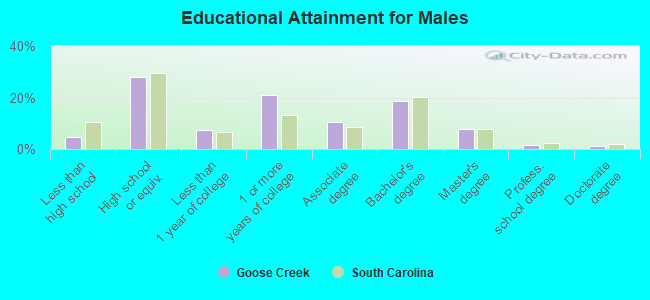
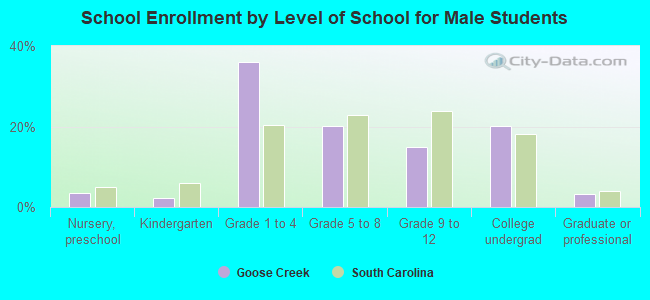
Education attainment for males 25 years and older:
No schooling: 44Nursery to 4th grade: 05th and 6th grade: 687th and 8th grade: 939th grade: 7810th grade: 7311th grade: 5912th grade, no diploma: 278High school graduate (or equivalency): 3,983Less than 1 year of college: 1,030Some college more than 1 year, no degree: 2,979Associate degree: 1,508Bachelor's degree: 2,662Master's degree: 1,091Professional school degree: 218Doctorate degree: 162
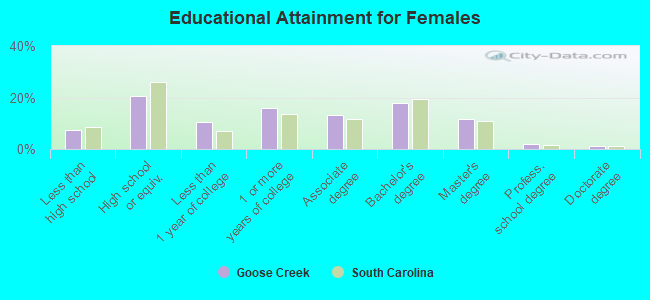
Education attainment for females 25 years and older:
No schooling: 86Nursery to 4th grade: 185th and 6th grade: 1057th and 8th grade: 2359th grade: 25210th grade: 6111th grade: 6112th grade, no diploma: 334High school graduate (or equivalency): 3,278Less than 1 year of college: 1,657Some college more than 1 year, no degree: 2,523Associate degree: 2,090Bachelor's degree: 2,821Master's degree: 1,841Professional school degree: 277Doctorate degree: 156
Housing units in structures:
One, detached: 12,904One, attached: 1,523Two: 6433 or 4: 3285 to 9: 49510 to 19: 57920 to 49: 81950 or more: 331Mobile homes: 348Housing units lacking complete plumbing facilities in 2022: 0.1%Housing units lacking complete kitchen facilities in 2022: 0.7%House/condo owner moved in on average 8 years ago
Renter moved in on average 1 years ago
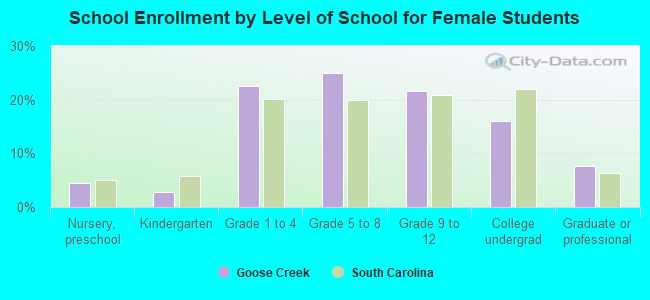
Private vs. public school enrollment:
Students in private schools in grades 1 to 8 (elementary and middle school): 1,021 Here:
16.7%South Carolina:
14.4%
Students in private schools in grades 9 to 12 (high school): 85 Here:
4.0%South Carolina:
11.1%
Students in private undergraduate colleges: 723 Here:
35.8%South Carolina:
21.9%