Glenwood Springs, CO (Colorado) Houses and Residents
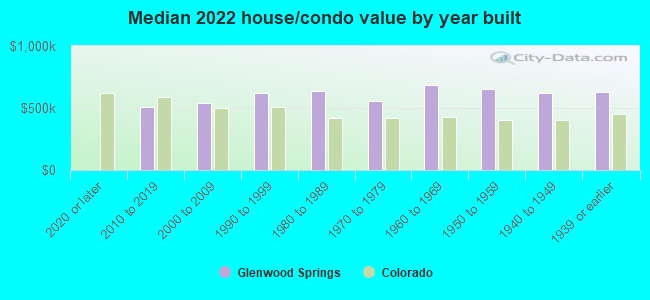
| Glenwood Springs: | $604,740 |
| Colorado: | $531,100 |
Mean price in 2022:
Detached houses: $727,212
Here: $727,212 State: $676,667 Townhouses or other attached units: $543,132
Here: $543,132 State: $526,340 In 2-unit structures: $507,814
Here: $507,814 State: $431,509 In 3-to-4-unit structures: $288,544
Here: $288,544 State: $385,502 In 5-or-more-unit structures: $390,609
Here: $390,609 State: $417,586 Mobile homes: $99,071
Here: $99,071 State: $115,510
Total population: 9,840 (Urban population: 7,702 (all inside urban clusters), Rural population: 117 (all nonfarm))
Houses: 4,449 (4,041 occupied: 2,116 owner occupied, 1,966 renter occupied)
| % of renters here: | 48% |
| State: | 34% |
Housing density: 927 houses/condos per square mile
Median price asked for vacant for-sale houses and condos in 2022 in this county: $735,708.
Median contract rent in 2022: $1,368 (lower quartile is $1,103, upper quartile is $1,820)
Median rent asked for vacant for-rent units in 2022: $1,768
Median gross rent in Glenwood Springs, CO in 2022: $1,476
Housing units in Glenwood Springs with a mortgage: 1,359 (229 second mortgage, 72 home equity loan, 165 both second mortgage and home equity loan)
Houses without a mortgage: 29
Median household income for houses/condos with a mortgage: $110,621
Median household income for apartments without a mortgage: $81,253
Median monthly housing costs: $1,503
Compare current foreclosures near Glenwood Springs, CO:
| Photo | Address | Area | Beds / Baths | Price | Details |
|---|---|---|---|---|---|

|
#1
Fairway Ln
Glenwood Springs, CO 81601
|
3,600 sq. feet
|
2 baths 4 beds |
show details | |

|
#2
County Road 126
Glenwood Springs, CO 81601
|
3,702 sq. feet
|
3 baths 3 beds |
show details | |

|
#3
Cisar Ct Apt G
Glenwood Springs, CO 81601
|
- sq. feet
|
- baths - beds |
show details | |

|
#4
Grand Ave
Glenwood Springs, CO 81601
|
- sq. feet
|
- baths - beds |
show details | |

|
#5
E 1st St
New Castle, CO 81647
|
1,762 sq. feet
|
3 baths 4 beds |
show details | |

|
#6
Apache Dr
New Castle, CO 81647
|
1,820 sq. feet
|
2 baths 3 beds |
show details | |

|
#7
River Boat Dr
New Castle, CO 81647
|
1,504 sq. feet
|
2 baths 3 beds |
show details | |

|
#8
Panorama Dr
Carbondale, CO 81623
|
1,040 sq. feet
|
2 baths 2 beds |
show details | |

|
#9
Cut Throat Loop
Gypsum, CO 81637
|
1,485 sq. feet
|
2 baths 3 beds |
show details | |

|
#10
James Cir
Carbondale, CO 81623
|
1,120 sq. feet
|
2 baths 3 beds |
show details |
| Photo | Address | Area | Beds / Baths | Price | Details |
|---|---|---|---|---|---|

|
#11
Fawn Ct
Silt, CO 81652
|
1,687 sq. feet
|
2 baths 3 beds |
show details | |

|
#12
Foxwood Ln
New Castle, CO 81647
|
- sq. feet
|
- baths - beds |
show details | |

|
#13
County Road 263
New Castle, CO 81647
|
- sq. feet
|
- baths - beds |
show details | |

|
#14
Lincoln Ave
Carbondale, CO 81623
|
- sq. feet
|
- baths - beds |
show details | |

|
#15
Maroon Dr
Carbondale, CO 81623
|
- sq. feet
|
- baths - beds |
show details | |

|
#16
Upper Cattle Creek Rd
Carbondale, CO 81623
|
- sq. feet
|
- baths - beds |
show details | |

|
#17
Highway 6
Silt, CO 81652
|
- sq. feet
|
- baths - beds |
show details | |

|
#18
N 5th St
New Castle, CO 81647
|
- sq. feet
|
- baths - beds |
show details | |

|
Check over 1 million property listings on Foreclosure.com!
|
browse all offers | |||


 | Another "Retire in CO" thread... (235 replies) |
| Glenwood Springs Teacher Relocation (3 replies) |
| Bozeman-like town in CO (27 replies) |
| House in mountains (29 replies) |
| Thoughts on where to home base for a month in CO this summer? (49 replies) |
| Suggestions for vacation home, possible rental (14 replies) |
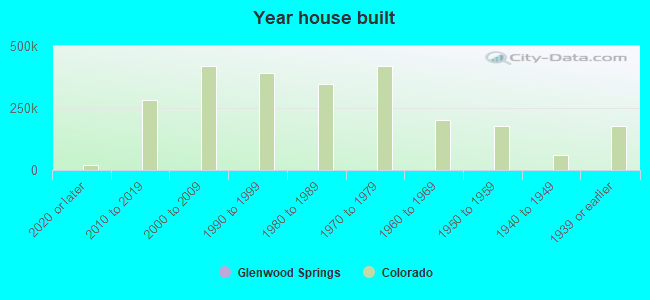
Median year apartment built: 1975
Household type by relationship:
Households: 10,221- Male householders: 1,853 (789 living alone), Female householders: 2,093 (679 living alone)
1,608 spouses (1,600 opposite-sex spouses), 166 unmarried partners, (166 opposite-sex unmarried partners), 2,530 children (2,398 natural, 61 adopted, 70 stepchildren), 121 grandchildren, 134 brothers or sisters, 273 parents, 89 foster children, 357 other relatives, 797 non-relatives
- In group quarters: 194
Size of family households: 991 2-persons, 598 3-persons, 271 4-persons, 137 5-persons, 119 6-persons, 50 7-or-more-persons.
Size of nonfamily households: 1,542 1-person, 261 2-persons, 103 3-persons, 6 4-persons, 24 5-persons.
1,149 married couples with children.
611 single-parent households (275 men, 336 women).
66.3% of residents of Glenwood Springs speak English at home.
30.5% of residents speak Spanish at home (65% speak English very well, 22% speak English well, 8% speak English not well, 5% don't speak English at all).
1.2% of residents speak other Indo-European language at home (92% speak English very well, 8% speak English well).
1.6% of residents speak Asian or Pacific Island language at home (84% speak English very well, 16% speak English well).
0.2% of residents speak other language at home (100% speak English very well).
Foreign born population: 1,779 (17.4%)
(44.7% of them are naturalized citizens)
| Here: | 5.8 |
| State: | 6.8 |
| Here: | 4.2 |
| State: | 4.0 |
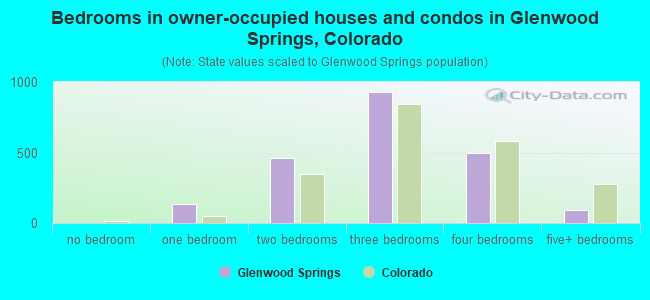
- Bedrooms in owner-occupied houses and condos in Glenwood Springs, Colorado
- 0no bedroom
- 1381 bedroom
- 4612 bedrooms
- 9303 bedrooms
- 4944 bedrooms
- 945+ bedrooms
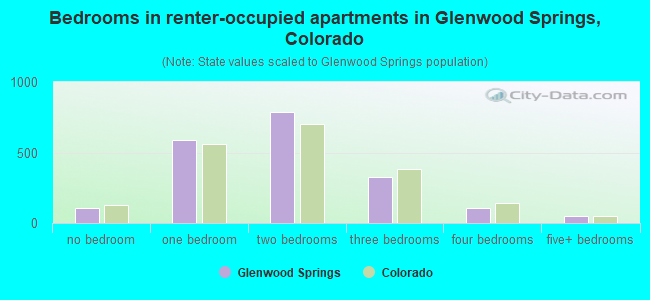
- Bedrooms in renter-occupied apartments in Glenwood Springs, Colorado
- 108no bedroom
- 5881 bedroom
- 7902 bedrooms
- 3293 bedrooms
- 1054 bedrooms
- 475+ bedrooms
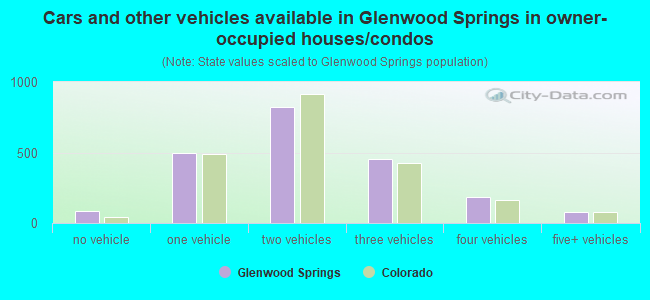
- Cars and other vehicles available in Glenwood Springs in owner-occupied houses/condos
- 86no vehicle
- 4931 vehicle
- 8252 vehicles
- 4543 vehicles
- 1814 vehicles
- 775+ vehicles
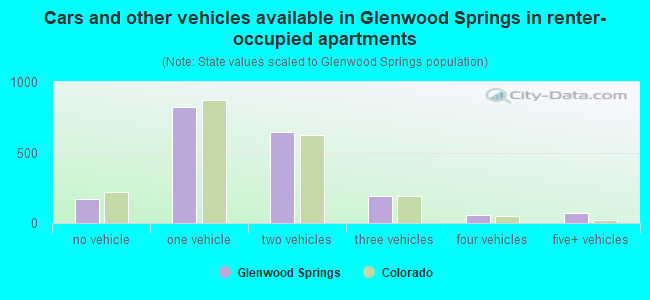
- Cars and other vehicles available in Glenwood Springs in renter-occupied apartments
- 173no vehicle
- 8201 vehicle
- 6482 vehicles
- 1943 vehicles
- 594 vehicles
- 745+ vehicles
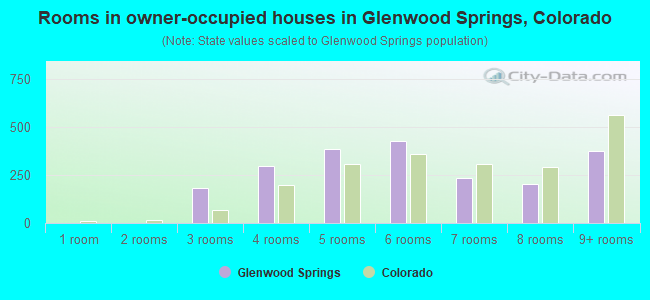
- Rooms in owner-occupied houses in Glenwood Springs, Colorado
- 01 room
- 02 rooms
- 1843 rooms
- 2984 rooms
- 3885 rooms
- 4286 rooms
- 2377 rooms
- 2058 rooms
- 3769+ rooms
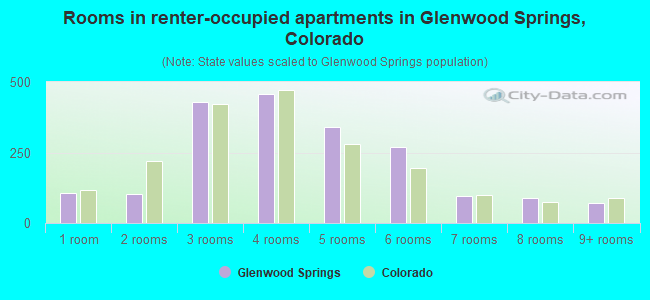
- Rooms in renter-occupied apartments in Glenwood Springs, Colorado
- 1081 room
- 1042 rooms
- 4303 rooms
- 4584 rooms
- 3425 rooms
- 2696 rooms
- 957 rooms
- 908 rooms
- 709+ rooms

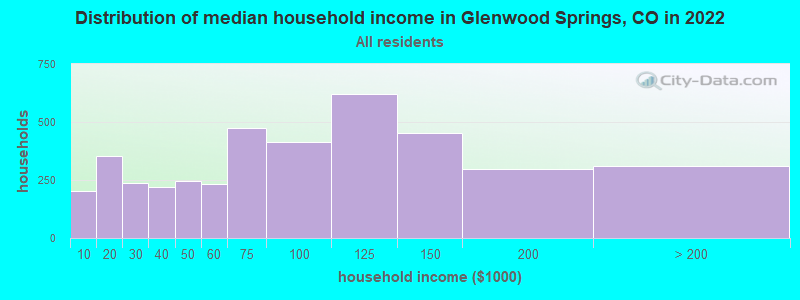
Glenwood Springs, CO household income distribution

- 202Less than $10,000
- 355$10,000 to $19,999
- 237$20,000 to $29,999
- 218$30,000 to $39,999
- 247$40,000 to $49,999
- 233$50,000 to $59,999
- 476$60,000 to $74,999
- 413$75,000 to $99,999
- 622$100,000 to $124,999
- 454$125,000 to $149,999
- 299$150,000 to $199,999
- 311$200,000 or more
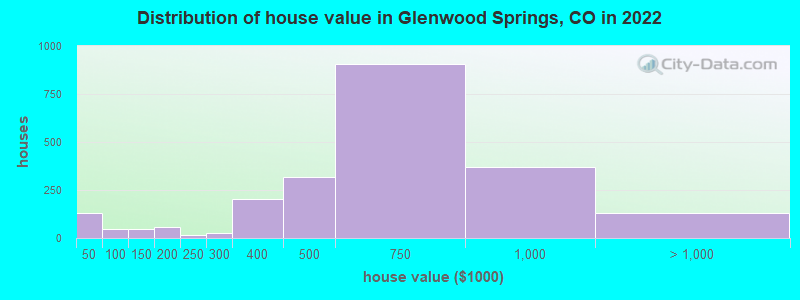
Home value of owner - occupied houses in 2022 in Glenwood Springs, CO
-
- 99Less than $10,000
- 17$15,000 to $19,999
- 11$40,000 to $49,999
- 10$50,000 to $59,999
- 18$60,000 to $69,999
- 8$70,000 to $79,999
- 23$100,000 to $124,999
- 21$125,000 to $149,999
- 47$150,000 to $174,999
- 9$175,000 to $199,999
- 16$200,000 to $249,999
- 24$250,000 to $299,999
- 203$300,000 to $399,999
- 316$400,000 to $499,999
- 903$500,000 to $749,999
- 368$750,000 to $999,999
- 103$1,000,000 to $1,499,999
- 11$1,500,000 to $1,999,999
- 16$2,000,000 or more
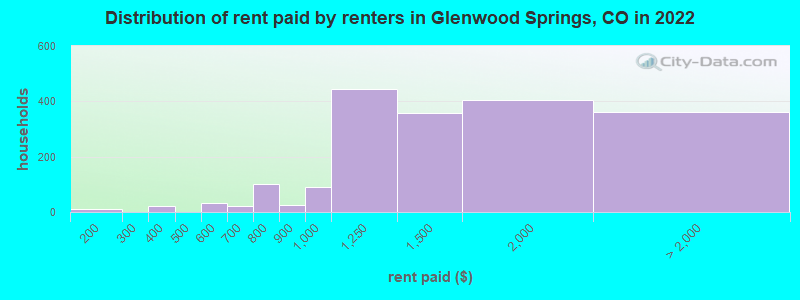
Rent paid by renters in 2022 in Glenwood Springs, CO
-
- 11$150 to $199
- 12$300 to $349
- 8$350 to $399
- 33$550 to $599
- 21$600 to $649
- 68$700 to $749
- 34$750 to $799
- 27$800 to $899
- 90$900 to $999
- 446$1,000 to $1,249
- 356$1,250 to $1,499
- 406$1,500 to $1,999
- 331$2,000 to $2,499
- 29No cash rent
Percentage of workers working in this county: 78.4%
Number of people working at home: 607 (9.9% of all workers)
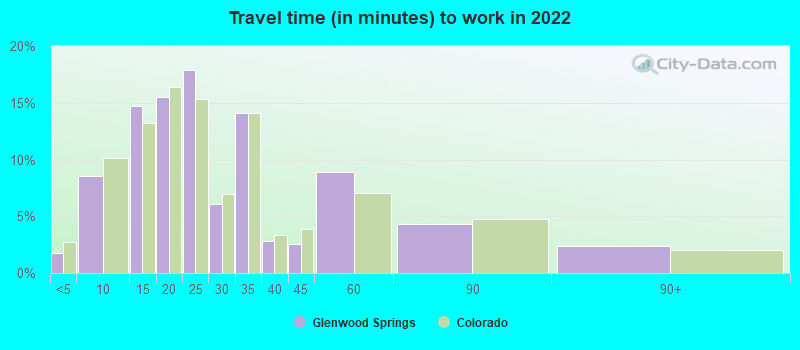
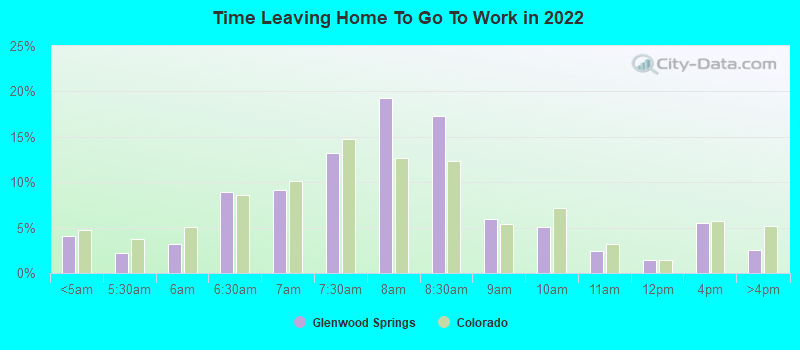
Travel time to work (commute)
- Less than 5 minutes: 181
- 5 to 9 minutes: 714
- 10 to 14 minutes: 1,080
- 15 to 19 minutes: 638
- 20 to 24 minutes: 348
- 25 to 29 minutes: 396
- 30 to 34 minutes: 562
- 35 to 39 minutes: 64
- 40 to 44 minutes: 112
- 45 to 59 minutes: 416
- 60 to 89 minutes: 675
- 90 or more minutes: 118
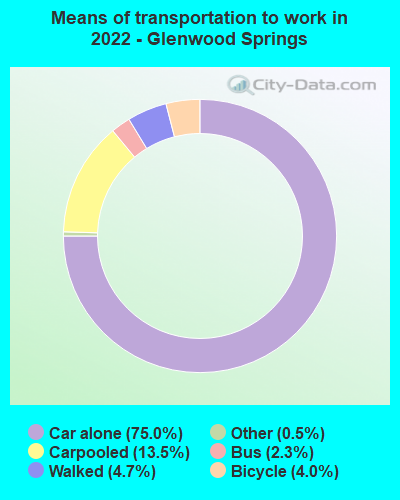
Means of transportation to work:
- Drove a car alone: 8,300 (67.9%)
- Carpooled: 1,559 (12.8%)
- Bus: 188 (1.5%)
- Taxi: 55 (0.5%)
- Bicycle: 459 (3.8%)
- Walked: 537 (4.4%)
- Worked at home: 607 (5.0%)
- Unemployment by race in 2022
- Unemployment rate for White non-Hispanic residents
- 1.1%Males
- 4.1%Females
- Unemployment rate for other race residents
- 8.5%Females
- Unemployment rate for two or more race residents
- 2.5%Males
- 2.1%Females
- Unemployment rate for Hispanic or Latino residents
- 0.9%Males
- 4.5%Females
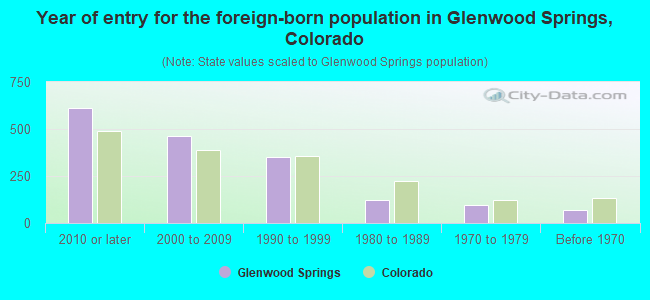
- Year of entry for the foreign-born population in Glenwood Springs, Colorado
- 6122010 or later
- 4612000 to 2009
- 3511990 to 1999
- 1241980 to 1989
- 951970 to 1979
- 70Before 1970
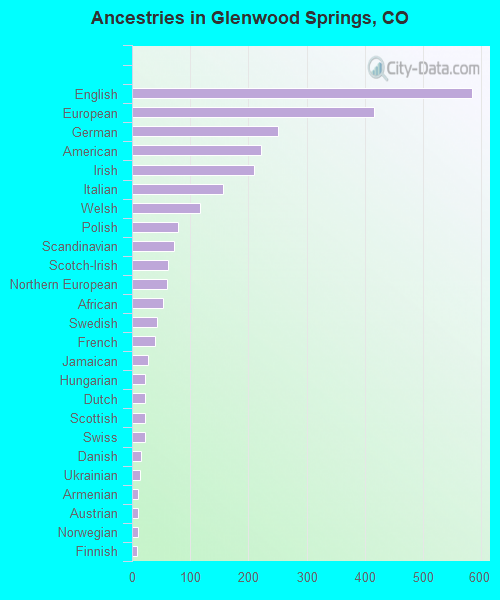
First ancestries reported:
- English: 584 (11.3%)
- European: 415 (8.1%)
- German: 250 (4.9%)
- American: 221 (4.3%)
- Irish: 210 (4.1%)
- Italian: 157 (3.0%)
- Welsh: 116 (2.3%)
- Polish: 79 (1.5%)
- Scandinavian: 73 (1.4%)
- Scotch-Irish: 62 (1.2%)
- Northern European: 60 (1.2%)
- African: 54 (1.0%)
- Swedish: 43 (0.8%)
- French: 40 (0.8%)
- Jamaican: 28 (0.5%)
- Hungarian: 23 (0.4%)
- Dutch: 22 (0.4%)
- Scottish: 22 (0.4%)
- Swiss: 22 (0.4%)
- Danish: 15 (0.3%)
- Ukrainian: 14 (0.3%)
- Armenian: 10 (0.2%)
- Austrian: 10 (0.2%)
- Norwegian: 10 (0.2%)
- Finnish: 8 (0.2%)
- French Canadian: 8 (0.2%)
Most common places of birth for foreign-born residents (%):
| Glenwood Springs: | 53.3% (949) |
| Colorado: | 38.3% (209,491) |
| Glenwood Springs: | 14.6% (260) |
| Colorado: | 2.2% (12,150) |
| Glenwood Springs: | 8.9% (159) |
| Colorado: | 1.1% (5,971) |
| Glenwood Springs: | 4.9% (88) |
| Colorado: | 0.7% (3,563) |
| Glenwood Springs: | 3.2% (57) |
| Colorado: | 0.9% (4,810) |
| Glenwood Springs: | 1.5% (27) |
| Colorado: | 1.1% (6,142) |
Place of birth for U.S.-born residents:
- This state: 3,444
- Other state: 4,735
- Northeast: 671
- Midwest: 1,344
- South: 1,096
- West: 1,622
86.3% of Glenwood Springs residents lived in the same house 1 years ago.
Out of people who lived in different houses, 33.2% lived in this county.
Out of people who lived in different counties, 67.0% lived in Colorado.
| Glenwood Springs: | 86.3% |
| State average: | 83.6% |
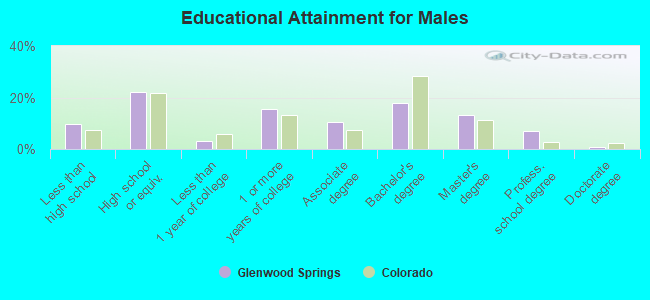
Education attainment for males 25 years and older:
- No schooling: 92
- Nursery to 4th grade: 26
- 5th and 6th grade: 41
- 7th and 8th grade: 85
- 9th grade: 81
- 10th grade: 13
- 11th grade: 4
- 12th grade, no diploma: 16
- High school graduate (or equivalency): 833
- Less than 1 year of college: 120
- Some college more than 1 year, no degree: 589
- Associate degree: 392
- Bachelor's degree: 668
- Master's degree: 500
- Professional school degree: 257
- Doctorate degree: 35
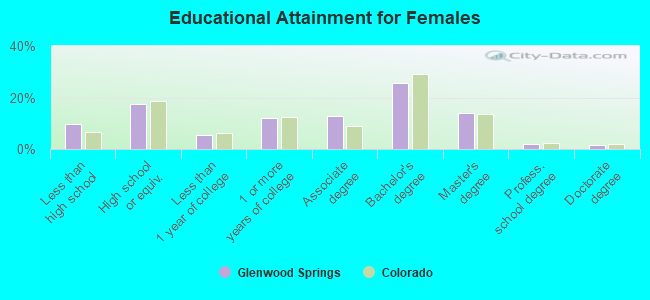
Education attainment for females 25 years and older:
- No schooling: 65
- Nursery to 4th grade: 8
- 5th and 6th grade: 47
- 7th and 8th grade: 48
- 9th grade: 30
- 10th grade: 34
- 11th grade: 41
- 12th grade, no diploma: 48
- High school graduate (or equivalency): 579
- Less than 1 year of college: 183
- Some college more than 1 year, no degree: 396
- Associate degree: 423
- Bachelor's degree: 859
- Master's degree: 465
- Professional school degree: 67
- Doctorate degree: 48
Housing units in structures:
- One, detached: 1,967
- One, attached: 454
- Two: 299
- 3 or 4: 308
- 5 to 9: 453
- 10 to 19: 227
- 20 to 49: 272
- 50 or more: 168
- Mobile homes: 296
Housing units lacking complete kitchen facilities in 2022: 1.8%
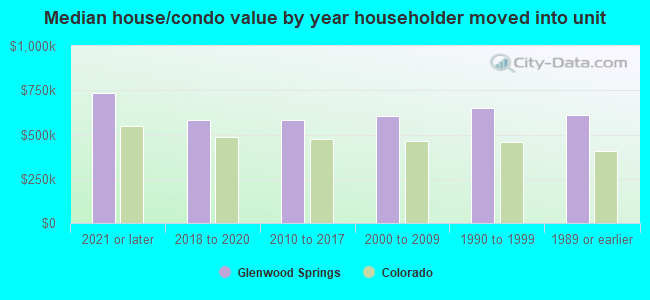
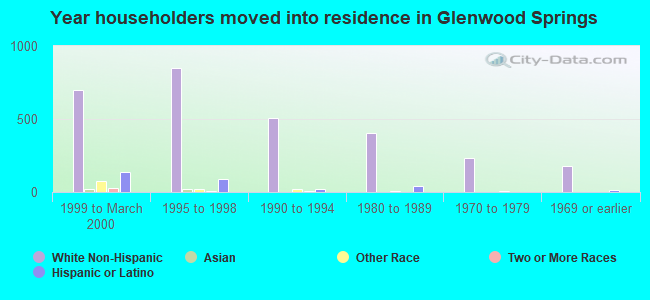
House/condo owner moved in on average 9 years ago
Renter moved in on average 6 years ago
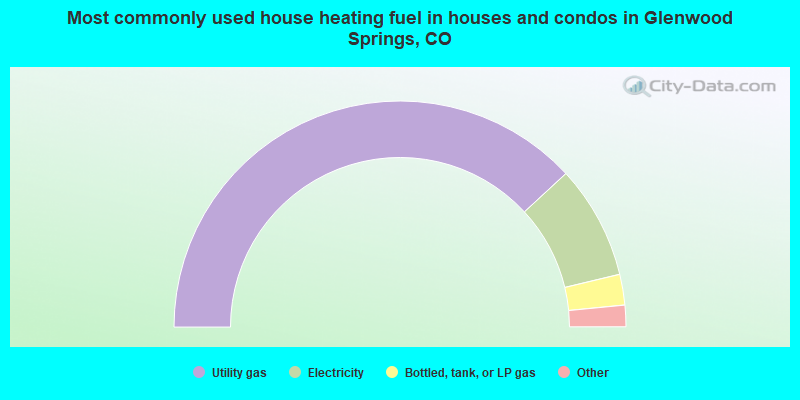
- 76.4%Utility gas
- 16.3%Electricity
- 4.4%Bottled, tank, or LP gas
- 1.4%Wood
- 1.2%Solar energy
- 0.3%Other fuel
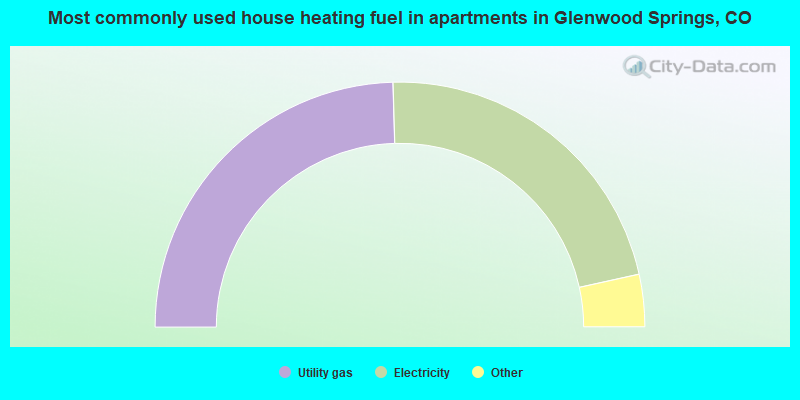
- 49.1%Utility gas
- 44.0%Electricity
- 3.8%Wood
- 1.2%Bottled, tank, or LP gas
- 1.2%No fuel used
- 0.6%Solar energy
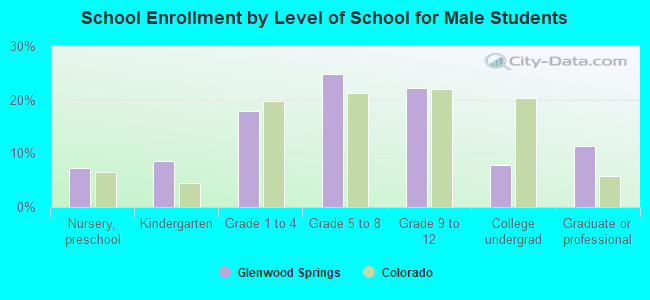
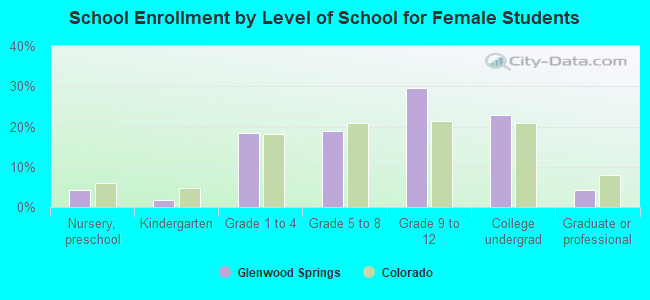
Private vs. public school enrollment:
| Here: | 27.6% |
| Colorado: | 11.4% |
| Here: | 2.0% |
| Colorado: | 8.5% |
| Here: | 6.2% |
| Colorado: | 14.0% |