Glenville, NY (New York) Houses and Residents
| Glenville: | $242,011 |
| New York: | $400,400 |
Total population: 29,480 (Urban population: 24,610, Rural population: 3,451 (all nonfarm))
Houses: 11,547 (11,121 occupied: 8,912 owner occupied, 2,209 renter occupied)
| % of renters here: | 20% |
| State: | 46% |
Housing density: 231 houses/condos per square mile
Median price asked for vacant for-sale houses and condos in 2022 in this county: $378,269.
Median contract rent in 2022: $1,026 (lower quartile is $853, upper quartile is $1,334)
Median rent asked for vacant for-rent units in 2022: $811
Median gross rent in Glenville, NY in 2022: $1,218
Housing units in Glenville with a mortgage: 5,226 (333 second mortgage, 735 home equity loan, 20 both second mortgage and home equity loan)
Houses without a mortgage: 2,766
Compare current foreclosures near Glenville, NY:
| Photo | Address | Area | Beds / Baths | Price | Details |
|---|---|---|---|---|---|

|
#1
Lark St
Altamont, NY 12009
|
2,045 sq. feet
|
2 baths 3 beds |
$189,000
|
show details |

|
#2
River St
Troy, NY 12180
|
2,112 sq. feet
|
2 baths 6 beds |
$33,250
|
show details |

|
#3
Wilkins Ave
Albany, NY 12205
|
638 sq. feet
|
1 baths 2 beds |
$189,900
|
show details |

|
#4
N Allen St
Albany, NY 12206
|
2,464 sq. feet
|
2 baths 6 beds |
$74,900
|
show details |

|
#5
Brookview Ter
Slingerlands, NY 12159
|
1,574 sq. feet
|
2 baths 2 beds |
show details | |

|
#6
Mann Avenue & 12 Elm Street
Cohoes, NY 12047
|
1,864 sq. feet
|
2 baths 4 beds |
show details | |

|
#7
Western Tpke
Altamont, NY 12009
|
2,019 sq. feet
|
3 baths 5 beds |
show details | |

|
#8
Generals Way
Clifton Park, NY 12065
|
1,080 sq. feet
|
1 baths 2 beds |
show details | |

|
#9
Generals Way
Clifton Park, NY 12065
|
1,059 sq. feet
|
1 baths 2 beds |
show details | |

|
#10
Adams Rd
Schenectady, NY 12308
|
2,480 sq. feet
|
3 baths 4 beds |
show details |
| Photo | Address | Area | Beds / Baths | Price | Details |
|---|---|---|---|---|---|

|
#11
Swift Rd
Voorheesville, NY 12186
|
4,905 sq. feet
|
3 baths 5 beds |
show details | |

|
#12
George St
Troy, NY 12183
|
2,200 sq. feet
|
2 baths 6 beds |
show details | |

|
#13
4th Ave
Troy, NY 12182
|
872 sq. feet
|
1 baths 3 beds |
show details | |

|
#14
New Turnpike Rd
Troy, NY 12182
|
981 sq. feet
|
1 baths 3 beds |
show details | |

|
#15
Crescent Ave
Amsterdam, NY 12010
|
1,386 sq. feet
|
2 baths 5 beds |
show details | |

|
#16
Cambridge Ct
Clifton Park, NY 12065
|
1,924 sq. feet
|
1 baths 3 beds |
show details | |

|
#17
Redfield Park
Clifton Park, NY 12065
|
2,573 sq. feet
|
2 baths 4 beds |
show details | |

|
#18
Hudson St
Waterford, NY 12188
|
1,764 sq. feet
|
2 baths 4 beds |
show details | |

|
#19
Lawrence St
Waterford, NY 12188
|
2,200 sq. feet
|
1 baths 2 beds |
show details | |

|
#20
Lincoln Ave
Cohoes, NY 12047
|
2,200 sq. feet
|
2 baths 4 beds |
show details |
| Photo | Address | Area | Beds / Baths | Price | Details |
|---|---|---|---|---|---|

|
#21
Parker Rd
Schenectady, NY 12304
|
1,645 sq. feet
|
1 baths 3 beds |
show details | |

|
#22
Outer Dr
Schenectady, NY 12303
|
1,404 sq. feet
|
1 baths 3 beds |
show details | |

|
#23
Nys Rt 29
Middle Grove, NY 12850
|
962 sq. feet
|
1 baths 3 beds |
show details | |

|
#24
Ray Ave
Schenectady, NY 12304
|
1,780 sq. feet
|
2 baths 3 beds |
show details | |

|
#25
Stone Church Rd
Ballston Spa, NY 12020
|
- sq. feet
|
2 baths 4 beds |
show details | |

|
#26
Fiero Ave
Schenectady, NY 12303
|
1,598 sq. feet
|
2 baths 3 beds |
show details | |

|
#27
Arcadia Ct
Albany, NY 12205
|
1,692 sq. feet
|
1 baths 4 beds |
show details | |

|
#28
Conqua Ln
Schenectady, NY 12306
|
1,760 sq. feet
|
2 baths 3 beds |
show details | |

|
#29
Everett Rd
Albany, NY 12205
|
1,428 sq. feet
|
2 baths 3 beds |
show details | |

|
#30
Vliet Blvd
Cohoes, NY 12047
|
2,550 sq. feet
|
2 baths 6 beds |
show details |
| Photo | Address | Area | Beds / Baths | Price | Details |
|---|---|---|---|---|---|

|
#31
Crescent Rd
Clifton Park, NY 12065
|
768 sq. feet
|
1 baths 3 beds |
show details | |

|
#32
Fuller Ter
Albany, NY 12205
|
775 sq. feet
|
2 baths 2 beds |
show details | |

|
#33
New Scotland Rd
Voorheesville, NY 12186
|
2,319 sq. feet
|
2 baths 4 beds |
show details | |

|
#34
Sacandaga Rd
Schenectady, NY 12302
|
1,272 sq. feet
|
1 baths 3 beds |
show details | |

|
#35
11th St
Troy, NY 12180
|
1,850 sq. feet
|
2 baths 3 beds |
show details | |

|
#36
Chester Ct
Troy, NY 12182
|
2,974 sq. feet
|
1 baths 4 beds |
show details | |

|
#37
Park Dr
Albany, NY 12204
|
3,266 sq. feet
|
2 baths 4 beds |
show details | |

|
#38
Carriage Way
Ballston Spa, NY 12020
|
1,574 sq. feet
|
1 baths 3 beds |
show details | |

|
#39
Ziemke Farm Ln
Cohoes, NY 12047
|
1,482 sq. feet
|
1 baths 3 beds |
show details | |

|
#40
Anthony Rd
Clifton Park, NY 12065
|
1,588 sq. feet
|
2 baths 3 beds |
show details |
| Photo | Address | Area | Beds / Baths | Price | Details |
|---|---|---|---|---|---|

|
#41
Sacandaga Rd
Galway, NY 12074
|
1,280 sq. feet
|
1 baths 4 beds |
show details | |

|
#42
Woodthrush Ct
Ballston Spa, NY 12020
|
1,292 sq. feet
|
2 baths 3 beds |
show details | |

|
#43
Ridgefield Dr
Voorheesville, NY 12186
|
1,745 sq. feet
|
2 baths 3 beds |
show details | |

|
#44
Vliet Blvd
Cohoes, NY 12047
|
2,392 sq. feet
|
2 baths 4 beds |
show details | |

|
#45
Sand Creek Rd # B
Albany, NY 12205
|
2,392 sq. feet
|
3 baths 6 beds |
show details | |

|
#46
Jeffrey Ln
Albany, NY 12211
|
1,326 sq. feet
|
1 baths 4 beds |
show details | |

|
#47
Woodridge Cir
Clifton Park, NY 12065
|
2,738 sq. feet
|
3 baths 6 beds |
show details | |

|
#48
Hunters Run Blvd
Cohoes, NY 12047
|
2,486 sq. feet
|
2 baths 4 beds |
show details | |

|
#49
N 2nd St
Cohoes, NY 12047
|
960 sq. feet
|
1 baths 3 beds |
show details | |

|
Check over 1 million property listings on Foreclosure.com!
|
browse all offers | |||
Latest news about housing in Glenville, NY collected exclusively by city-data.com from local newspapers, TV, and radio stations

 | Inno has arrived in Albany. Here's what to expect... (104 replies) |
| Best Town On My List? (Schenectady / Capital District Area) (4 replies) |
| Nevada to NY (10 replies) |
| Relocating to Albany area. Scotia/Glenville or is there something better? (11 replies) |
| moving to Albany Area from Boston (10 replies) |
| Which City Would you move to and Why? (18 replies) |

Household type by relationship:
Households: 150,293- In family households: 121,433 (25,255 male householders, 14,072 female householders)
27,748 spouses, 44,019 children (41,216 natural, 1,014 adopted, 1,789 stepchildren), 2,264 grandchildren, 1,144 brothers or sisters, 1,263 parents, foster children, 1,275 other relatives, 3,690 non-relatives
- In nonfamily households: 28,860 (10,745 male householders (8,311 living alone)), 12,814 female householders (10,920 living alone)), 5,301 nonrelatives
- In group quarters: 4,434 (1,369 institutionalized population)
22,896 married couples with children.
10,154 single-parent households (2,029 men, 8,125 women).
93.6% of residents of Glenville speak English at home.
1.2% of residents speak Spanish at home (78% speak English very well, 7% speak English well, 15% speak English not well).
4.6% of residents speak other Indo-European language at home (81% speak English very well, 15% speak English well, 4% speak English not well).
0.4% of residents speak Asian or Pacific Island language at home (66% speak English very well, 19% speak English well, 15% speak English not well).
0.2% of residents speak other language at home (100% speak English very well).
Foreign born population: 1,800 (5.9%)
(81.6% of them are naturalized citizens)
| Here: | 6.7 |
| State: | 6.3 |
| Here: | 4.1 |
| State: | 3.8 |

- Bedrooms in owner-occupied houses and condos in Glenville, New York
- 13no bedroom
- 1541 bedroom
- 1,3332 bedrooms
- 4,1303 bedrooms
- 2,8424 bedrooms
- 4405+ bedrooms

- Bedrooms in renter-occupied apartments in Glenville, New York
- 42no bedroom
- 7891 bedroom
- 9382 bedrooms
- 3153 bedrooms
- 1094 bedrooms
- 165+ bedrooms

- Cars and other vehicles available in Glenville in owner-occupied houses/condos
- 200no vehicle
- 2,3971 vehicle
- 4,4772 vehicles
- 1,4093 vehicles
- 3574 vehicles
- 725+ vehicles

- Cars and other vehicles available in Glenville in renter-occupied apartments
- 348no vehicle
- 1,2441 vehicle
- 5372 vehicles
- 523 vehicles
- 284 vehicles
- 05+ vehicles

- Rooms in owner-occupied houses in Glenville, New York
- 51 room
- 222 rooms
- 1263 rooms
- 4014 rooms
- 1,2395 rooms
- 2,1046 rooms
- 2,1257 rooms
- 1,7638 rooms
- 1,1279+ rooms

- Rooms in renter-occupied apartments in Glenville, New York
- 291 room
- 1172 rooms
- 5113 rooms
- 5374 rooms
- 5575 rooms
- 2936 rooms
- 1387 rooms
- 218 rooms
- 69+ rooms


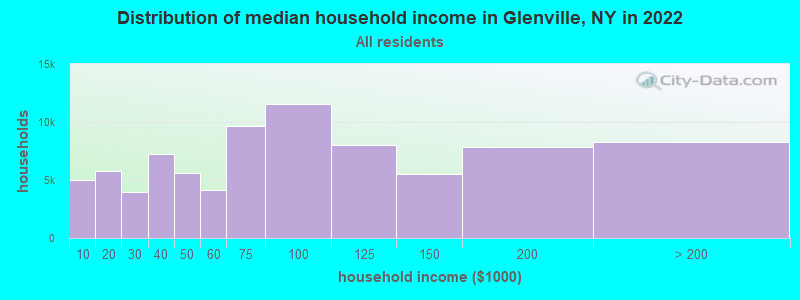
Glenville, NY household income distribution

- 5,019Less than $10,000
- 5,747$10,000 to $19,999
- 3,969$20,000 to $29,999
- 7,231$30,000 to $39,999
- 5,590$40,000 to $49,999
- 4,146$50,000 to $59,999
- 9,668$60,000 to $74,999
- 11,578$75,000 to $99,999
- 8,039$100,000 to $124,999
- 5,477$125,000 to $149,999
- 7,811$150,000 to $199,999
- 8,236$200,000 or more
Percentage of workers working in this county: 59.9%
Number of people working at home: 2,057 (13.3% of all workers)
Travel time to work (commute)
- Less than 5 minutes: 397
- 5 to 9 minutes: 1,386
- 10 to 14 minutes: 2,224
- 15 to 19 minutes: 2,031
- 20 to 24 minutes: 1,931
- 25 to 29 minutes: 762
- 30 to 34 minutes: 1,860
- 35 to 39 minutes: 442
- 40 to 44 minutes: 551
- 45 to 59 minutes: 814
- 60 to 89 minutes: 252
- 90 or more minutes: 198
Means of transportation to work:
- Drove a car alone: 11,722 (88.3%)
- Carpooled: 782 (5.9%)
- Bus or trolley bus: 118 (0.9%)
- Taxi: 8 (0.1%)
- Motorcycle: 10 (0.1%)
- Bicycle: 16 (0.1%)
- Walked: 168 (1.3%)
- Other means: 24 (0.2%)
- Worked at home: 420 (3.2%)


- Year of entry for the foreign-born population in Glenville, New York
- 611995 to March 2000
- 491990 to 1994
- 691985 to 1989
- 541980 to 1984
- 611975 to 1979
- 371970 to 1974
- 1251965 to 1969
- 361Before 1965

First ancestries reported:
- Irish: 5,877 (16.1%)
- German: 5,752 (15.7%)
- Italian: 5,286 (14.5%)
- English: 4,127 (11.3%)
- Polish: 2,860 (7.8%)
- Other: 2,368 (6.5%)
- French: 2,277 (6.2%)
- Dutch: 1,412 (3.9%)
- Scottish: 1,050 (2.9%)
- United States: 988 (2.7%)
- Scotch-Irish: 707 (1.9%)
- French Canadian: 671 (1.8%)
- Czech: 513 (1.4%)
- Swedish: 420 (1.1%)
- Welsh: 285 (0.8%)
- Lithuanian: 265 (0.7%)
- Danish: 247 (0.7%)
- Norwegian: 246 (0.7%)
- Russian: 237 (0.6%)
- Hungarian: 234 (0.6%)
- Greek: 153 (0.4%)
- Ukrainian: 151 (0.4%)
- Slovak: 143 (0.4%)
- Swiss: 129 (0.4%)
- Portuguese: 56 (0.2%)
- Arab: 42 (0.1%)
- Subsaharan African: 24 (0.07%)
- West Indian: 16 (0.04%)
Most common places of birth for foreign-born residents (%):
| Glenville: | 15.9% (130) |
| New York: | 3.8% (147,729) |
| Glenville: | 11.3% (92) |
| New York: | 1.4% (54,876) |
| Glenville: | 10.4% (85) |
| New York: | 1.8% (69,327) |
| Glenville: | 6.9% (56) |
| New York: | 1.6% (62,237) |
| Glenville: | 6.2% (51) |
| New York: | 6.0% (233,766) |
| Glenville: | 3.9% (32) |
| New York: | 2.9% (111,727) |
| Glenville: | 3.7% (30) |
| New York: | 1.9% (72,408) |
| Glenville: | 3.5% (29) |
| New York: | 0.9% (36,642) |
| Glenville: | 3.4% (28) |
| New York: | 1.3% (51,055) |
| Glenville: | 2.8% (23) |
| New York: | 0.4% (17,401) |
| Glenville: | 2.4% (20) |
| New York: | 0.6% (22,265) |
| Glenville: | 2.3% (19) |
| New York: | 0.8% (32,034) |
| Glenville: | 2.1% (17) |
| New York: | 0.5% (20,310) |
| Glenville: | 2.1% (17) |
| New York: | 0.3% (13,508) |
| Glenville: | 2.0% (16) |
| New York: | 3.2% (125,475) |
| Glenville: | 1.8% (15) |
| New York: | 1.1% (41,934) |
| Glenville: | 1.6% (13) |
| New York: | 0.2% (6,226) |
Place of birth for U.S.-born residents:
- This state: 22,989
- Other state: 4,112
- Northeast: 2,243
- Midwest: 804
- South: 854
- West: 211
70% of Glenville residents lived in the same house 5 years ago.
Out of people who lived in different houses, 63% lived in this county.
Out of people who lived in different counties, 68% lived in New York.
Education attainment for males 25 years and older:
- No schooling: 94
- Nursery to 4th grade: 62
- 5th and 6th grade: 22
- 7th and 8th grade: 105
- 9th grade: 66
- 10th grade: 126
- 11th grade: 144
- 12th grade, no diploma: 262
- High school graduate (or equivalency): 2,244
- Less than 1 year of college: 649
- Some college more than 1 year, no degree: 1,067
- Associate degree: 978
- Bachelor's degree: 1,921
- Master's degree: 1,045
- Professional school degree: 194
- Doctorate degree: 243

Education attainment for females 25 years and older:
- No schooling: 57
- Nursery to 4th grade: 25
- 5th and 6th grade: 41
- 7th and 8th grade: 119
- 9th grade: 97
- 10th grade: 224
- 11th grade: 174
- 12th grade, no diploma: 374
- High school graduate (or equivalency): 3,480
- Less than 1 year of college: 751
- Some college more than 1 year, no degree: 1,302
- Associate degree: 1,301
- Bachelor's degree: 1,624
- Master's degree: 1,155
- Professional school degree: 149
- Doctorate degree: 25


Housing units in structures:
- One, detached: 8,997
- One, attached: 197
- Two: 639
- 3 or 4: 475
- 5 to 9: 427
- 10 to 19: 414
- 20 to 49: 43
- 50 or more: 152
- Mobile homes: 198
- Boats, RVs, vans, etc.: 5
Median worth of mobile homes: $5,483
Housing units lacking complete kitchen facilities: 0.3%

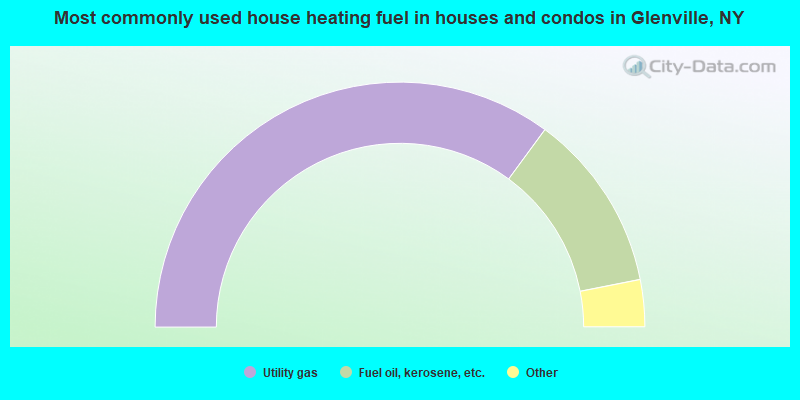
- 70.1%Utility gas
- 23.6%Fuel oil, kerosene, etc.
- 3.0%Electricity
- 1.9%Bottled, tank, or LP gas
- 1.2%Wood
- 0.1%Other fuel
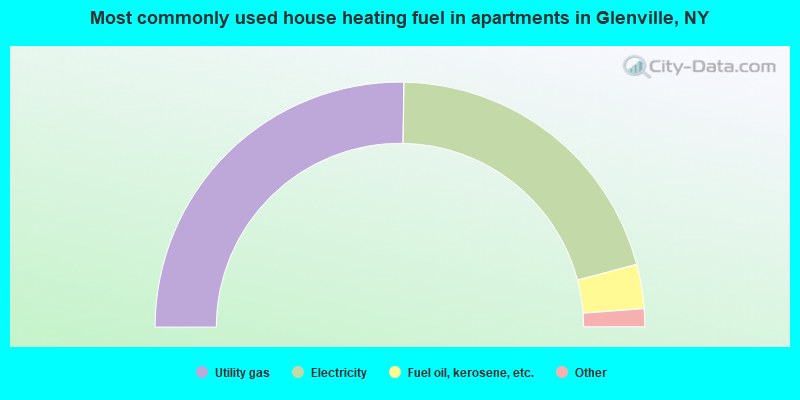
- 50.5%Utility gas
- 41.2%Electricity
- 5.8%Fuel oil, kerosene, etc.
- 1.9%Bottled, tank, or LP gas
- 0.3%Wood
- 0.2%No fuel used
Private vs. public school enrollment:
| Here: | 6.6% |
| New York: | 14.0% |
| Here: | 4.2% |
| New York: | 13.2% |
| Here: | 32.8% |
| New York: | 38.2% |


