Housing density: 1,668 houses/condos per square mile
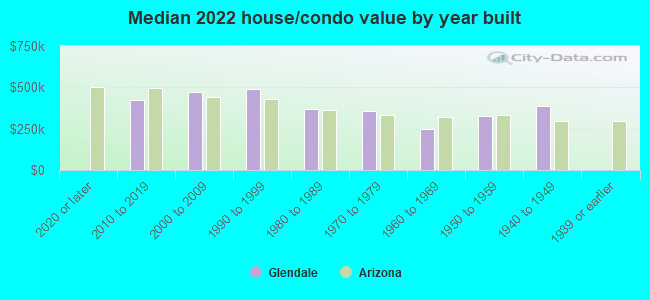
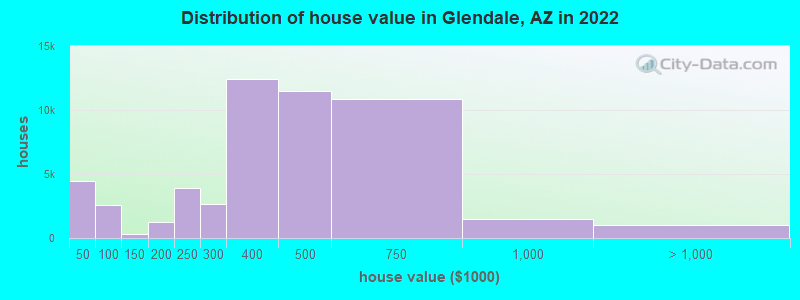
Median price asked for vacant for-sale houses and condos in 2022: $584,758.
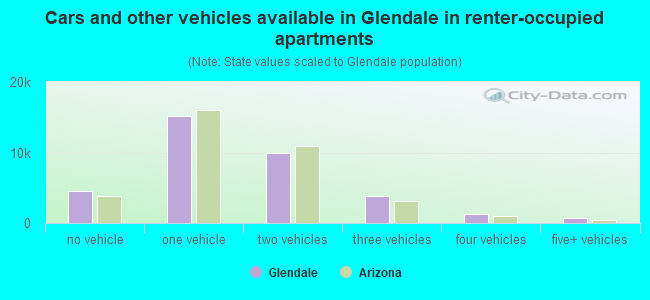
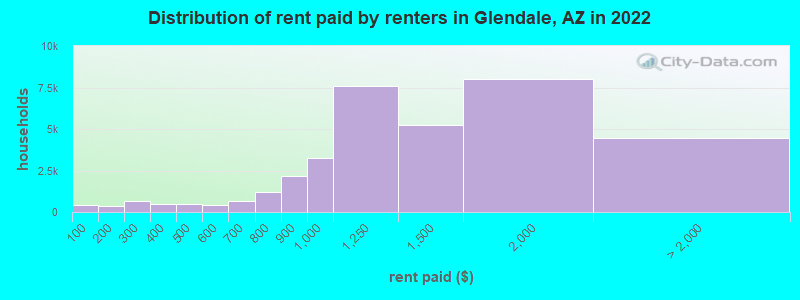
Median contract rent in 2022: $1,244 (lower quartile is $960, upper quartile is $1,707)
Median rent asked for vacant for-rent units in 2022: $1,428
Median gross rent in Glendale, AZ in 2022: $1,412
Housing units in Glendale with a mortgage: 34,443 (1,956 second mortgage, 0 home equity loan, 1,377 both second mortgage and home equity loan) Houses without a mortgage: 678
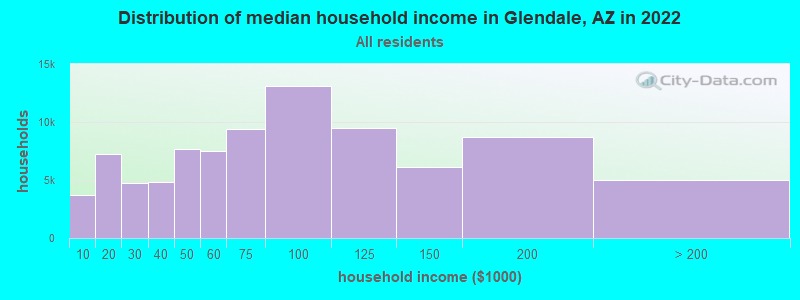
Median household income for houses/condos with a mortgage: $98,508
Median household income for apartments without a mortgage: $86,123
31,652 married couples with children.
14,007 single-parent households (3,521 men, 10,486 women).
62.2% of residents of Glendale speak English at home.
30.4% of residents speak Spanish at home (65% speak English very well, 13% speak English well, 14% speak English not well, 9% don't speak English at all).
2.8% of residents speak other Indo-European language at home (80% speak English very well, 7% speak English well, 10% speak English not well, 3% don't speak English at all).
2.5% of residents speak Asian or Pacific Island language at home (62% speak English very well, 21% speak English well, 7% speak English not well, 9% don't speak English at all).
2.2% of residents speak other language at home (79% speak English very well, 17% speak English well, 4% speak English not well).
Foreign born population: 46,527 (18.5%)
(42.3% of them are naturalized citizens)
Percentage of workers working in this county: 98.8% Number of people working at home: 22,242 (17.7% of all workers)
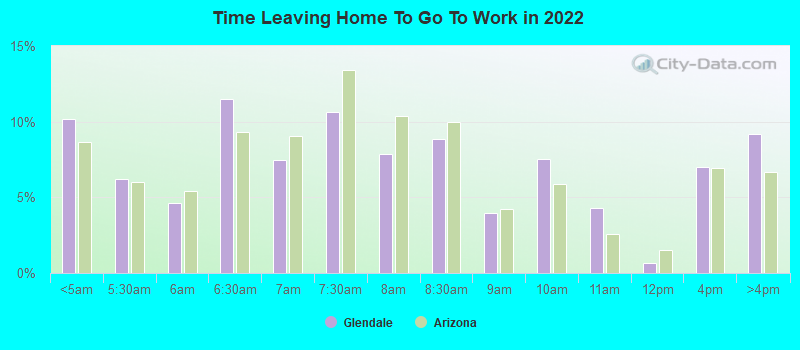
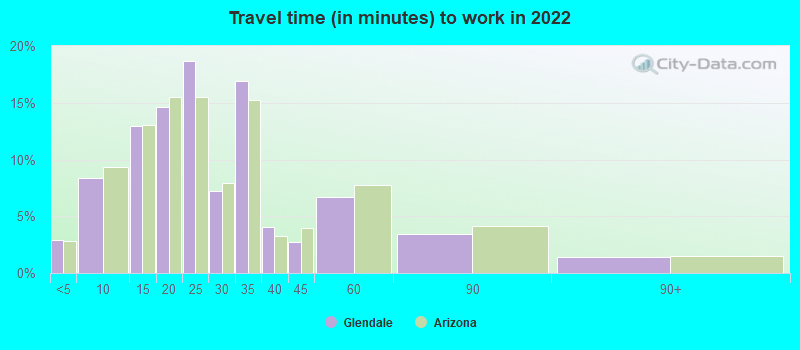
Travel time to work (commute)
Less than 5 minutes: 2,209
5 to 9 minutes: 7,540
10 to 14 minutes: 11,968
15 to 19 minutes: 10,418
20 to 24 minutes: 17,323
25 to 29 minutes: 8,693
30 to 34 minutes: 21,036
35 to 39 minutes: 3,363
40 to 44 minutes: 5,231
45 to 59 minutes: 8,078
60 to 89 minutes: 5,193
90 or more minutes: 2,418
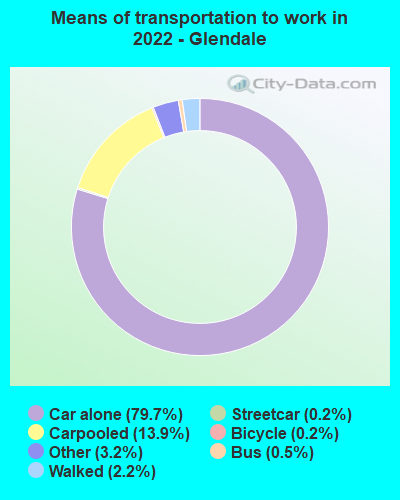
Means of transportation to work:
Drove a car alone: 62,098 (62.0%)
Carpooled: 10,846 (10.8%)
Bus: 374 (0.4%)
Subway or elevated rail: 125 (0.1%)
Taxi: 2,523 (2.5%)
Bicycle: 183 (0.2%)
Walked: 1,725 (1.7%)
Worked at home: 22,242 (22.2%)
Unemployment by race in 2022
Unemployment rate for White non-Hispanic residents
3.9%Males
4.8%Females
Unemployment rate for Black residents
7.8%Males
4.0%Females
Unemployment rate for American Indian and Alaska Native residents
15.9%Males
0.8%Females
Unemployment rate for Asian residents
3.3%Males
3.9%Females
Unemployment rate for other race residents
5.2%Males
8.3%Females
Unemployment rate for two or more race residents
2.9%Males
6.9%Females
Unemployment rate for Hispanic or Latino residents
1.8%Males
6.6%Females
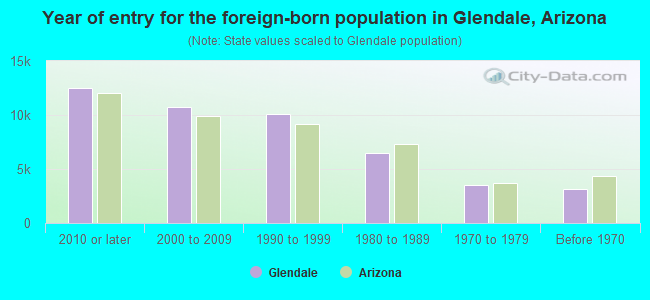
Year of entry for the foreign-born population in Glendale, Arizona
12,4882010 or later
10,7092000 to 2009
10,1311990 to 1999
6,4661980 to 1989
3,5511970 to 1979
3,144Before 1970
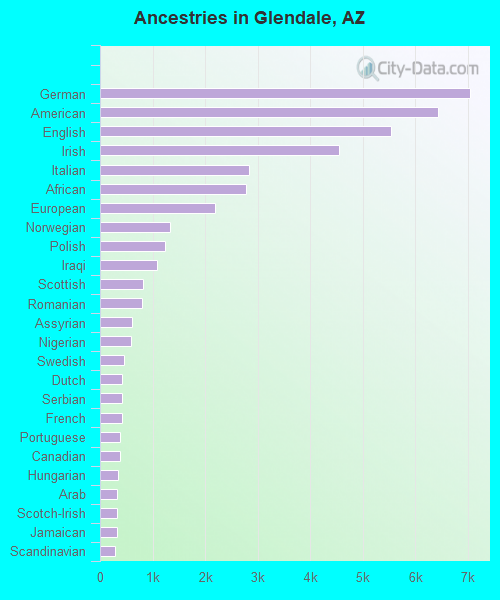
First ancestries reported:
German: 7,050 (5.1%)
American: 6,425 (4.7%)
English: 5,532 (4.0%)
Irish: 4,547 (3.3%)
Italian: 2,830 (2.1%)
African: 2,781 (2.0%)
European: 2,197 (1.6%)
Norwegian: 1,324 (1.0%)
Polish: 1,237 (0.9%)
Iraqi: 1,082 (0.8%)
Scottish: 812 (0.6%)
Romanian: 794 (0.6%)
Assyrian: 611 (0.4%)
Nigerian: 591 (0.4%)
Swedish: 449 (0.3%)
Dutch: 416 (0.3%)
Serbian: 415 (0.3%)
French: 410 (0.3%)
Portuguese: 386 (0.3%)
Canadian: 376 (0.3%)
Hungarian: 347 (0.3%)
Arab: 326 (0.2%)
Scotch-Irish: 322 (0.2%)
Jamaican: 319 (0.2%)
Scandinavian: 291 (0.2%)
British: 283 (0.2%)
Ukrainian: 221 (0.2%)
Welsh: 214 (0.2%)
Danish: 213 (0.2%)
Lebanese: 205 (0.1%)
West Indian: 197 (0.1%)
Russian: 182 (0.1%)
Moroccan: 178 (0.1%)
Afghan: 177 (0.1%)
Iranian: 173 (0.1%)
French Canadian: 162 (0.1%)
Northern European: 160 (0.1%)
Icelander: 150 (0.1%)
Sudanese: 132 (0.10%)
Kenyan: 131 (0.10%)
Yugoslavian: 130 (0.09%)
Jordanian: 128 (0.09%)
Eastern European: 118 (0.09%)
Brazilian: 114 (0.08%)
Turkish: 106 (0.08%)
Slavic: 105 (0.08%)
Croatian: 93 (0.07%)
Slovak: 90 (0.07%)
Ethiopian: 75 (0.05%)
Greek: 72 (0.05%)
Belgian: 70 (0.05%)
Czech: 70 (0.05%)
Swiss: 65 (0.05%)
Lithuanian: 59 (0.04%)
Palestinian: 57 (0.04%)
Bahamian: 55 (0.04%)
Finnish: 45 (0.03%)
Pennsylvania German: 39 (0.03%)
Austrian: 39 (0.03%)
Bulgarian: 33 (0.02%)
Australian: 29 (0.02%)
Liberian: 28 (0.02%)
Armenian: 22 (0.02%)
Trinidadian and Tobagonian: 21 (0.02%)
Slovene: 18 (0.01%)
Egyptian: 17 (0.01%)
Maltese: 16 (0.01%)
Syrian: 15 (0.01%)
Basque: 13 (0.01%)
Luxembourger: 11 (0.01%)
Somali: 11 (0.01%)
Israeli: 7 (0.01%)
South African: 7 (0.01%)
Most common places of birth for foreign-born residents (%):
Mexico
Glendale:
50.2% (21,416)
Arizona:
53.4% (500,086)
Iraq
Glendale:
5.8% (2,490)
Arizona:
1.0% (9,335)
Cuba
Glendale:
5.7% (2,440)
Arizona:
1.0% (8,899)
Vietnam
Glendale:
4.7% (1,999)
Arizona:
2.1% (19,199)
Philippines
Glendale:
3.5% (1,488)
Arizona:
3.2% (30,378)
Africa, n.e.c.
Glendale:
2.7% (1,170)
Arizona:
0.3% (2,754)
China, excluding Hong Kong and Taiwan
Glendale:
2.0% (857)
Arizona:
2.3% (21,275)
India
Glendale:
1.7% (740)
Arizona:
4.5% (41,719)
Romania
Glendale:
1.7% (722)
Arizona:
0.6% (5,792)
Canada
Glendale:
1.7% (712)
Arizona:
4.3% (40,102)
Place of birth for U.S.-born residents:
This state: 107,792
Other state: 96,057
Northeast: 12,124
Midwest: 29,159
South: 15,560
West: 39,214
88.1% of Glendale residents lived in the same house 1 years ago. Out of people who lived in different houses, 38.1% lived in this county. Out of people who lived in different counties, 9.0% lived in Arizona.
Glendale:
88.1%
State average:
86.0%
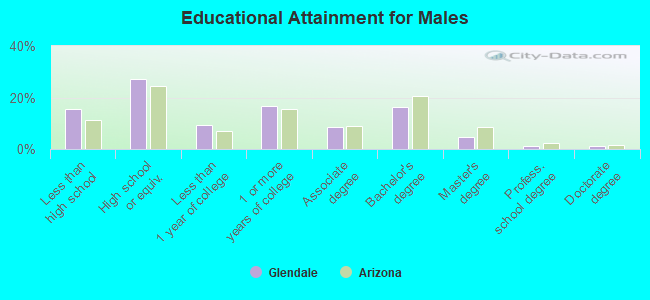
Education attainment for males 25 years and older:
No schooling: 1,355
Nursery to 4th grade: 1,121
5th and 6th grade: 2,255
7th and 8th grade: 1,169
9th grade: 899
10th grade: 575
11th grade: 924
12th grade, no diploma: 4,183
High school graduate (or equivalency): 21,837
Less than 1 year of college: 7,360
Some college more than 1 year, no degree: 13,345
Associate degree: 6,832
Bachelor's degree: 13,277
Master's degree: 3,635
Professional school degree: 874
Doctorate degree: 1,001
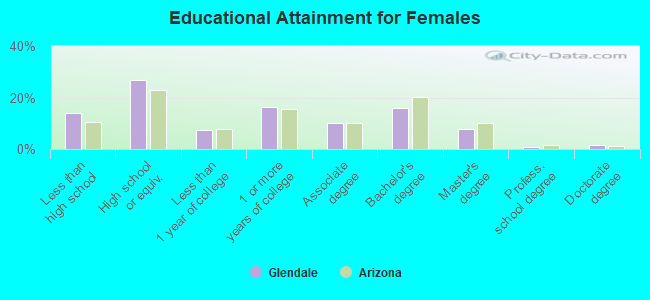
Education attainment for females 25 years and older:
No schooling: 1,443
Nursery to 4th grade: 479
5th and 6th grade: 1,729
7th and 8th grade: 1,399
9th grade: 966
10th grade: 1,440
11th grade: 1,824
12th grade, no diploma: 2,370
High school graduate (or equivalency): 22,506
Less than 1 year of college: 6,283
Some college more than 1 year, no degree: 13,787
Associate degree: 8,356
Bachelor's degree: 13,537
Master's degree: 6,463
Professional school degree: 572
Doctorate degree: 1,186
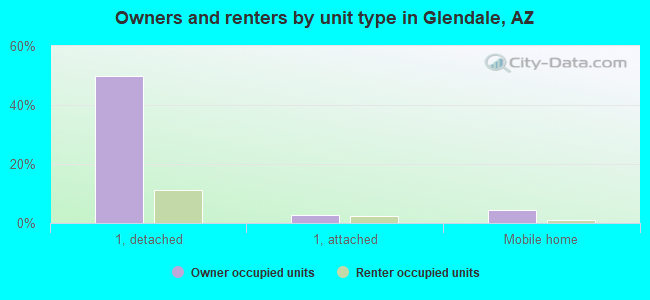
Housing units in structures:
One, detached: 53,153
One, attached: 5,997
Two: 707
3 or 4: 4,065
5 to 9: 4,709
10 to 19: 4,351
20 to 49: 4,703
50 or more: 7,985
Mobile homes: 7,201
Median worth of mobile homes: $24,600
Housing units lacking complete plumbing facilities in 2022: 1.1%
Housing units lacking complete kitchen facilities in 2022: 1.3%
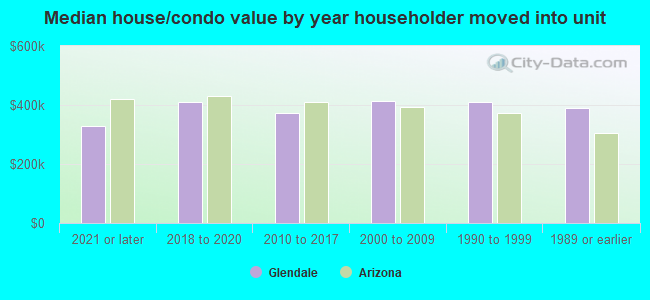
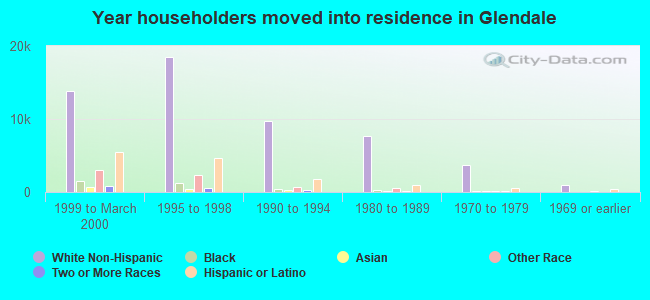
House/condo owner moved in on average 10 years ago