Glasgow, DE (Delaware) Houses and Residents
| Glasgow: | $339,385 |
| Delaware: | $337,200 |
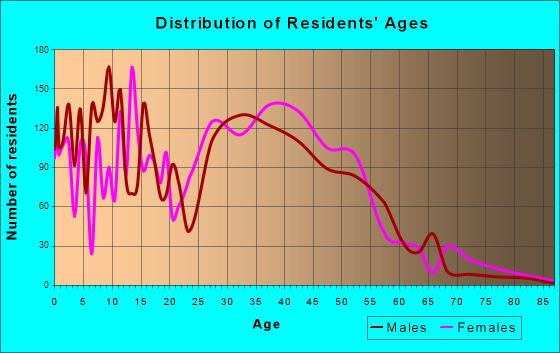
Total population: 14,303 (Urban population: 12,612, Rural population: 121 (all nonfarm))
Houses: 5,635 (5,501 occupied: 4,659 owner occupied, 861 renter occupied)
| % of renters here: | 16% |
| State: | 26% |
Housing density: 569 houses/condos per square mile
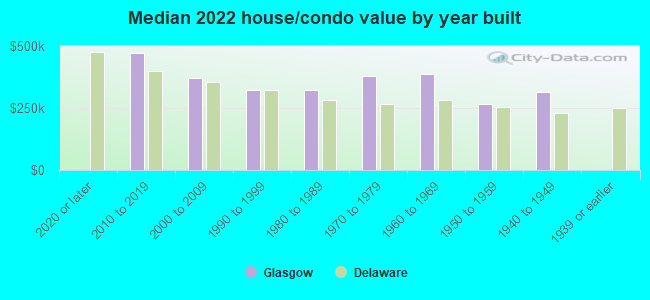
Median price asked for vacant for-sale houses and condos in 2022: $367,725.
Median contract rent in 2022: $1,427 (lower quartile is $1,282, upper quartile is $1,760)
Median gross rent in Glasgow, DE in 2022: $1,679
Housing units in Glasgow with a mortgage: 3,550 (541 second mortgage, 25 home equity loan, 421 both second mortgage and home equity loan)
Houses without a mortgage: 147
Median household income for houses/condos with a mortgage: $102,181
Median household income for apartments without a mortgage: $108,953
Median monthly housing costs: $1,545
Compare current foreclosures near Glasgow, DE:
| Photo | Address | Area | Beds / Baths | Price | Details |
|---|---|---|---|---|---|

|
#1
N Pine St
Wilmington, DE 19802
|
1,125 sq. feet
|
1 baths 3 beds |
$199,900
|
show details |

|
#2
N Norman Ave
Penns Grove, NJ 08069
|
882 sq. feet
|
1 baths 2 beds |
$74,900
|
show details |

|
#3
W Broadway
Salem, NJ 08079
|
2,869 sq. feet
|
2 baths 3 beds |
$90,900
|
show details |

|
#4
Media Rd
Oxford, PA 19363
|
1,155 sq. feet
|
1 baths 2 beds |
$211,938
|
show details |

|
#5
Little John Cir
Avondale, PA 19311
|
2,668 sq. feet
|
2 baths 4 beds |
$389,391
|
show details |

|
#6
Schoolview Ln
Oxford, PA 19363
|
3,504 sq. feet
|
2 baths 4 beds |
$346,389
|
show details |

|
#7
Briarcliff Cir
West Grove, PA 19390
|
3,423 sq. feet
|
2 baths 4 beds |
$337,610
|
show details |

|
#8
Birkdale Cir
Avondale, PA 19311
|
3,334 sq. feet
|
2 baths 4 beds |
$368,645
|
show details |

|
#9
Gap Newport Pike
Avondale, PA 19311
|
1,094 sq. feet
|
1 baths 3 beds |
$10,236
|
show details |

|
#10
Flint Hill Rd
Landenberg, PA 19350
|
960 sq. feet
|
1 baths 2 beds |
$75,282
|
show details |
| Photo | Address | Area | Beds / Baths | Price | Details |
|---|---|---|---|---|---|

|
#11
S Guernsey Rd
West Grove, PA 19390
|
2,400 sq. feet
|
3 baths 6 beds |
$283,973
|
show details |

|
#12
Karlyn Dr
New Castle, DE 19720
|
1,026 sq. feet
|
1 baths 3 beds |
show details | |

|
#13
Riverview Dr
Perryville, MD 21903
|
1,080 sq. feet
|
1 baths 4 beds |
show details | |

|
#14
Maple Ave
Pennsville, NJ 08070
|
1,143 sq. feet
|
1 baths 3 beds |
show details | |

|
#15
Sanford Rd
Pennsville, NJ 08070
|
1,188 sq. feet
|
1 baths 3 beds |
show details | |

|
#16
Taft Ave
Penns Grove, NJ 08069
|
1,030 sq. feet
|
1 baths 2 beds |
show details | |

|
#17
Browning Cir
Middletown, DE 19709
|
2,424 sq. feet
|
2 baths 4 beds |
show details | |

|
#18
Remington Way
West Grove, PA 19390
|
5,130 sq. feet
|
4 baths 4 beds |
show details | |

|
#19
Bonnie Marie Ln
Elkton, MD 21921
|
2,779 sq. feet
|
2 baths 4 beds |
show details | |

|
#20
Milestone Rd
Elkton, MD 21921
|
1,260 sq. feet
|
2 baths 4 beds |
show details |
| Photo | Address | Area | Beds / Baths | Price | Details |
|---|---|---|---|---|---|

|
#21
Kirkwood St
Wilmington, DE 19801
|
1,375 sq. feet
|
1 baths 3 beds |
show details | |

|
#22
Automotive Blvd
Elkton, MD 21921
|
2,644 sq. feet
|
2 baths 4 beds |
show details | |

|
#23
Church Rd
Avondale, PA 19311
|
4,158 sq. feet
|
2 baths 4 beds |
show details | |

|
#24
White Birch Dr
North East, MD 21901
|
1,028 sq. feet
|
2 baths 3 beds |
show details | |

|
#25
Armitage Ct
Lincoln University, PA 19352
|
2,436 sq. feet
|
1 baths 4 beds |
show details | |

|
#26
E Hillcrest Ave
West Grove, PA 19390
|
2,359 sq. feet
|
2 baths 3 beds |
show details | |

|
#27
Highland Ave
Pennsville, NJ 08070
|
1,824 sq. feet
|
2 baths 4 beds |
show details | |

|
#28
Crestview Rd
Landenberg, PA 19350
|
1,120 sq. feet
|
1 baths 3 beds |
show details | |

|
#29
Media Rd
Oxford, PA 19363
|
1,155 sq. feet
|
1 baths 2 beds |
show details | |

|
#30
Edjil Dr
Newark, DE 19713
|
- sq. feet
|
2 baths 4 beds |
show details |
| Photo | Address | Area | Beds / Baths | Price | Details |
|---|---|---|---|---|---|

|
#31
Rocky Glen Rd
Oxford, PA 19363
|
2,191 sq. feet
|
2 baths 4 beds |
show details | |

|
#32
Hamilton Rd
Landenberg, PA 19350
|
2,733 sq. feet
|
2 baths 4 beds |
show details | |

|
#33
Sherin Dr
Newark, DE 19702
|
2,225 sq. feet
|
2 baths 4 beds |
show details | |

|
#34
Cool Springs Rd
North East, MD 21901
|
- sq. feet
|
2 baths 3 beds |
show details | |

|
#35
S Springfield Dr
North East, MD 21901
|
3,486 sq. feet
|
2 baths - beds |
show details | |

|
#36
Newport Pike
Avondale, PA 19311
|
- sq. feet
|
- baths - beds |
$272,285
|
show details |

|
#37
Starr Rd & 112 Starr Rd & 124 Starr Rd
Avondale, PA 19311
|
- sq. feet
|
- baths - beds |
$872,032
|
show details |

|
#38
Pennsylvania Ave
Avondale, PA 19311
|
1,896 sq. feet
|
1 baths 3 beds |
show details | |

|
#39
Mullen Dr
Avondale, PA 19311
|
- sq. feet
|
- baths - beds |
$201,741
|
show details |

|
#40
Elbow Ln
Landenberg, PA 19350
|
2,030 sq. feet
|
2 baths 4 beds |
show details |
| Photo | Address | Area | Beds / Baths | Price | Details |
|---|---|---|---|---|---|

|
#41
Little Elk Creek Rd
Oxford, PA 19363
|
1,357 sq. feet
|
3 baths 3 beds |
show details | |

|
#42
Kimbelot Ln
Landenberg, PA 19350
|
2,282 sq. feet
|
2 baths 4 beds |
show details | |

|
#43
English Ln
West Grove, PA 19390
|
2,552 sq. feet
|
2 baths 4 beds |
show details | |

|
#44
Egypt Run Rd
Landenberg, PA 19350
|
5,552 sq. feet
|
4 baths 4 beds |
show details | |

|
#45
Quill Ct
Oxford, PA 19363
|
2,454 sq. feet
|
2 baths 3 beds |
show details | |

|
#46
Birkdale Cir
Avondale, PA 19311
|
3,334 sq. feet
|
2 baths 4 beds |
show details | |

|
#47
Blanca Ct
West Grove, PA 19390
|
4,300 sq. feet
|
2 baths 4 beds |
show details | |

|
#48
N Heald St
Wilmington, DE 19802
|
- sq. feet
|
1 baths 3 beds |
show details | |

|
#49
Macleren Dr
Middletown, DE 19709
|
- sq. feet
|
1 baths 2 beds |
show details | |

|
Check over 1 million property listings on Foreclosure.com!
|
browse all offers | |||

Latest news about housing in Glasgow, DE collected exclusively by city-data.com from local newspapers, TV, and radio stations

 | St. Andrews Apartments (3 replies) |
| SAFE areas - Townhome rentals in North DE? (6 replies) |
| Good areas to buy a home with good school system. (14 replies) |
| Young family things to do (8 replies) |
| Looking for answers in regard to relocating to NCC (6 replies) |
| Ryan Homes vs PCS Homes vs. Ashburn homes (8 replies) |
Median year apartment built: 1990
Household type by relationship:
Households: 15,538- Male householders: 2,753 (361 living alone), Female householders: 2,727 (670 living alone)
3,191 spouses (3,156 opposite-sex spouses), 692 unmarried partners, (692 opposite-sex unmarried partners), 4,485 children (4,337 natural, 92 adopted, 55 stepchildren), 364 grandchildren, 48 brothers or sisters, 341 parents, 0 foster children, 145 other relatives, 773 non-relatives
- In group quarters: 14
Size of family households: 1,240 2-persons, 1,209 3-persons, 1,084 4-persons, 155 5-persons, 59 6-persons, 70 7-or-more-persons.
Size of nonfamily households: 1,056 1-person, 411 2-persons, 18 3-persons, 222 4-persons.
2,194 married couples with children.
460 single-parent households (109 men, 351 women).
81.0% of residents of Glasgow speak English at home.
3.4% of residents speak Spanish at home (74% speak English very well, 5% speak English well, 12% speak English not well, 9% don't speak English at all).
6.2% of residents speak other Indo-European language at home (78% speak English very well, 10% speak English well, 7% speak English not well, 5% don't speak English at all).
4.2% of residents speak Asian or Pacific Island language at home (65% speak English very well, 14% speak English well, 16% speak English not well, 5% don't speak English at all).
5.9% of residents speak other language at home (82% speak English very well, 18% speak English well).
Foreign born population: 2,028 (13.1%)
(69.0% of them are naturalized citizens)
| Here: | 7.4 |
| State: | 6.9 |
| Here: | 4.3 |
| State: | 4.4 |
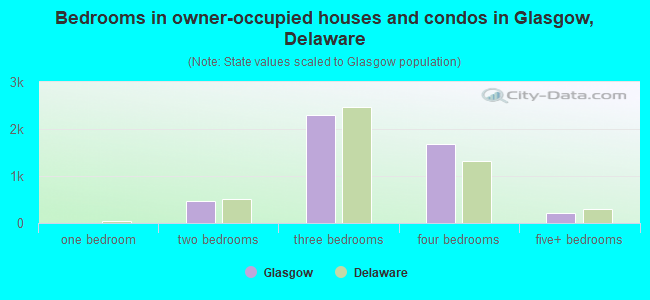
- Bedrooms in owner-occupied houses and condos in Glasgow, Delaware
- 0no bedroom
- 01 bedroom
- 4772 bedrooms
- 2,2983 bedrooms
- 1,6764 bedrooms
- 2095+ bedrooms
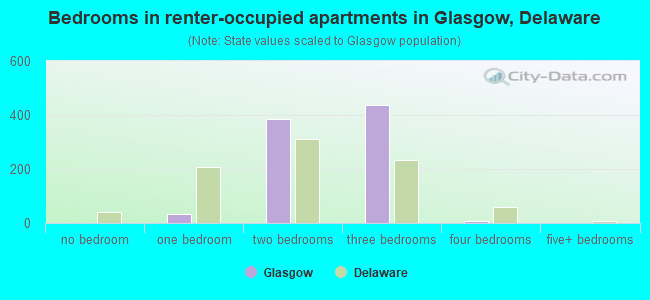
- Bedrooms in renter-occupied apartments in Glasgow, Delaware
- 0no bedroom
- 341 bedroom
- 3862 bedrooms
- 4363 bedrooms
- 64 bedrooms
- 05+ bedrooms
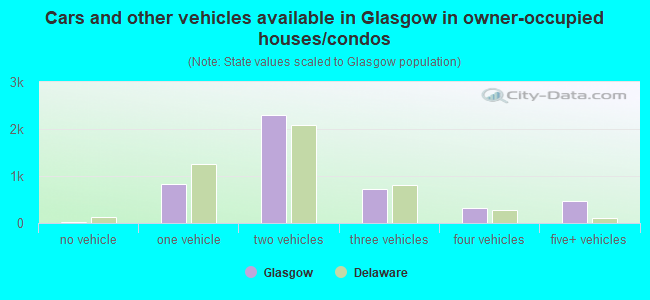
- Cars and other vehicles available in Glasgow in owner-occupied houses/condos
- 17no vehicle
- 8331 vehicle
- 2,3052 vehicles
- 7313 vehicles
- 3154 vehicles
- 4595+ vehicles
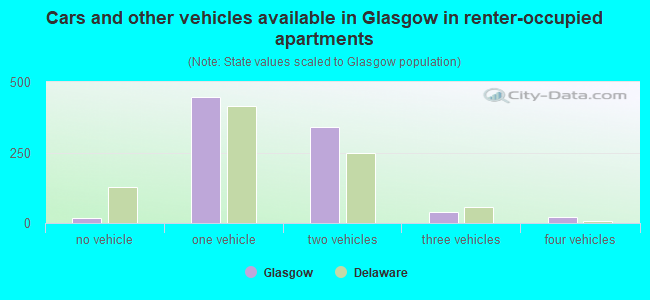
- Cars and other vehicles available in Glasgow in renter-occupied apartments
- 16no vehicle
- 4461 vehicle
- 3392 vehicles
- 393 vehicles
- 214 vehicles
- 05+ vehicles
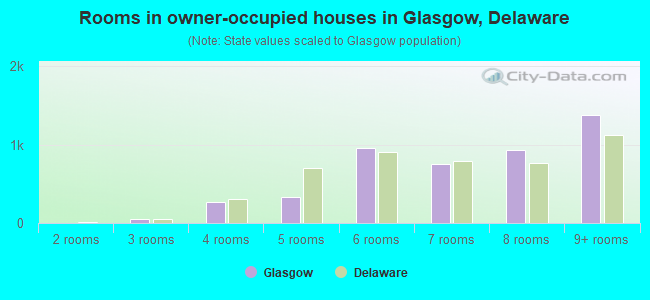
- Rooms in owner-occupied houses in Glasgow, Delaware
- 01 room
- 02 rooms
- 533 rooms
- 2644 rooms
- 3305 rooms
- 9586 rooms
- 7477 rooms
- 9308 rooms
- 1,3789+ rooms
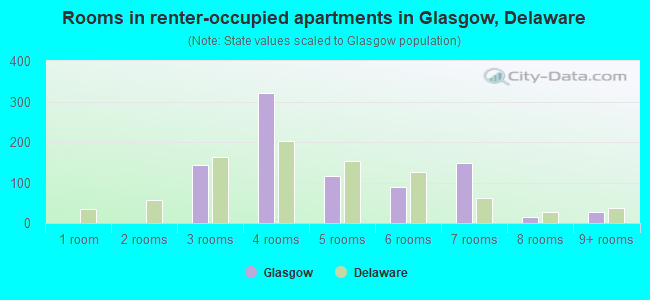
- Rooms in renter-occupied apartments in Glasgow, Delaware
- 01 room
- 02 rooms
- 1423 rooms
- 3224 rooms
- 1175 rooms
- 896 rooms
- 1487 rooms
- 168 rooms
- 269+ rooms
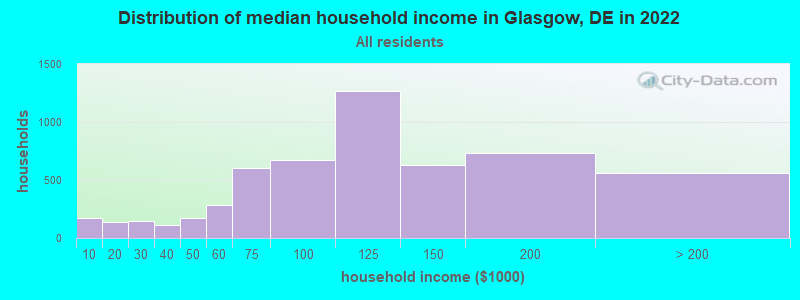
Glasgow, DE household income distribution

- 175Less than $10,000
- 142$10,000 to $19,999
- 150$20,000 to $29,999
- 115$30,000 to $39,999
- 173$40,000 to $49,999
- 283$50,000 to $59,999
- 606$60,000 to $74,999
- 673$75,000 to $99,999
- 1,263$100,000 to $124,999
- 629$125,000 to $149,999
- 737$150,000 to $199,999
- 559$200,000 or more
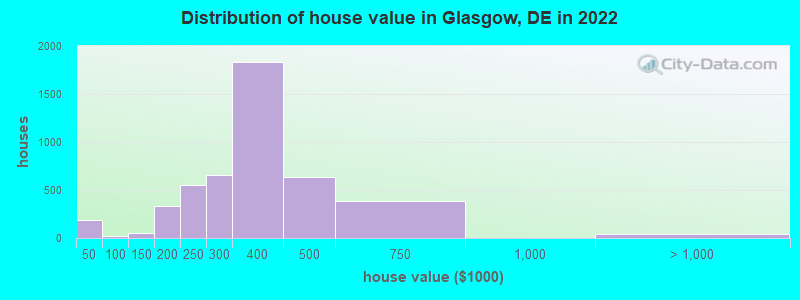
Home value of owner - occupied houses in 2022 in Glasgow, DE
-
- 93$25,000 to $29,999
- 96$30,000 to $34,999
- 26$90,000 to $99,999
- 34$100,000 to $124,999
- 17$125,000 to $149,999
- 80$150,000 to $174,999
- 249$175,000 to $199,999
- 550$200,000 to $249,999
- 654$250,000 to $299,999
- 1,832$300,000 to $399,999
- 630$400,000 to $499,999
- 389$500,000 to $749,999
- 44$1,000,000 to $1,499,999
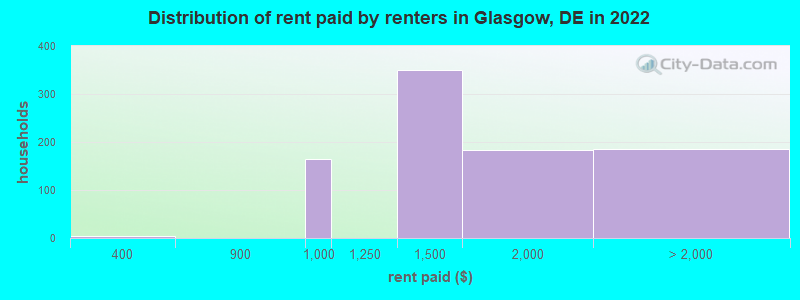
Rent paid by renters in 2022 in Glasgow, DE
-
- 4$300 to $349
- 165$900 to $999
- 350$1,250 to $1,499
- 184$1,500 to $1,999
- 93$2,000 to $2,499
- 35$2,500 to $2,999
- 56No cash rent
Percentage of workers working in this county: 80.1%
Number of people working at home: 1,544 (17.6% of all workers)
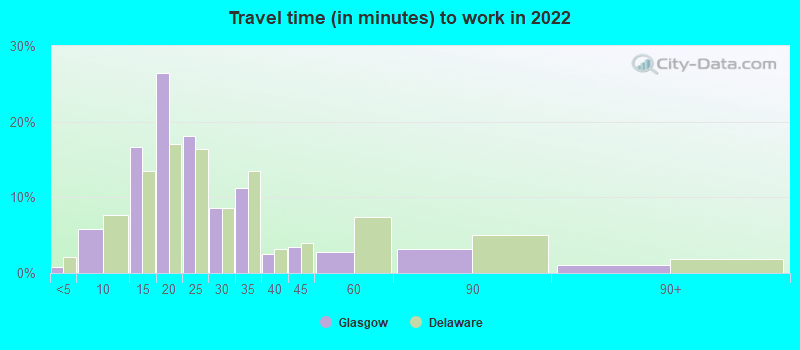
Travel time to work (commute)
- Less than 5 minutes: 136
- 5 to 9 minutes: 376
- 10 to 14 minutes: 599
- 15 to 19 minutes: 871
- 20 to 24 minutes: 1,189
- 25 to 29 minutes: 1,212
- 30 to 34 minutes: 1,078
- 35 to 39 minutes: 158
- 40 to 44 minutes: 361
- 45 to 59 minutes: 660
- 60 to 89 minutes: 452
- 90 or more minutes: 103
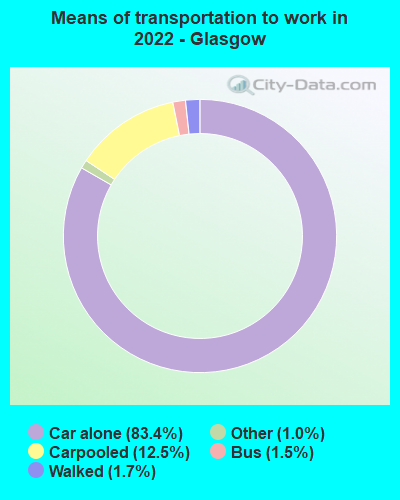
Means of transportation to work:
- Drove a car alone: 3,067 (61.1%)
- Carpooled: 431 (8.6%)
- Bus: 50 (1.0%)
- Taxi: 35 (0.7%)
- Walked: 64 (1.3%)
- Worked at home: 1,544 (30.8%)
- Unemployment by race in 2022
- Unemployment rate for White non-Hispanic residents
- 6.6%Males
- 2.5%Females
- Unemployment rate for Black residents
- 4.9%Males
- 1.4%Females
- Unemployment rate for American Indian and Alaska Native residents
- 58.1%Females
- Unemployment rate for other race residents
- 100.0%Females
- Unemployment rate for two or more race residents
- 10.8%Males
- 10.8%Females
- Unemployment rate for Hispanic or Latino residents
- 41.4%Females
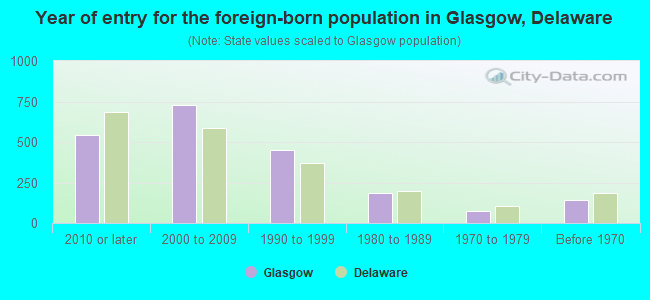
- Year of entry for the foreign-born population in Glasgow, Delaware
- 5422010 or later
- 7292000 to 2009
- 4531990 to 1999
- 1851980 to 1989
- 711970 to 1979
- 139Before 1970
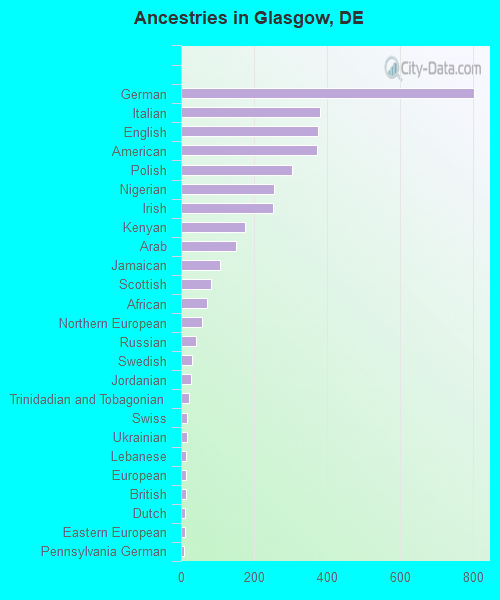
First ancestries reported:
- German: 804 (11.1%)
- Italian: 380 (5.2%)
- English: 376 (5.2%)
- American: 372 (5.1%)
- Polish: 303 (4.2%)
- Nigerian: 254 (3.5%)
- Irish: 253 (3.5%)
- Kenyan: 175 (2.4%)
- Arab: 150 (2.1%)
- Jamaican: 108 (1.5%)
- Scottish: 82 (1.1%)
- African: 70 (1.0%)
- Northern European: 58 (0.8%)
- Russian: 40 (0.6%)
- Swedish: 31 (0.4%)
- Jordanian: 28 (0.4%)
- Trinidadian and Tobagonian: 22 (0.3%)
- Swiss: 16 (0.2%)
- Ukrainian: 16 (0.2%)
- Lebanese: 14 (0.2%)
- European: 14 (0.2%)
- British: 13 (0.2%)
- Dutch: 11 (0.2%)
- Eastern European: 10 (0.1%)
- Pennsylvania German: 9 (0.1%)
Most common places of birth for foreign-born residents (%):
| Glasgow: | 16.9% (340) |
| Delaware: | 3.0% (2,919) |
| Glasgow: | 12.2% (246) |
| Delaware: | 11.6% (11,288) |
| Glasgow: | 9.7% (195) |
| Delaware: | 3.8% (3,727) |
| Glasgow: | 7.6% (153) |
| Delaware: | 0.5% (503) |
| Glasgow: | 6.8% (138) |
| Delaware: | 15.3% (14,887) |
| Glasgow: | 5.9% (119) |
| Delaware: | 1.4% (1,388) |
| Glasgow: | 5.0% (100) |
| Delaware: | 1.1% (1,084) |
| Glasgow: | 3.6% (73) |
| Delaware: | 0.1% (139) |
| Glasgow: | 3.6% (72) |
| Delaware: | 5.7% (5,583) |
| Glasgow: | 2.9% (59) |
| Delaware: | 0.6% (591) |
| Glasgow: | 2.8% (56) |
| Delaware: | 1.6% (1,518) |
| Glasgow: | 2.7% (55) |
| Delaware: | 1.8% (1,717) |
| Glasgow: | 2.5% (51) |
| Delaware: | 0.5% (534) |
| Glasgow: | 2.3% (47) |
| Delaware: | 0.8% (776) |
| Glasgow: | 2.2% (45) |
| Delaware: | 0.9% (911) |
| Glasgow: | 1.7% (34) |
| Delaware: | 0.9% (834) |
Place of birth for U.S.-born residents:
- This state: 7,464
- Other state: 5,670
- Northeast: 3,650
- Midwest: 296
- South: 1,495
- West: 209
93.9% of Glasgow residents lived in the same house 1 years ago.
Out of people who lived in different houses, 25.5% lived in this county.
Out of people who lived in different counties, 0.0% lived in Delaware.
| Glasgow: | 93.9% |
| State average: | 89.2% |
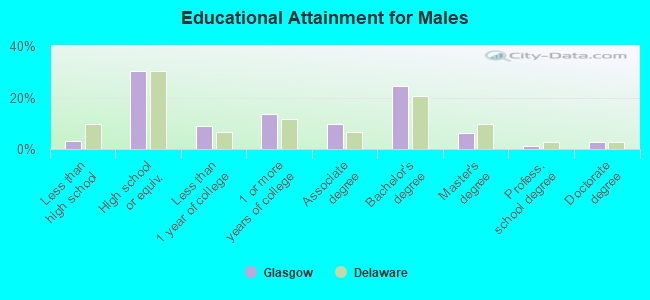
Education attainment for males 25 years and older:
- No schooling: 105
- Nursery to 4th grade: 0
- 5th and 6th grade: 0
- 7th and 8th grade: 0
- 9th grade: 0
- 10th grade: 71
- 11th grade: 5
- 12th grade, no diploma: 0
- High school graduate (or equivalency): 1,693
- Less than 1 year of college: 498
- Some college more than 1 year, no degree: 759
- Associate degree: 540
- Bachelor's degree: 1,374
- Master's degree: 343
- Professional school degree: 66
- Doctorate degree: 142
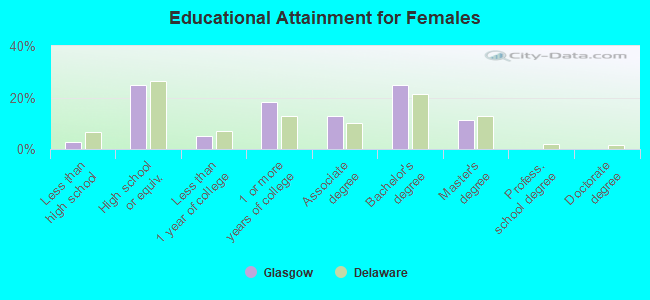
Education attainment for females 25 years and older:
- No schooling: 43
- Nursery to 4th grade: 0
- 5th and 6th grade: 37
- 7th and 8th grade: 0
- 9th grade: 28
- 10th grade: 0
- 11th grade: 37
- 12th grade, no diploma: 12
- High school graduate (or equivalency): 1,520
- Less than 1 year of college: 299
- Some college more than 1 year, no degree: 1,112
- Associate degree: 787
- Bachelor's degree: 1,520
- Master's degree: 693
- Professional school degree: 0
- Doctorate degree: 0
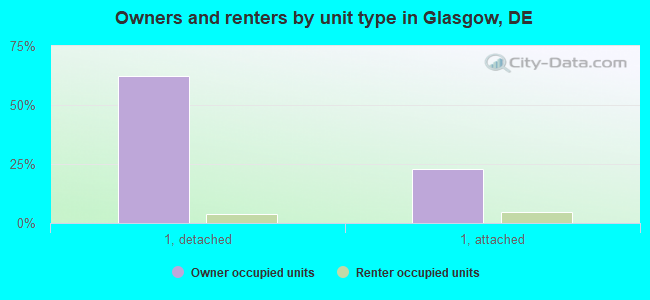
Housing units in structures:
- One, detached: 3,669
- One, attached: 1,588
- 3 or 4: 10
- 5 to 9: 306
- 10 to 19: 22
- 50 or more: 27
- Boats, RVs, vans, etc.: 11
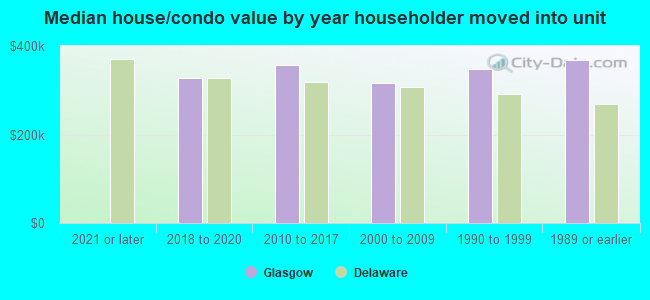
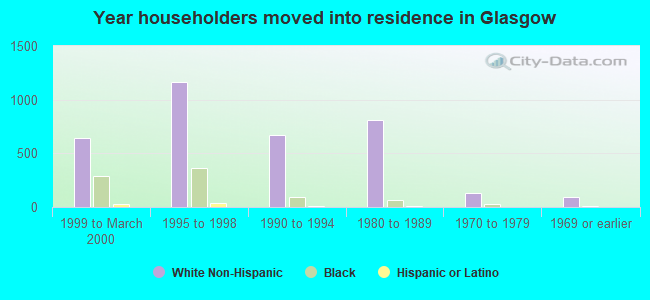
House/condo owner moved in on average 16 years ago
Renter moved in on average 3 years ago
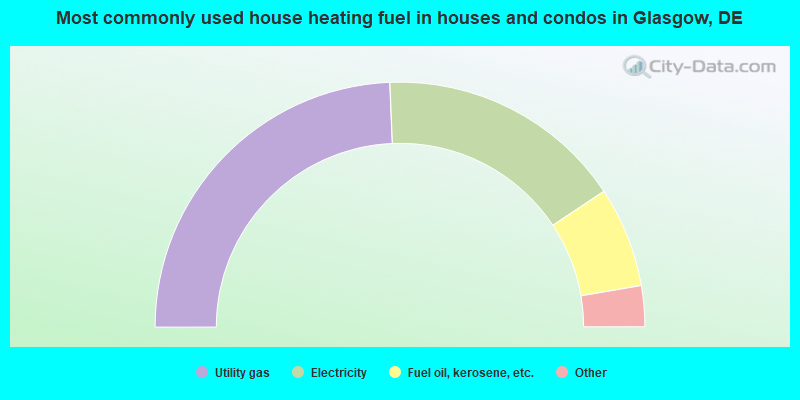
- 48.7%Utility gas
- 32.6%Electricity
- 13.3%Fuel oil, kerosene, etc.
- 3.3%Bottled, tank, or LP gas
- 0.9%Solar energy
- 0.7%Wood
- 0.5%Other fuel
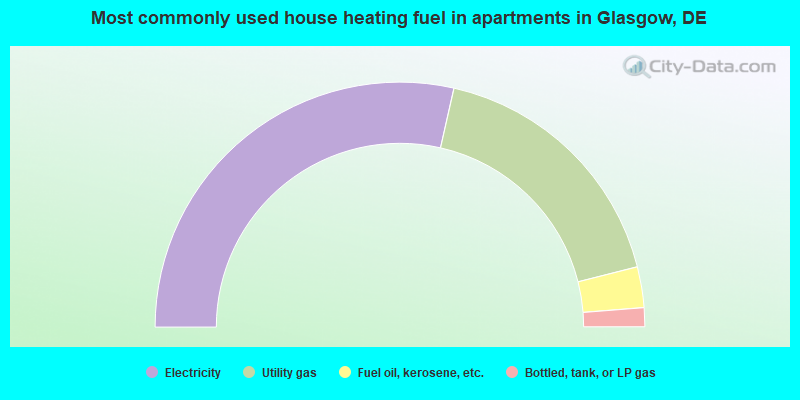
- 57.1%Electricity
- 35.0%Utility gas
- 5.4%Fuel oil, kerosene, etc.
- 2.5%Bottled, tank, or LP gas
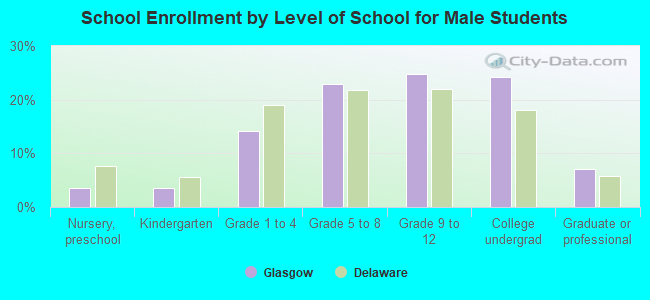
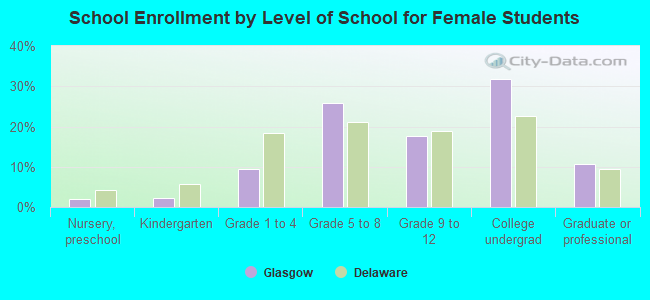
Private vs. public school enrollment:
| Here: | 23.2% |
| Delaware: | 11.5% |
| Here: | 17.1% |
| Delaware: | 12.1% |
| Here: | 14.9% |
| Delaware: | 19.2% |