Housing density: 1,127 houses/condos per square mile
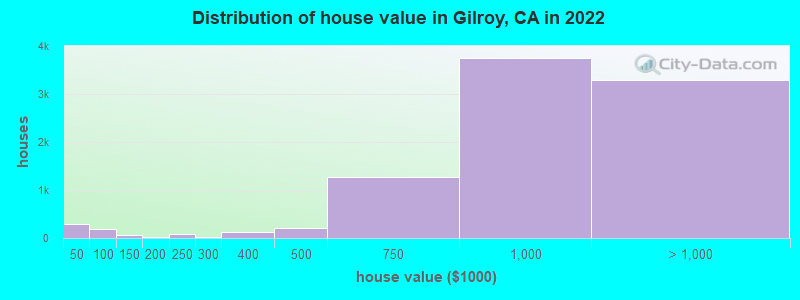
Median price asked for vacant for-sale houses and condos in 2022: $1,749,787.
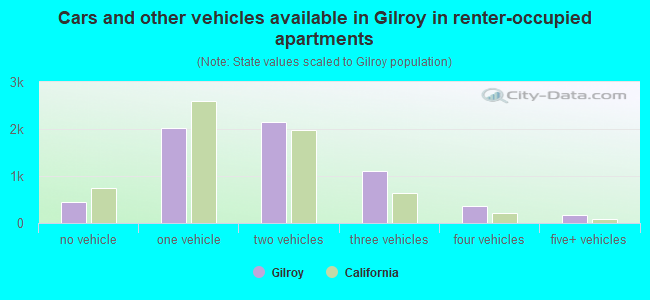
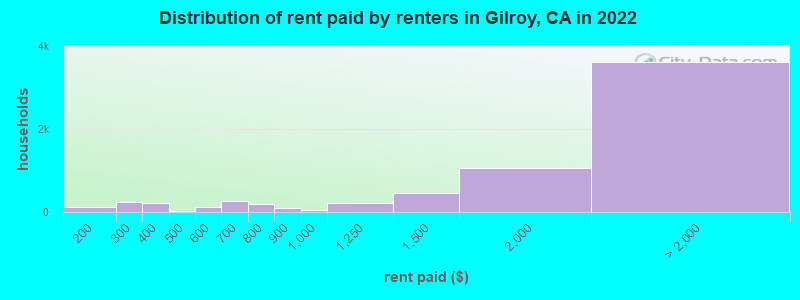
Median contract rent in 2022: over $2,000 (lower quartile is $1,309, upper quartile is over $2,000)
Median rent asked for vacant for-rent units in 2022: $2,822
Median gross rent in Gilroy, CA in 2022: over $2,000
Housing units in Gilroy with a mortgage: 8,043 (801 second mortgage, 16 home equity loan, 658 both second mortgage and home equity loan) Houses without a mortgage: 11
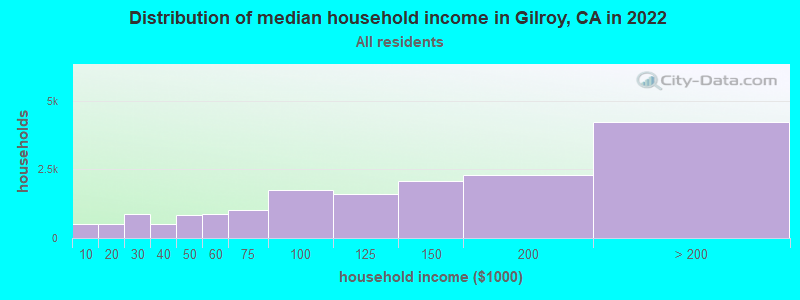
Median household income for houses/condos with a mortgage: $171,092
Median household income for apartments without a mortgage: $101,879
9,921 married couples with children.
4,024 single-parent households (1,119 men, 2,905 women).
52.1% of residents of Gilroy speak English at home.
36.2% of residents speak Spanish at home (60% speak English very well, 19% speak English well, 14% speak English not well, 8% don't speak English at all).
3.9% of residents speak other Indo-European language at home (68% speak English very well, 24% speak English well, 8% speak English not well, 1% don't speak English at all).
6.4% of residents speak Asian or Pacific Island language at home (60% speak English very well, 26% speak English well, 11% speak English not well, 3% don't speak English at all).
0.6% of residents speak other language at home (33% speak English very well, 51% speak English well, 16% speak English not well).
Foreign born population: 14,391 (25.1%)
(53.6% of them are naturalized citizens)
Percentage of workers working in this county: 88.6% Number of people working at home: 3,659 (14.1% of all workers)
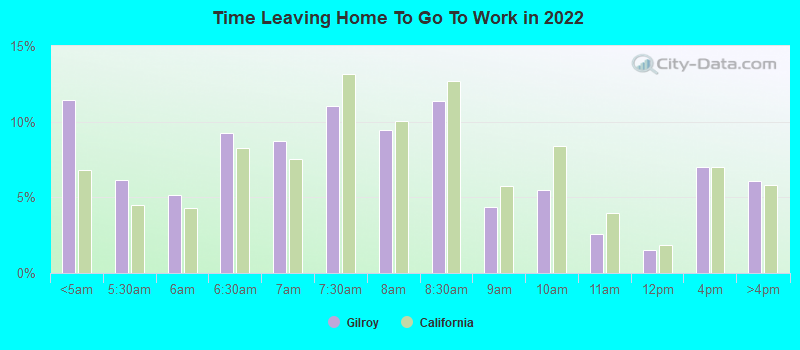
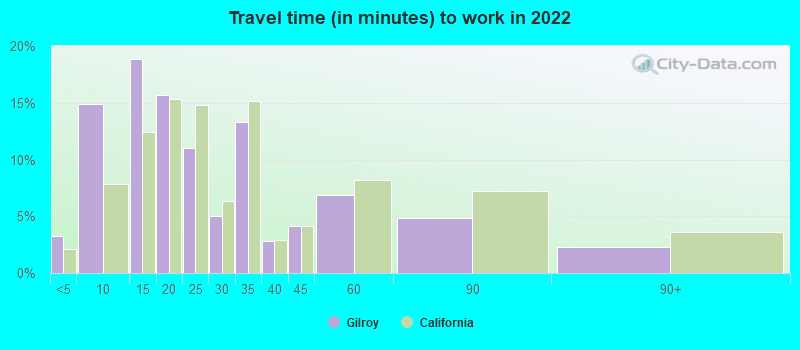
Travel time to work (commute)
Less than 5 minutes: 547
5 to 9 minutes: 2,897
10 to 14 minutes: 3,571
15 to 19 minutes: 2,314
20 to 24 minutes: 1,470
25 to 29 minutes: 583
30 to 34 minutes: 1,727
35 to 39 minutes: 667
40 to 44 minutes: 854
45 to 59 minutes: 2,755
60 to 89 minutes: 2,402
90 or more minutes: 983
Means of transportation to work:
Drove a car alone: 14,853 (67.2%)
Carpooled: 2,542 (11.5%)
Bus: 171 (0.8%)
Subway or elevated rail: 4 (0.0%)
Long-distance train or commuter rail: 31 (0.1%)
Taxi: 231 (1.0%)
Bicycle: 49 (0.2%)
Walked: 301 (1.4%)
Worked at home: 3,659 (16.6%)
Unemployment by race in 2022
Unemployment rate for White non-Hispanic residents
2.9%Males
5.9%Females
Unemployment rate for Black residents
3.8%Males
Unemployment rate for Asian residents
2.9%Males
3.3%Females
Unemployment rate for other race residents
3.3%Males
7.0%Females
Unemployment rate for two or more race residents
8.2%Males
4.1%Females
Unemployment rate for Hispanic or Latino residents
5.6%Males
8.1%Females
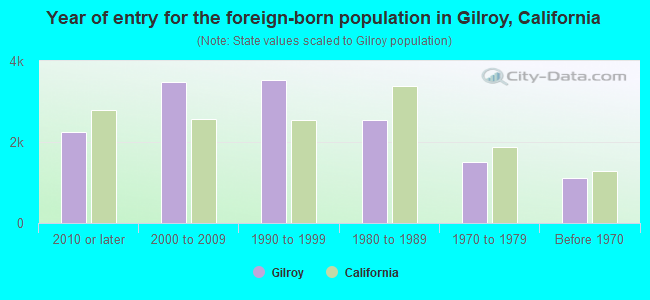
Year of entry for the foreign-born population in Gilroy, California
2,2482010 or later
3,4842000 to 2009
3,5371990 to 1999
2,5321980 to 1989
1,4971970 to 1979
1,108Before 1970
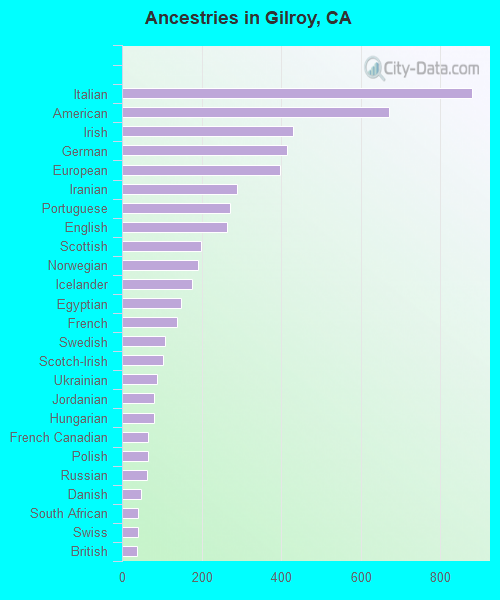
First ancestries reported:
Italian: 878 (2.5%)
American: 671 (1.9%)
Irish: 430 (1.2%)
German: 415 (1.2%)
European: 398 (1.1%)
Iranian: 288 (0.8%)
Portuguese: 272 (0.8%)
English: 263 (0.8%)
Scottish: 199 (0.6%)
Norwegian: 190 (0.5%)
Icelander: 176 (0.5%)
Egyptian: 148 (0.4%)
French: 138 (0.4%)
Swedish: 107 (0.3%)
Scotch-Irish: 103 (0.3%)
Ukrainian: 88 (0.3%)
Jordanian: 81 (0.2%)
Hungarian: 81 (0.2%)
French Canadian: 66 (0.2%)
Polish: 65 (0.2%)
Russian: 62 (0.2%)
Danish: 48 (0.1%)
South African: 40 (0.1%)
Swiss: 40 (0.1%)
British: 38 (0.1%)
Eastern European: 37 (0.1%)
Guyanese: 35 (0.1%)
Greek: 29 (0.08%)
Northern European: 23 (0.07%)
Austrian: 22 (0.06%)
Dutch: 21 (0.06%)
Scandinavian: 16 (0.05%)
Haitian: 16 (0.05%)
Assyrian: 14 (0.04%)
Lithuanian: 13 (0.04%)
Slovak: 12 (0.03%)
Turkish: 12 (0.03%)
Israeli: 11 (0.03%)
Canadian: 11 (0.03%)
Brazilian: 11 (0.03%)
Finnish: 9 (0.03%)
Nigerian: 8 (0.02%)
Palestinian: 4 (0.01%)
Most common places of birth for foreign-born residents (%):
Mexico
Gilroy:
54.1% (7,786)
California:
37.2% (3,881,193)
Philippines
Gilroy:
9.2% (1,325)
California:
7.8% (818,297)
India
Gilroy:
6.3% (902)
California:
5.2% (539,184)
Vietnam
Gilroy:
3.0% (430)
California:
4.9% (512,335)
China, excluding Hong Kong and Taiwan
Gilroy:
2.2% (322)
California:
6.6% (684,672)
El Salvador
Gilroy:
2.2% (315)
California:
4.2% (440,287)
Iran
Gilroy:
2.1% (300)
California:
2.0% (206,004)
Colombia
Gilroy:
1.9% (272)
California:
0.5% (55,249)
Korea
Gilroy:
1.9% (268)
California:
3.0% (315,248)
Cameroon
Gilroy:
1.5% (219)
California:
0.0% (3,174)
Place of birth for U.S.-born residents:
This state: 36,140
Other state: 5,621
Northeast: 1,170
Midwest: 1,332
South: 1,278
West: 1,819
89.5% of Gilroy residents lived in the same house 1 years ago. Out of people who lived in different houses, 42.0% lived in this county. Out of people who lived in different counties, 81.0% lived in California.
Gilroy:
89.5%
State average:
88.9%
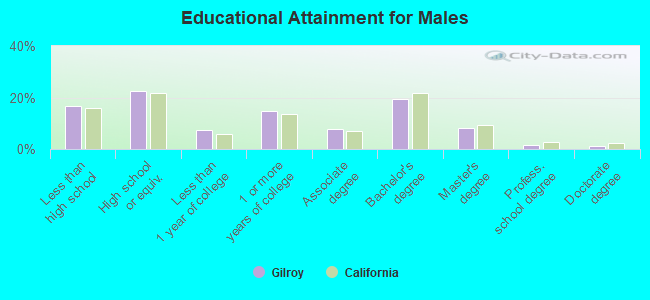
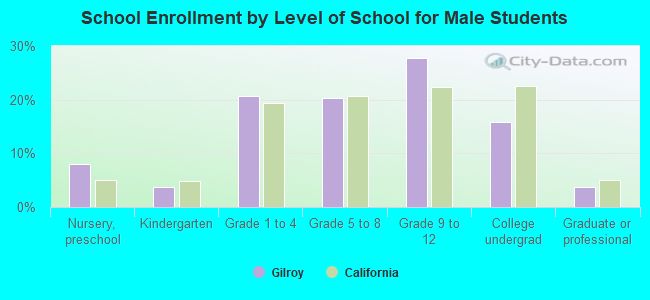
Education attainment for males 25 years and older:
No schooling: 328
Nursery to 4th grade: 145
5th and 6th grade: 856
7th and 8th grade: 253
9th grade: 243
10th grade: 316
11th grade: 248
12th grade, no diploma: 422
High school graduate (or equivalency): 3,812
Less than 1 year of college: 1,255
Some college more than 1 year, no degree: 2,468
Associate degree: 1,291
Bachelor's degree: 3,294
Master's degree: 1,388
Professional school degree: 286
Doctorate degree: 207
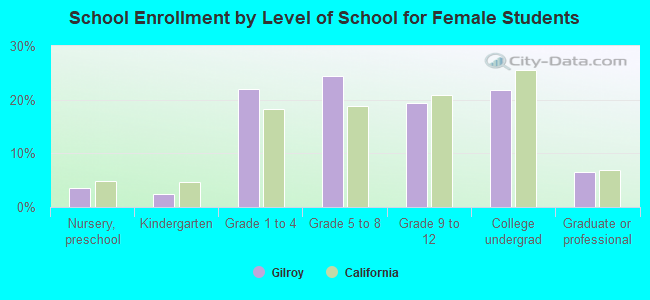
Education attainment for females 25 years and older:
No schooling: 601
Nursery to 4th grade: 213
5th and 6th grade: 983
7th and 8th grade: 322
9th grade: 229
10th grade: 228
11th grade: 124
12th grade, no diploma: 271
High school graduate (or equivalency): 3,603
Less than 1 year of college: 1,442
Some college more than 1 year, no degree: 2,887
Associate degree: 1,825
Bachelor's degree: 3,639
Master's degree: 1,665
Professional school degree: 123
Doctorate degree: 184
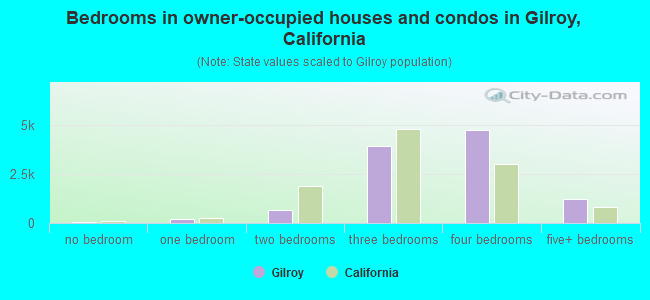
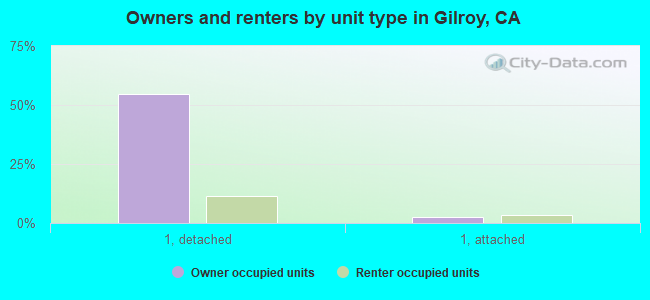
Housing units in structures:
One, detached: 12,809
One, attached: 1,081
Two: 182
3 or 4: 980
5 to 9: 834
10 to 19: 475
20 to 49: 371
50 or more: 807
Mobile homes: 325
Median worth of mobile homes: $247,817
Housing units lacking complete plumbing facilities in 2022: 0.1%
Housing units lacking complete kitchen facilities in 2022: 0.9%
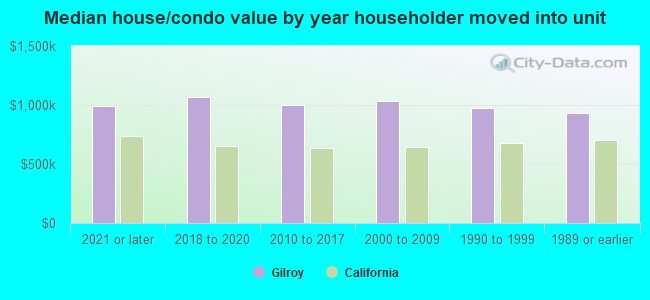
House/condo owner moved in on average 10 years ago