Gibson, IL (Illinois) Houses and Residents
| Gibson: | $114,468 |
| Illinois: | $251,600 |
Total population: 3,336 (All urban)
Houses: 1,557 (1,482 occupied: 1,009 owner occupied, 473 renter occupied)
| % of renters here: | 32% |
| State: | 33% |
Housing density: 740 houses/condos per square mile
Median price asked for vacant for-sale houses and condos in 2022 in this county: $40,135.
Median contract rent in 2022: $483 (lower quartile is $318, upper quartile is $661)
Median rent asked for vacant for-rent units in 2022: $508
Median gross rent in Gibson, IL in 2022: $649
Housing units in Gibson with a mortgage: 432 (30 second mortgage, 31 home equity loan, 0 both second mortgage and home equity loan)
Houses without a mortgage: 490


Latest news about housing in Gibson, IL collected exclusively by city-data.com from local newspapers, TV, and radio stations

 | Chicago best steakhouses (49 replies) |
| Best Steakhouse in Chicago (15 replies) |
| Gibson's Going Downhill? (66 replies) |
| Other Things to Do After 12+ Trips to the City (28 replies) |
| Best Chicago neighborhood to live in if you work from home & don't have to commute to work? (29 replies) |
| Excited for first visit and could use advice! (20 replies) |

Household type by relationship:
Households: 13,671- In family households: 11,522 (2,840 male householders, 958 female householders)
2,996 spouses, 3,977 children (3,598 natural, 128 adopted, 251 stepchildren), 182 grandchildren, 64 brothers or sisters, 48 parents, foster children, 112 other relatives, 304 non-relatives
- In nonfamily households: 2,149 (826 male householders (684 living alone)), 1,052 female householders (971 living alone)), 271 nonrelatives
- In group quarters: 410 (all institutionalized)
2,744 married couples with children.
678 single-parent households (176 men, 502 women).
97.5% of residents of Gibson speak English at home.
0.9% of residents speak Spanish at home (63% speak English very well, 17% speak English well, 20% speak English not well).
1.6% of residents speak other Indo-European language at home (72% speak English very well, 16% speak English well, 12% speak English not well).
Foreign born population: 11 (0.3%)
(136.4% of them are naturalized citizens)
| Here: | 6.4 |
| State: | 6.4 |
| Here: | 4.1 |
| State: | 4.1 |
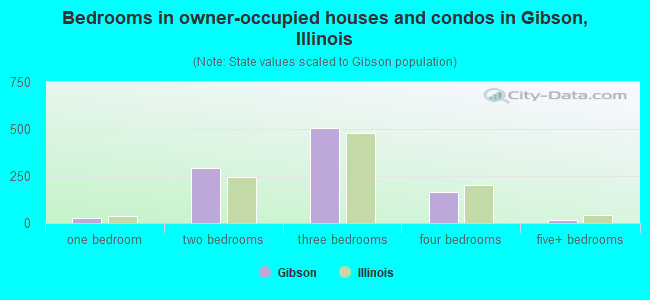
- Bedrooms in owner-occupied houses and condos in Gibson, Illinois
- 0no bedroom
- 281 bedroom
- 2932 bedrooms
- 5063 bedrooms
- 1674 bedrooms
- 155+ bedrooms
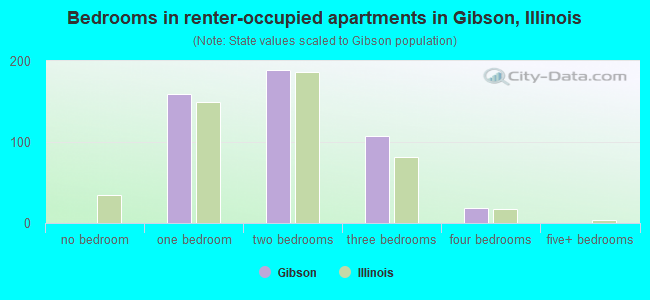
- Bedrooms in renter-occupied apartments in Gibson, Illinois
- 0no bedroom
- 1591 bedroom
- 1892 bedrooms
- 1073 bedrooms
- 184 bedrooms
- 05+ bedrooms
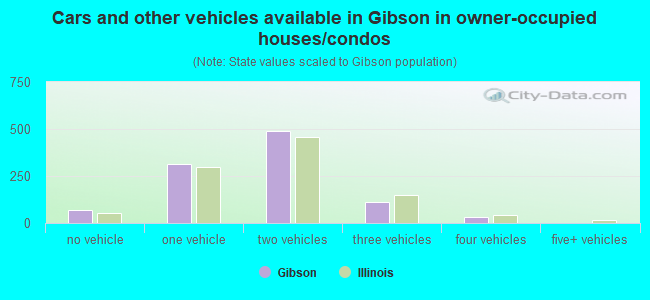
- Cars and other vehicles available in Gibson in owner-occupied houses/condos
- 67no vehicle
- 3121 vehicle
- 4882 vehicles
- 1103 vehicles
- 324 vehicles
- 05+ vehicles
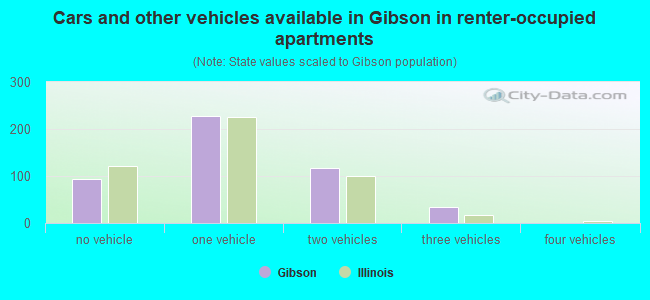
- Cars and other vehicles available in Gibson in renter-occupied apartments
- 94no vehicle
- 2281 vehicle
- 1172 vehicles
- 343 vehicles
- 04 vehicles
- 05+ vehicles
- Rooms in owner-occupied houses in Gibson, Illinois
- 01 room
- 02 rooms
- 53 rooms
- 1154 rooms
- 2505 rooms
- 2876 rooms
- 1737 rooms
- 938 rooms
- 869+ rooms
- Rooms in renter-occupied apartments in Gibson, Illinois
- 01 room
- 372 rooms
- 1003 rooms
- 1484 rooms
- 1235 rooms
- 376 rooms
- 57 rooms
- 188 rooms
- 59+ rooms
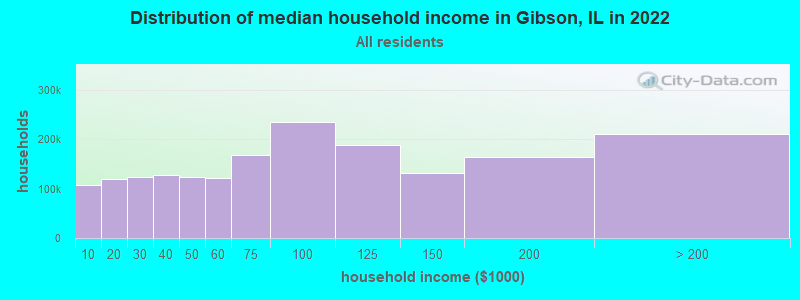
Gibson, IL household income distribution

- 189,941Less than $10,000
- 208,332$10,000 to $19,999
- 211,614$20,000 to $29,999
- 215,984$30,000 to $39,999
- 208,157$40,000 to $49,999
- 206,999$50,000 to $59,999
- 284,193$60,000 to $74,999
- 396,715$75,000 to $99,999
- 316,816$100,000 to $124,999
- 223,057$125,000 to $149,999
- 283,726$150,000 to $199,999
- 378,693$200,000 or more
Percentage of workers working in this county: 69.5%
Number of people working at home: 275 (16.7% of all workers)
Travel time to work (commute)
- Less than 5 minutes: 326
- 5 to 9 minutes: 421
- 10 to 14 minutes: 135
- 15 to 19 minutes: 46
- 20 to 24 minutes: 98
- 25 to 29 minutes: 54
- 30 to 34 minutes: 88
- 35 to 39 minutes: 53
- 40 to 44 minutes: 91
- 45 to 59 minutes: 138
- 60 to 89 minutes: 5
- 90 or more minutes: 18
Means of transportation to work:
- Drove a car alone: 1,204 (78.7%)
- Carpooled: 155 (10.1%)
- Bicycle: 5 (0.3%)
- Walked: 98 (6.4%)
- Other means: 11 (0.7%)
- Worked at home: 56 (3.7%)
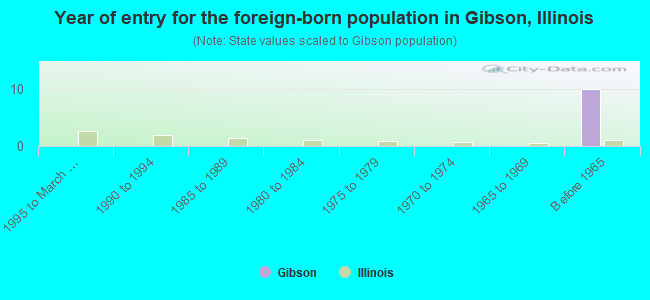
- Year of entry for the foreign-born population in Gibson, Illinois
- 01995 to March 2000
- 01990 to 1994
- 01985 to 1989
- 01980 to 1984
- 01975 to 1979
- 01970 to 1974
- 01965 to 1969
- 10Before 1965
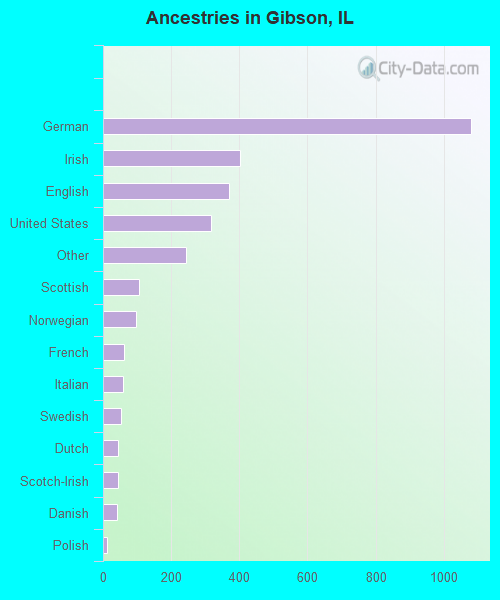
First ancestries reported:
- German: 1,079 (36.6%)
- Irish: 403 (13.7%)
- English: 370 (12.6%)
- United States: 318 (10.8%)
- Other: 244 (8.3%)
- Scottish: 106 (3.6%)
- Norwegian: 97 (3.3%)
- French: 62 (2.1%)
- Italian: 59 (2.0%)
- Swedish: 54 (1.8%)
- Dutch: 45 (1.5%)
- Scotch-Irish: 44 (1.5%)
- Danish: 41 (1.4%)
- Polish: 13 (0.4%)
- Czech: 8 (0.3%)
- Slovak: 5 (0.2%)
Most common places of birth for foreign-born residents (%):
| Gibson: | 60.0% (6) |
| Illinois: | 1.3% (20,130) |
| Gibson: | 40.0% (4) |
| Illinois: | 2.1% (32,764) |
Place of birth for U.S.-born residents:
- This state: 2,766
- Other state: 591
- Northeast: 17
- Midwest: 361
- South: 185
- West: 28
59% of Gibson residents lived in the same house 5 years ago.
Out of people who lived in different houses, 53% lived in this county.
Out of people who lived in different counties, 75% lived in Illinois.
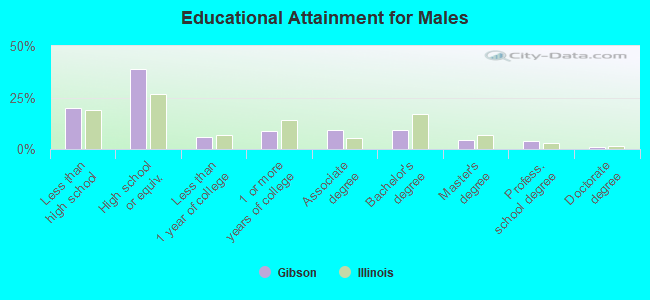
Education attainment for males 25 years and older:
- No schooling: 0
- Nursery to 4th grade: 6
- 5th and 6th grade: 0
- 7th and 8th grade: 65
- 9th grade: 45
- 10th grade: 44
- 11th grade: 25
- 12th grade, no diploma: 20
- High school graduate (or equivalency): 405
- Less than 1 year of college: 59
- Some college more than 1 year, no degree: 89
- Associate degree: 94
- Bachelor's degree: 96
- Master's degree: 44
- Professional school degree: 39
- Doctorate degree: 10
Education attainment for females 25 years and older:
- No schooling: 6
- Nursery to 4th grade: 6
- 5th and 6th grade: 12
- 7th and 8th grade: 66
- 9th grade: 21
- 10th grade: 57
- 11th grade: 57
- 12th grade, no diploma: 39
- High school graduate (or equivalency): 510
- Less than 1 year of college: 115
- Some college more than 1 year, no degree: 181
- Associate degree: 97
- Bachelor's degree: 111
- Master's degree: 23
- Professional school degree: 15
- Doctorate degree: 0


Housing units in structures:
- One, detached: 1,245
- One, attached: 30
- Two: 50
- 3 or 4: 57
- 5 to 9: 51
- 10 to 19: 28
- 20 to 49: 55
- Mobile homes: 41
Median worth of mobile homes: $26,795
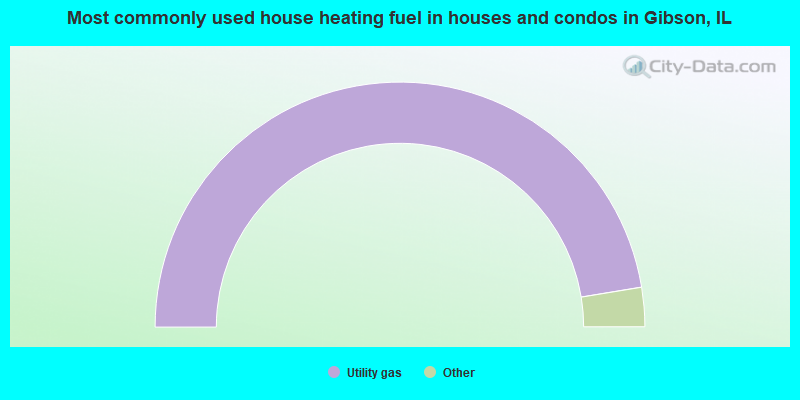
- 94.8%Utility gas
- 3.5%Electricity
- 1.7%Bottled, tank, or LP gas
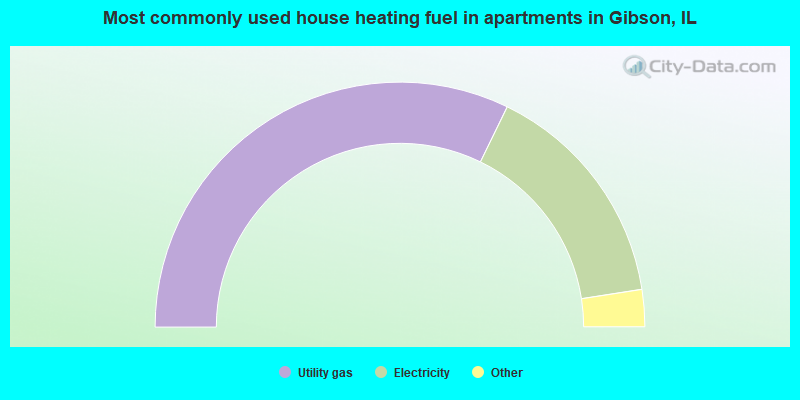
- 64.5%Utility gas
- 30.7%Electricity
- 2.7%Bottled, tank, or LP gas
- 2.1%Fuel oil, kerosene, etc.
Private vs. public school enrollment:
| Here: | 1.9% |
| Illinois: | 13.4% |
| Here: | 9.3% |
| Illinois: | 11.1% |
| Here: | 0.0% |
| Illinois: | 25.8% |