Georgetown, TX (Texas) Houses and Residents
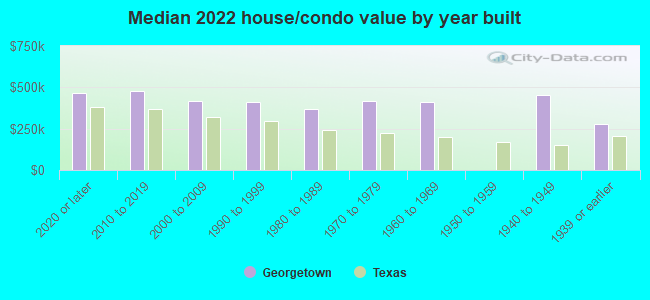
Estimated median house or condo value in 2022: $441,500 (it was $139,200 in 2000 )
Georgetown:
$441,500Texas:
$275,400
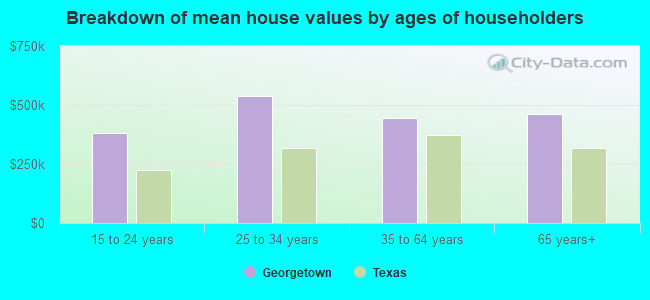
Lower value quartile - upper value quartile: $347,800 - $578,300Mean price in 2022: Detached houses: $515,103 Here:
$515,103State:
$369,058
Townhouses or other attached units: $276,739 Here:
$276,739State:
$327,631
In 2-unit structures: $104,633 Here:
$104,633State:
$374,947
In 3-to-4-unit structures: $203,095 Here:
$203,095State:
$209,652
In 5-or-more-unit structures: $6,808,485 Here:
$6,808,485State:
$413,944
Mobile homes: $72,168 Here:
$72,168State:
$124,413
Total population: 59,102 (Urban population: 27,713 (all inside urban clusters), Rural population: 517 (all nonfarm) )
Houses: 40,285 (39,110 occupied: 28,277 owner occupied, 10,833 renter occupied )
% of renters here:
28%State:
38%
Housing density: 1,765 houses/condos per square mile
Median price asked for vacant for-sale houses and condos in 2022: $364,579.
Median contract rent in 2022: $1,789 (lower quartile is $1,397, upper quartile is over $2,000)
Median rent asked for vacant for-rent units in 2022: $1,058
Median gross rent in Georgetown, TX in 2022: $1,870
Housing units in Georgetown with a mortgage: 18,311 (188 second mortgage, 0 home equity loan, 188 both second mortgage and home equity loan )Houses without a mortgage: 257
Median household income for houses/condos with a mortgage: $118,467
Median household income for apartments without a mortgage: $86,704
Median monthly housing costs: $1,751
Data:
Median house or condo value ($)
Median house or condo value ($ change since 2000)
Median house or condo value ($) - White
Median house or condo value ($) - Black or African American
Median house or condo value ($) - Asian
Median house or condo value ($) - Hispanic or Latino
Median house or condo value ($) - American Indian and Alaska Native
Median house or condo value ($) - Multirace
Median house or condo value ($) - Other Race
Median price asked for mobile homes ($)
Household density (households per square mile)
Mean house or condo value by units in structure - 1, detached ($)
Mean house or condo value by units in structure - 1, attached ($)
Mean house or condo value by units in structure - 2 ($)
Mean house or condo value by units in structure by units in structure - 3 or 4 ($)
Mean house or condo value by units in structure - 5 or more ($)
Mean house or condo value by units in structure - Boat, RV, van, etc. ($)
Mean house or condo value by units in structure - Mobile home ($)
Median contract rent ($)
Median contract rent - Lower quartile ($)
Median contract rent - Upper quartile ($)
Median gross rent ($)
Urban houses (%)
Rural houses (%)
Houses occupied (%)
Houses occupied (% change since 2000)
Houses owner occupied (%)
Houses owner occupied (% change since 2000)
Houses renter occupied (%)
Houses renter occupied (% change since 2000)
Vacant housing units - For rent (%)
Vacant housing units - For rent (% change since 2000)
Vacant housing units - For sale only (%)
Vacant housing units - For sale only (% change since 2000)
Vacant housing units - Rented or sold, not occupied (%)
Vacant housing units - Rented or sold, not occupied (% change since 2000)
Vacant housing units - For seasonal, recreational, or occasional use (%)
Vacant housing units - For seasonal, recreational, or occasional use (% change since 2000)
Vacant housing units - For migrant workers (%)
Vacant housing units - For migrant workers (% change since 2000)
Vacant housing units - Other vacant (%)
Vacant housing units - Other vacant (% change since 2000)
Median monthly housing costs ($)
Median household income for houses/condos with a mortgage ($)
Median household income for houses/condos without a mortgage ($)
Median household income ($)
Median household income ($) - White
Median household income ($) - Black or African American
Median household income ($) - Asian
Median household income ($) - Hispanic or Latino
Median household income ($) - American Indian and Alaska Native
Median household income ($) - Multirace
Median household income ($) - Other Race
Mortgage status - with mortgage (%)
Mortgage status - with second mortgage (%)
Mortgage status - with home equity loan (%)
Mortgage status - with both second mortgage and home equity loan (%)
Mortgage status - without a mortgage (%)
Median year house/condo built
Median year apartment built
Household type by relationship - Male householder living alone (%)
Household type by relationship - Male householder not living alone (%)
Household type by relationship - Female householder living alone (%)
Household type by relationship - Female householder not living alone (%)
Household type by relationship - Opposite-Sex spouse (%)
Household type by relationship - Same-Sex spouse (%)
Household type by relationship - Opposite-Sex unmarried partner (%)
Household type by relationship - Same-Sex unmarried partner (%)
Household type by relationship - In group quarters (%)
Size of family households - 2-person household (%)
Size of family households - 3-person household (%)
Size of family households - 4-person household (%)
Size of family households - 5-person household (%)
Size of family households - 6-person household (%)
Size of family households - 7-or-more-person household (%)
Size of nonfamily households - 1-person household (%)
Size of nonfamily households - 2-person household (%)
Size of nonfamily households - 3-person household (%)
Size of nonfamily households - 4-person household (%)
Size of nonfamily households - 5-person household (%)
Size of nonfamily households - 6-person household (%)
Size of nonfamily households - 7-or-moreperson household (%)
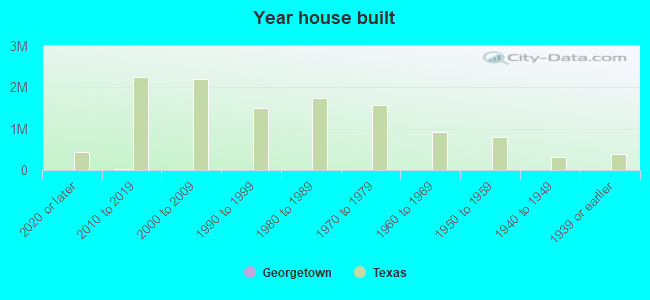
Year house built - Built 2010 or later (%)
Year house built - Built 2000 to 2009 (%)
Year house built - Built 1990 to 1999 (%)
Year house built - Built 1980 to 1989 (%)
Year house built - Built 1970 to 1979 (%)
Year house built - Built 1960 to 1969 (%)
Year house built - Built 1950 to 1959 (%)
Year house built - Built 1940 to 1949 (%)
Year house built - Built 1939 or earlier (%)
Median number of rooms in houses and condos
Median number of rooms in apartments
Median number of bedrooms in owner occupied houses
Mean number of bedrooms in owner occupied houses
Median number of bedrooms in renter occupied houses
Mean number of bedrooms in renter occupied houses
Median number of vehichles in owner occupied houses
Mean number of vehichles in owner occupied houses
Median number of vehichles in renter occupied houses
Mean number of vehichles in renter occupied houses
Rooms in owner-occupied houses - 1 room (%)
Rooms in owner-occupied houses - 2 rooms (%)
Rooms in owner-occupied houses - 3 rooms (%)
Rooms in owner-occupied houses - 4 rooms (%)
Rooms in owner-occupied houses - 5 rooms (%)
Rooms in owner-occupied houses - 6 rooms (%)
Rooms in owner-occupied houses - 7 rooms (%)
Rooms in owner-occupied houses - 8 rooms (%)
Rooms in owner-occupied houses - 9+ rooms (%)
Rooms in renter-occupied houses - 1 room (%)
Rooms in renter-occupied houses - 2 rooms (%)
Rooms in renter-occupied houses - 3 rooms (%)
Rooms in renter-occupied houses - 4 rooms (%)
Rooms in renter-occupied houses - 5 rooms (%)
Rooms in renter-occupied houses - 6 rooms (%)
Rooms in renter-occupied houses - 7 rooms (%)
Rooms in renter-occupied houses - 8 rooms (%)
Rooms in renter-occupied houses - 9+ rooms (%)
Bedrooms in owner-occupied houses - no bedrooms (%)
Bedrooms in owner-occupied houses - 1 bedroom (%)
Bedrooms in owner-occupied houses - 2 bedrooms (%)
Bedrooms in owner-occupied houses - 3 bedrooms (%)
Bedrooms in owner-occupied houses - 4 bedrooms (%)
Bedrooms in owner-occupied houses - 5+ bedrooms (%)
Bedrooms in renter-occupied houses - no bedrooms (%)
Bedrooms in renter-occupied houses - 1 bedroom (%)
Bedrooms in renter-occupied houses - 2 bedrooms (%)
Bedrooms in renter-occupied houses - 3 bedrooms (%)
Bedrooms in renter-occupied houses - 4 bedrooms (%)
Bedrooms in renter-occupied houses - 5+ bedrooms (%)
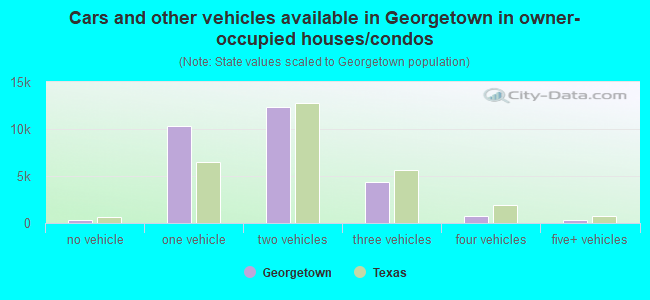
Vehicles available in owner-occupied houses - no vehicle available (%)
Vehicles available in owner-occupied houses - 1 vehicle available(%)
Vehicles available in owner-occupied houses - 2 Vehicles available (%)
Vehicles available in owner-occupied houses - 3 Vehicles available (%)
Vehicles available in owner-occupied houses - 4 Vehicles available (%)
Vehicles available in owner-occupied houses - 5+ Vehicles available (%)
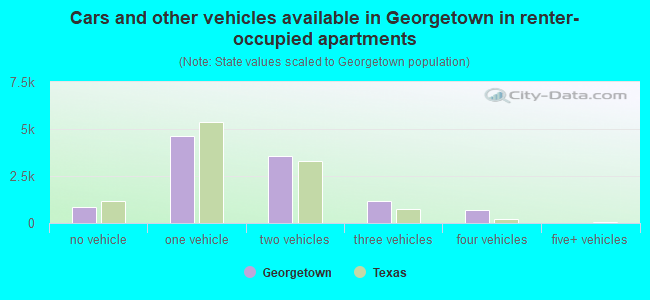
Vehicles available in renter-occupied houses - no vehicle available (%)
Vehicles available in renter-occupied houses - 1 vehicle available (%)
Vehicles available in renter-occupied houses - 2 Vehicles available (%)
Vehicles available in renter-occupied houses - 3 Vehicles available (%)
Vehicles available in renter-occupied houses - 4 Vehicles available (%)
Vehicles available in renter-occupied houses - 5+ Vehicles available (%)
Housing units in structures - 1, detached (%)
Housing units in structures - 1, attached (%)
Housing units in structures - 2 (%)
Housing units in structures - 3 or 4 (%)
Housing units in structures - 5 to 9 (%)
Housing units in structures - 10 to 19 (%)
Housing units in structures - 20 to 49 (%)
Housing units in structures - 50 or more (%)
Housing units in structures - Mobile home (%)
Housing units in structures - Boat, RV, van, etc. (%)
Housing units in structures - Owners - 1, detached (%)
Housing units in structures - Owners - 1, attached (%)
Housing units in structures - Owners - 2 (%)
Housing units in structures - Owners - 3 or 4 (%)
Housing units in structures - Owners - 5 to 9 (%)
Housing units in structures - Owners - 10 to 19 (%)
Housing units in structures - Owners - 20 to 49 (%)
Housing units in structures - Owners - 50 or more (%)
Housing units in structures - Owners - Mobile home (%)
Housing units in structures - Owners - Boat, RV, van, etc. (%)
Housing units in structures - Renters - 1, detached (%)
Housing units in structures - Renters - 1, attached (%)
Housing units in structures - Renters - 2 (%)
Housing units in structures - Renters - 3 or 4 (%)
Housing units in structures - Renters - 5 to 9 (%)
Housing units in structures - Renters - 10 to 19 (%)
Housing units in structures - Renters - 20 to 49 (%)
Housing units in structures - Renters - 50 or more (%)
Housing units in structures - Renters - Mobile home (%)
Housing units in structures - Renters - Boat, RV, van, etc. (%)
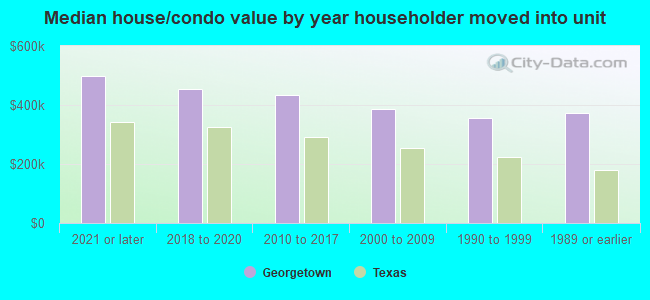
House/condo owner moved in on average (years ago)
Renter moved in on average (years ago)
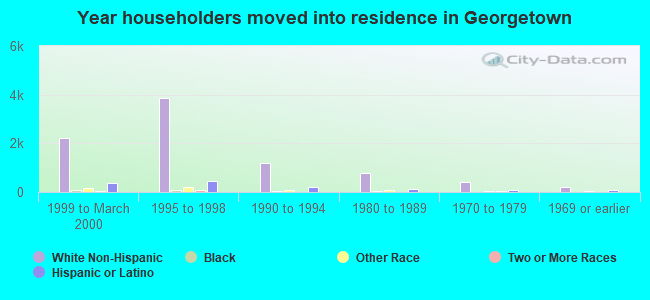
Year householder moved into unit - Moved in 1999 to March 2000 (%)
Year householder moved into unit - Moved in 1999 to March 2000 (%) - White
Year householder moved into unit - Moved in 1999 to March 2000 (%) - Black or African American
Year householder moved into unit - Moved in 1999 to March 2000 (%) - Asian
Year householder moved into unit - Moved in 1999 to March 2000 (%) - Hispanic or Latino
Year householder moved into unit - Moved in 1999 to March 2000 (%) - American Indian and Alaska Native
Year householder moved into unit - Moved in 1999 to March 2000 (%) - Multirace
Year householder moved into unit - Moved in 1999 to March 2000 (%) - Other Race
Year householder moved into unit - Moved in 1995 to 1998 (%)
Year householder moved into unit - Moved in 1995 to 1998 (%) - White
Year householder moved into unit - Moved in 1995 to 1998 (%) - Black or African American
Year householder moved into unit - Moved in 1995 to 1998 (%) - Asian
Year householder moved into unit - Moved in 1995 to 1998 (%) - Hispanic or Latino
Year householder moved into unit - Moved in 1995 to 1998 (%) - American Indian and Alaska Native
Year householder moved into unit - Moved in 1995 to 1998 (%) - Multirace
Year householder moved into unit - Moved in 1995 to 1998 (%) - Other Race
Year householder moved into unit - Moved in 1990 to 1994 (%)
Year householder moved into unit - Moved in 1990 to 1994 (%) - White
Year householder moved into unit - Moved in 1990 to 1994 (%) - Black or African American
Year householder moved into unit - Moved in 1990 to 1994 (%) - Asian
Year householder moved into unit - Moved in 1990 to 1994 (%) - Hispanic or Latino
Year householder moved into unit - Moved in 1990 to 1994 (%) - American Indian and Alaska Native
Year householder moved into unit - Moved in 1990 to 1994 (%) - Multirace
Year householder moved into unit - Moved in 1990 to 1994 (%) - Other Race
Year householder moved into unit - Moved in 1980 to 1989 (%)
Year householder moved into unit - Moved in 1980 to 1989 (%) - White
Year householder moved into unit - Moved in 1980 to 1989 (%) - Black or African American
Year householder moved into unit - Moved in 1980 to 1989 (%) - Asian
Year householder moved into unit - Moved in 1980 to 1989 (%) - Hispanic or Latino
Year householder moved into unit - Moved in 1980 to 1989 (%) - American Indian and Alaska Native
Year householder moved into unit - Moved in 1980 to 1989 (%) - Multirace
Year householder moved into unit - Moved in 1980 to 1989 (%) - Other Race
Year householder moved into unit - Moved in 1970 to 1979 (%)
Year householder moved into unit - Moved in 1970 to 1979 (%) - White
Year householder moved into unit - Moved in 1970 to 1979 (%) - Black or African American
Year householder moved into unit - Moved in 1970 to 1979 (%) - Asian
Year householder moved into unit - Moved in 1970 to 1979 (%) - Hispanic or Latino
Year householder moved into unit - Moved in 1970 to 1979 (%) - American Indian and Alaska Native
Year householder moved into unit - Moved in 1970 to 1979 (%) - Multirace
Year householder moved into unit - Moved in 1970 to 1979 (%) - Other Race
Year householder moved into unit - Moved in 1969 or earlier (%)
Year householder moved into unit - Moved in 1969 or earlier (%) - White
Year householder moved into unit - Moved in 1969 or earlier (%) - Black or African American
Year householder moved into unit - Moved in 1969 or earlier (%) - Asian
Year householder moved into unit - Moved in 1969 or earlier (%) - Hispanic or Latino
Year householder moved into unit - Moved in 1969 or earlier (%) - American Indian and Alaska Native
Year householder moved into unit - Moved in 1969 or earlier (%) - Multirace
Year householder moved into unit - Moved in 1969 or earlier (%) - Other Race
Housing units lacking complete plumbing facilities (%)
Housing units lacking complete kitchen facilities (%)
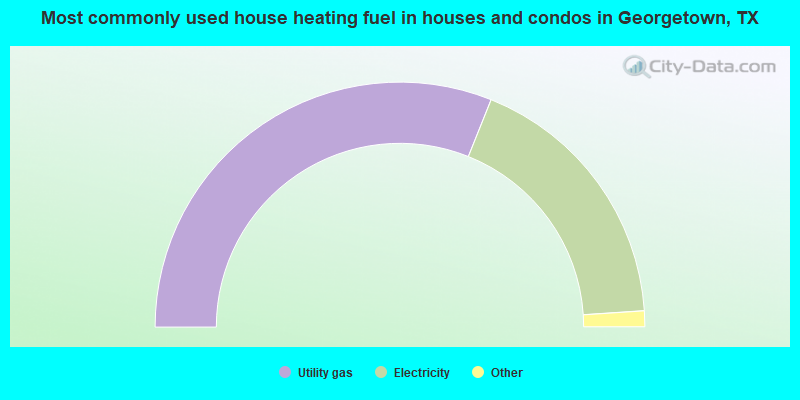
House heating fuel used in houses and condos - Utility gas (%)
House heating fuel used in houses and condos - Bottled, tank, or LP gas (%)
House heating fuel used in houses and condos - Electricity (%)
House heating fuel used in houses and condos - Fuel oil, kerosene, etc. (%)
House heating fuel used in houses and condos - Coal or coke (%)
House heating fuel used in houses and condos - Wood (%)
House heating fuel used in houses and condos - Solar energy (%)
House heating fuel used in houses and condos - Other fuel (%)
House heating fuel used in houses and condos - No fuel used (%)
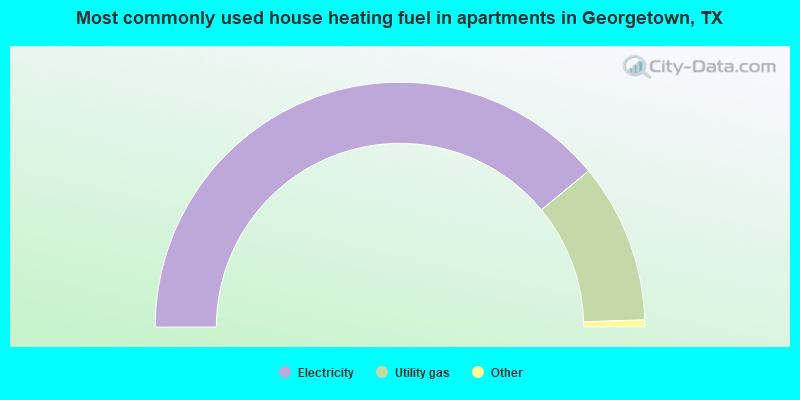
House heating fuel used in apartments - Utility gas (%)
House heating fuel used in apartments - Bottled, tank, or LP gas (%)
House heating fuel used in apartments - Electricity (%)
House heating fuel used in apartments - Fuel oil, kerosene, etc. (%)
House heating fuel used in apartments - Coal or coke (%)
House heating fuel used in apartments - Wood (%)
House heating fuel used in apartments - Solar energy (%)
House heating fuel used in apartments - Other fuel (%)
House heating fuel used in apartments - No fuel used (%)
Latest news about housing in Georgetown, TX collected exclusively by city-data.com from local newspapers, TV, and radio stations
Median year house/condo built: 2008Median year apartment built: 2009Household type by relationship:
Households: 86,505
Male householders: 17,656 (4,256 living alone ), Female householders: 21,454 (9,123 living alone )20,589 spouses (20,453 opposite-sex spouses ), 1,855 unmarried partners , (1,712 opposite-sex unmarried partners ), 19,347 children (18,021 natural , 0 adopted , 1,326 stepchildren ), 742 grandchildren , 236 brothers or sisters , 605 parents , 0 foster children , 262 other relatives , 1,739 non-relatives In group quarters: 2,020
Size of family households: 14,363 2-persons , 3,586 3-persons , 2,422 4-persons , 2,002 5-persons , 632 6-persons , 227 7-or-more-persons .
Size of nonfamily households: 13,379 1-person , 2,375 2-persons , 124 3-persons .
10,351 married couples with children. single-parent households (929 men , 2,265 women ).
82.7% of residents of Georgetown speak English at home. of residents speak Spanish at home (72% speak English very well , 16% speak English well , 8% speak English not well , 5% don't speak English at all ).of residents speak other Indo-European language at home (80% speak English very well , 12% speak English well , 8% speak English not well ).of residents speak Asian or Pacific Island language at home (81% speak English very well , 12% speak English well , 8% speak English not well ).of residents speak other language at home (88% speak English very well , 12% speak English well ).
Foreign born population: 8,342 (9.6%)of them are naturalized citizens )
Median number of rooms in houses and condos:
Median number of rooms in apartments
Owner-occupied Renter-occupied
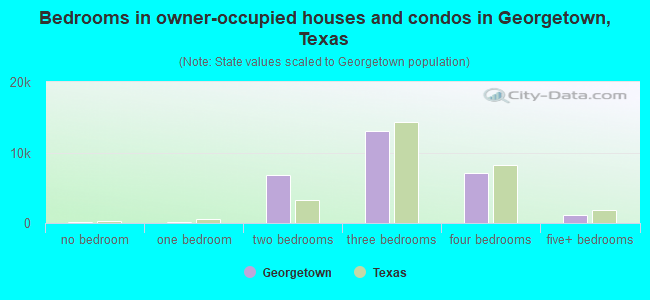
Bedrooms in owner-occupied houses and condos in Georgetown, Texas
96 no bedroom 201 1 bedroom 6,843 2 bedrooms 13,025 3 bedrooms 7,044 4 bedrooms 1,068 5+ bedrooms
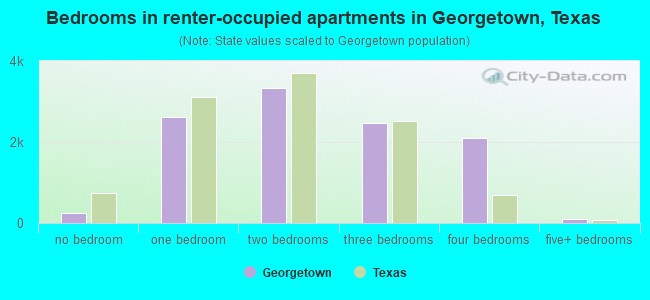
Bedrooms in renter-occupied apartments in Georgetown, Texas
237 no bedroom 2,617 1 bedroom 3,336 2 bedrooms 2,457 3 bedrooms 2,089 4 bedrooms 97 5+ bedrooms
Owner-occupied Renter-occupied
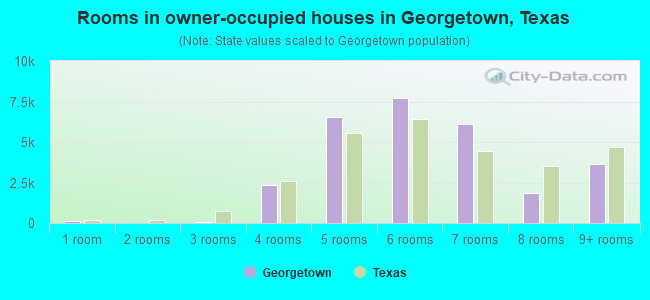
Rooms in owner-occupied houses in Georgetown, Texas
96 1 room 0 2 rooms 83 3 rooms 2,316 4 rooms 6,540 5 rooms 7,688 6 rooms 6,110 7 rooms 1,827 8 rooms 3,617 9+ rooms
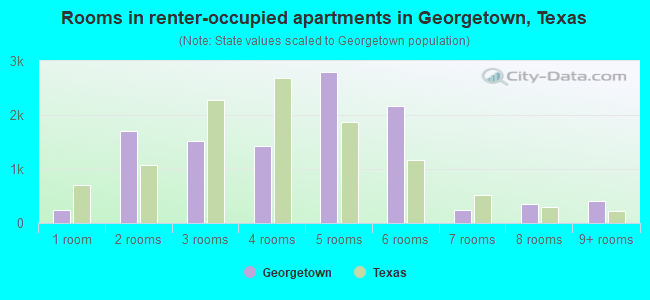
Rooms in renter-occupied apartments in Georgetown, Texas
237 1 room 1,704 2 rooms 1,510 3 rooms 1,428 4 rooms 2,788 5 rooms 2,158 6 rooms 246 7 rooms 346 8 rooms 416 9+ rooms
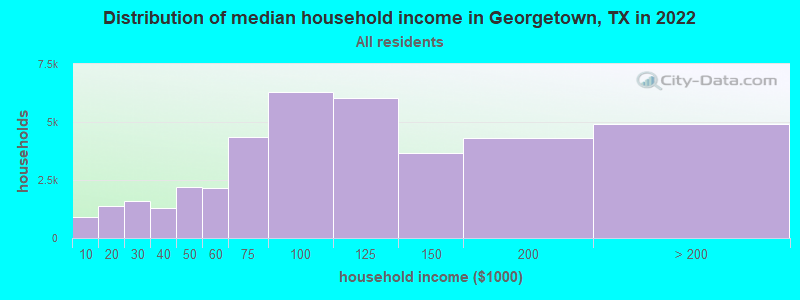
Georgetown, TX household income distribution 916 Less than $10,0001,388 $10,000 to $19,9991,596 $20,000 to $29,9991,300 $30,000 to $39,9992,211 $40,000 to $49,9992,163 $50,000 to $59,9994,352 $60,000 to $74,9996,293 $75,000 to $99,9996,020 $100,000 to $124,9993,652 $125,000 to $149,9994,293 $150,000 to $199,9994,926 $200,000 or more
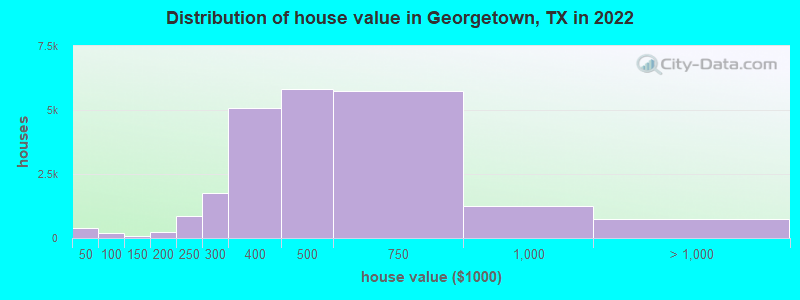
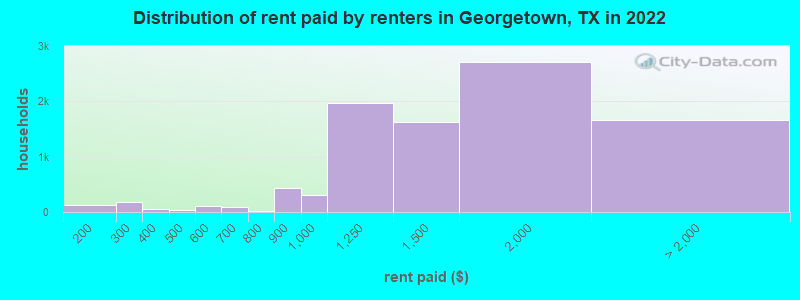
Home value of owner - occupied houses in 2022 in Georgetown, TX 128 Less than $10,00017 $20,000 to $24,999125 $25,000 to $29,99976 $30,000 to $34,99942 $35,000 to $39,9998 $40,000 to $49,99971 $50,000 to $59,99929 $60,000 to $69,9998 $80,000 to $89,99983 $90,000 to $99,99974 $100,000 to $124,9999 $125,000 to $149,999131 $150,000 to $174,999106 $175,000 to $199,999873 $200,000 to $249,9991,766 $250,000 to $299,9995,095 $300,000 to $399,9995,823 $400,000 to $499,9995,739 $500,000 to $749,9991,252 $750,000 to $999,999457 $1,000,000 to $1,499,99942 $1,500,000 to $1,999,999253 $2,000,000 or moreRent paid by renters in 2022 in Georgetown, TX 26 $100 to $14991 $150 to $19973 $200 to $249112 $250 to $29921 $300 to $34925 $350 to $39925 $400 to $44916 $450 to $49964 $500 to $54947 $550 to $59994 $600 to $64913 $750 to $799425 $800 to $899302 $900 to $9991,973 $1,000 to $1,2491,627 $1,250 to $1,4992,703 $1,500 to $1,999759 $2,000 to $2,499281 $2,500 to $2,99965 $3,000 to $3,499354 $3,500 or more194 No cash rent
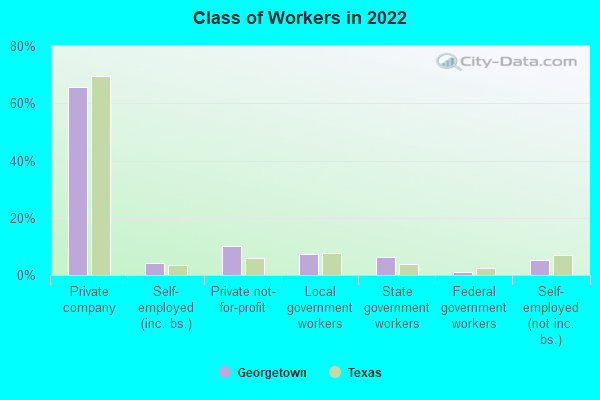
Percentage of workers working in this county: 74.3%Number of people working at home: 8,312 (24.6% of all workers )
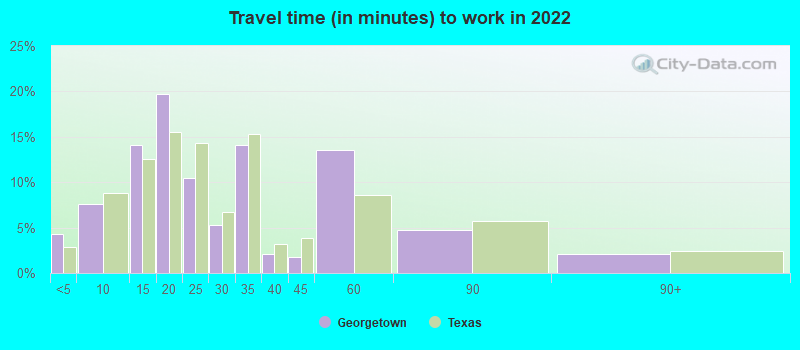
Travel time to work (commute)
Less than 5 minutes: 6685 to 9 minutes: 2,16210 to 14 minutes: 2,89215 to 19 minutes: 4,87120 to 24 minutes: 3,25225 to 29 minutes: 1,82930 to 34 minutes: 3,68335 to 39 minutes: 1,93440 to 44 minutes: 1,41545 to 59 minutes: 6,22660 to 89 minutes: 99590 or more minutes: 1,199
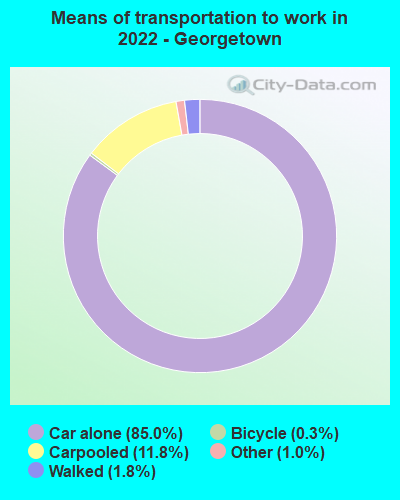
Means of transportation to work:
Drove a car alone: 26,251 (65.3%)Carpooled: 2,963 (7.4%)Bus : 8 (0.0%)Ferryboat: 12 (0.0%)Taxi: 432 (1.1%)Bicycle: 76 (0.2%)Walked: 696 (1.7%)Worked at home: 8,312 (20.7%)
Unemployment by race in 2022
Unemployment rate for White non-Hispanic residents 1.5% Males2.0% FemalesUnemployment rate for Black residents 7.8% Males10.7% FemalesUnemployment rate for Asian residents 2.7% FemalesUnemployment rate for other race residents 0.3% FemalesUnemployment rate for two or more race residents 5.9% Males2.1% FemalesUnemployment rate for Hispanic or Latino residents 2.8% Males2.1% Females
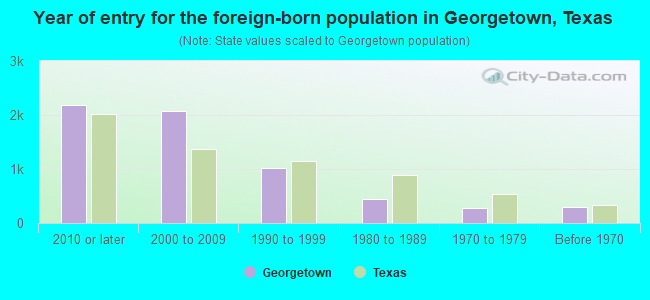
Year of entry for the foreign-born population in Georgetown, Texas
2,184 2010 or later 2,077 2000 to 2009 1,016 1990 to 1999 441 1980 to 1989 283 1970 to 1979 303 Before 1970
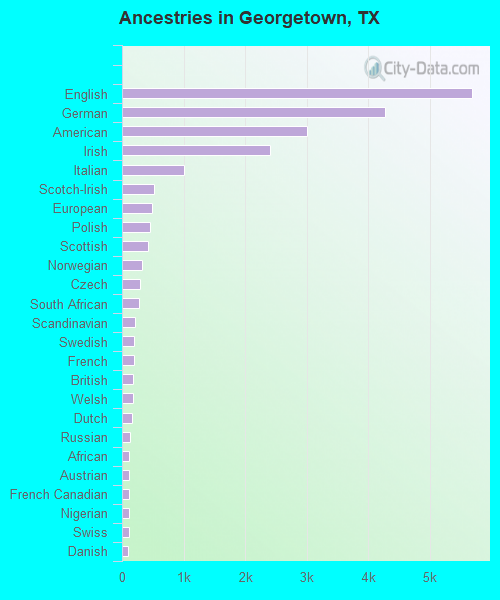
First ancestries reported:
English: 5,675 (16.3%)
German: 4,275 (12.3%)
American: 3,011 (8.6%)
Irish: 2,402 (6.9%)
Italian: 1,009 (2.9%)
Scotch-Irish: 525 (1.5%)
European: 493 (1.4%)
Polish: 456 (1.3%)
Scottish: 428 (1.2%)
Norwegian: 320 (0.9%)
Czech: 290 (0.8%)
South African: 270 (0.8%)
Scandinavian: 211 (0.6%)
Swedish: 202 (0.6%)
French: 201 (0.6%)
British: 175 (0.5%)
Welsh: 175 (0.5%)
Dutch: 164 (0.5%)
Russian: 136 (0.4%)
African: 121 (0.3%)
Austrian: 120 (0.3%)
French Canadian: 116 (0.3%)
Nigerian: 111 (0.3%)
Swiss: 109 (0.3%)
Danish: 90 (0.3%)
Canadian: 79 (0.2%)
Eastern European: 71 (0.2%)
Greek: 69 (0.2%)
Portuguese: 68 (0.2%)
Liberian: 59 (0.2%)
Czechoslovakian: 51 (0.1%)
Northern European: 48 (0.1%)
Hungarian: 31 (0.09%)
Brazilian: 30 (0.09%)
Lebanese: 21 (0.06%)
Slovene: 21 (0.06%)
Slovak: 18 (0.05%)
Croatian: 17 (0.05%)
Arab: 17 (0.05%)
Ukrainian: 15 (0.04%)
Trinidadian and Tobagonian: 15 (0.04%)
Belgian: 10 (0.03%)
Turkish: 10 (0.03%)
Iranian: 6 (0.02%)
Finnish: 4 (0.01%) Most common places of birth for foreign-born residents (%): Mexico Georgetown:
36.4% (2,267)Texas:
48.4% (2,411,723)
Germany Georgetown:
5.3% (329)Texas:
0.8% (37,989)
South Africa Georgetown:
5.0% (314)Texas:
0.2% (11,402)
Philippines Georgetown:
4.4% (272)Texas:
2.1% (103,148)
Korea Georgetown:
4.2% (263)Texas:
1.2% (60,172)
India Georgetown:
3.5% (217)Texas:
6.1% (306,347)
Colombia Georgetown:
2.9% (178)Texas:
1.2% (61,555)
Nigeria Georgetown:
2.7% (167)Texas:
1.9% (96,110)
Ecuador Georgetown:
2.3% (145)Texas:
0.2% (12,456)
China, excluding Hong Kong and Taiwan Georgetown:
2.1% (131)Texas:
2.3% (115,558)
Canada Georgetown:
2.0% (127)Texas:
1.1% (55,371)
United Kingdom, excluding England and Scotland Georgetown:
1.9% (121)Texas:
0.5% (26,969)
Russia Georgetown:
1.6% (101)Texas:
0.3% (16,984)
Place of birth for U.S.-born residents:
This state: 36,304Other state: 40,629Northeast: 6,716Midwest: 13,480South: 7,294West: 13,139 80.8% of Georgetown residents lived in the same house 1 years ago.
Out of people who lived in different houses, 30.8% lived in this county.
Out of people who lived in different counties, 61.9% lived in Texas.
Georgetown:
80.8%State average:
85.7%
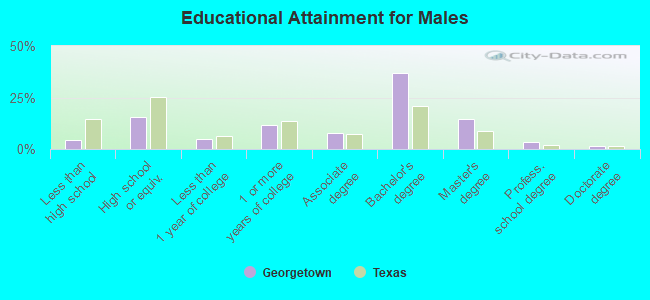
Education attainment for males 25 years and older:
No schooling: 159Nursery to 4th grade: 1395th and 6th grade: 5217th and 8th grade: 2379th grade: 9010th grade: 011th grade: 012th grade, no diploma: 140High school graduate (or equivalency): 4,694Less than 1 year of college: 1,419Some college more than 1 year, no degree: 3,516Associate degree: 2,389Bachelor's degree: 11,286Master's degree: 4,406Professional school degree: 1,018Doctorate degree: 393
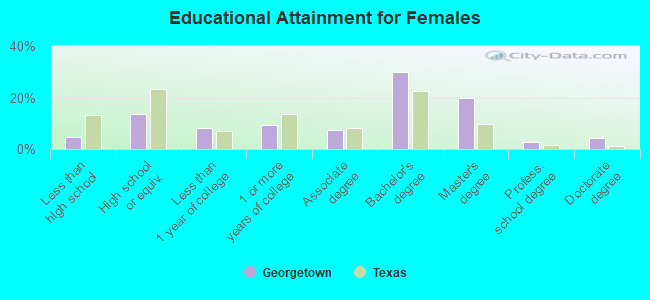
Education attainment for females 25 years and older:
No schooling: 260Nursery to 4th grade: 1565th and 6th grade: 2207th and 8th grade: 2259th grade: 20310th grade: 8111th grade: 012th grade, no diploma: 451High school graduate (or equivalency): 4,663Less than 1 year of college: 2,788Some college more than 1 year, no degree: 3,218Associate degree: 2,453Bachelor's degree: 10,161Master's degree: 6,714Professional school degree: 964Doctorate degree: 1,399
Housing units in structures:
One, detached: 31,579One, attached: 1,396Two: 5513 or 4: 1,0975 to 9: 1,25010 to 19: 1,34320 to 49: 61650 or more: 1,987Mobile homes: 466Median worth of mobile homes: $55,800
Housing units lacking complete plumbing facilities in 2022: 0.5%Housing units lacking complete kitchen facilities in 2022: 0.5%House/condo owner moved in on average 5 years ago
Renter moved in on average 0 years ago
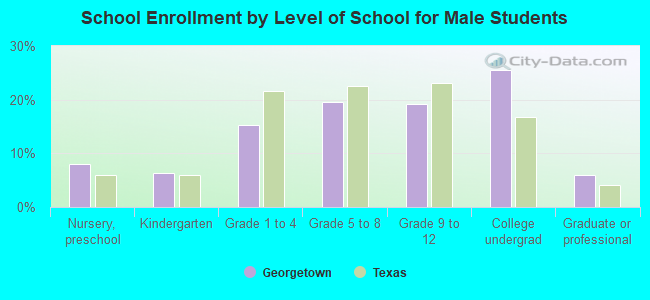
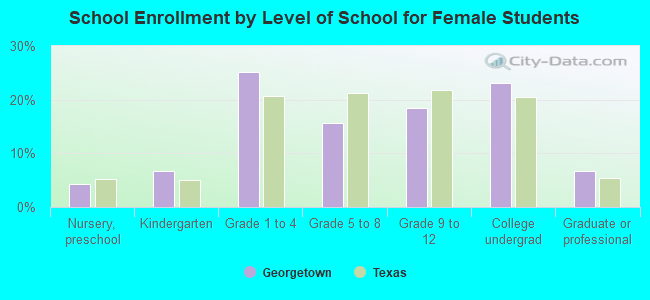
Private vs. public school enrollment:
Students in private schools in grades 1 to 8 (elementary and middle school): 499 Students in private schools in grades 9 to 12 (high school): 69 Students in private undergraduate colleges: 1,178