Fredericksburg, VA (Virginia) Houses and Residents
| Fredericksburg: | $471,815 |
| Virginia: | $365,700 |
Mean price in 2022:
Detached houses: $482,093
Here: $482,093 State: $472,865 Townhouses or other attached units: $438,932
Here: $438,932 State: $457,437 In 5-or-more-unit structures: $384,422
Here: $384,422 State: $382,551 Mobile homes: $67,249
Here: $67,249 State: $100,736
Total population: 28,350 (Urban population: 19,199, Rural population: 80 (all nonfarm))
Houses: 12,318 (11,462 occupied: 4,455 owner occupied, 7,131 renter occupied)
| % of renters here: | 62% |
| State: | 33% |
Housing density: 1,171 houses/condos per square mile
Median price asked for vacant for-sale houses and condos in 2022: $2,585,030.
Median contract rent in 2022: $1,342 (lower quartile is $1,038, upper quartile is $1,711)
Median rent asked for vacant for-rent units in 2022: $1,781
Median gross rent in Fredericksburg, VA in 2022: $1,463
Housing units in Fredericksburg with a mortgage: 3,187 (222 second mortgage, 0 home equity loan, 188 both second mortgage and home equity loan)
Houses without a mortgage: 95
Median household income for houses/condos with a mortgage: $154,134
Median household income for apartments without a mortgage: $86,746
Median monthly housing costs: $1,531
Compare current foreclosures in Fredericksburg, VA:
| Photo | Address | Area | Beds / Baths | Price | Details |
|---|---|---|---|---|---|

|
#1
Marye St
Fredericksburg, VA 22401
|
1,872 sq. feet
|
2 baths 4 beds |
$590,000
|
show details |

|
#2
Brock Sq
Fredericksburg, VA 22401
|
1,142 sq. feet
|
1 baths 3 beds |
show details | |

|
#3
Guilderland Ct
Fredericksburg, VA 22408
|
1,116 sq. feet
|
3 baths 2 beds |
show details | |

|
#4
Skinner Hill Dr
Fredericksburg, VA 22408
|
1,743 sq. feet
|
1 baths 2 beds |
show details | |

|
#5
Lynchester Dr
Fredericksburg, VA 22406
|
4,437 sq. feet
|
3 baths 4 beds |
show details | |

|
#6
W Midland Way
Fredericksburg, VA 22408
|
1,247 sq. feet
|
1 baths 2 beds |
show details | |

|
#7
Harris Mill Ct
Fredericksburg, VA 22408
|
2,938 sq. feet
|
3 baths 5 beds |
show details | |

|
#8
Sugargrove Dr
Fredericksburg, VA 22406
|
1,202 sq. feet
|
2 baths 2 beds |
show details | |

|
#9
Gallimore Dr
Fredericksburg, VA 22407
|
1,524 sq. feet
|
1 baths 3 beds |
show details | |

|
#10
Brimstone Dr
Fredericksburg, VA 22407
|
1,040 sq. feet
|
1 baths 2 beds |
show details |
| Photo | Address | Area | Beds / Baths | Price | Details |
|---|---|---|---|---|---|

|
#11
Arbor Glen Dr
Fredericksburg, VA 22407
|
2,014 sq. feet
|
3 baths 4 beds |
show details | |

|
#12
Finch Ln
Fredericksburg, VA 22407
|
1,534 sq. feet
|
3 baths 3 beds |
show details | |

|
#13
Cornwall Ct
Fredericksburg, VA 22408
|
1,926 sq. feet
|
3 baths 4 beds |
show details | |

|
#14
Dewberry Dr
Fredericksburg, VA 22407
|
1,295 sq. feet
|
2 baths 3 beds |
show details | |

|
#15
Cannonball Ct
Fredericksburg, VA 22408
|
2,745 sq. feet
|
4 baths 4 beds |
show details | |

|
#16
Trisler Dr
Fredericksburg, VA 22407
|
1,128 sq. feet
|
2 baths 3 beds |
show details | |

|
#17
Sandwedge Ct
Fredericksburg, VA 22408
|
2,400 sq. feet
|
3 baths 3 beds |
show details | |

|
#18
Enchanted Ct
Fredericksburg, VA 22407
|
2,906 sq. feet
|
3 baths 4 beds |
show details | |

|
#19
Minnear St
Fredericksburg, VA 22407
|
1,144 sq. feet
|
3 baths 2 beds |
show details | |

|
#20
Clint Ln
Fredericksburg, VA 22405
|
2,280 sq. feet
|
2 baths 4 beds |
show details |
| Photo | Address | Area | Beds / Baths | Price | Details |
|---|---|---|---|---|---|

|
#21
Bartley Ct
Fredericksburg, VA 22408
|
1,796 sq. feet
|
3 baths 3 beds |
show details | |

|
#22
Matti Hill Ct
Fredericksburg, VA 22408
|
1,534 sq. feet
|
3 baths 2 beds |
show details | |

|
#23
Airport Ave
Fredericksburg, VA 22401
|
1,280 sq. feet
|
2 baths 3 beds |
show details | |

|
#24
Willow Point Dr
Fredericksburg, VA 22408
|
4,866 sq. feet
|
4 baths 4 beds |
show details | |

|
#25
Cedar Ridge Dr
Fredericksburg, VA 22407
|
1,824 sq. feet
|
3 baths 3 beds |
show details | |

|
#26
Cavalry Ridge Rd
Fredericksburg, VA 22405
|
2,342 sq. feet
|
2 baths 4 beds |
show details | |

|
#27
Brigadier Dr
Fredericksburg, VA 22401
|
2,592 sq. feet
|
3 baths 4 beds |
show details | |

|
#28
Minnear St
Fredericksburg, VA 22407
|
1,144 sq. feet
|
3 baths 2 beds |
show details | |

|
#29
N Katie Dr
Fredericksburg, VA 22407
|
2,671 sq. feet
|
3 baths 4 beds |
show details | |

|
#30
Clint Ln
Fredericksburg, VA 22405
|
1,744 sq. feet
|
1 baths 3 beds |
show details |
| Photo | Address | Area | Beds / Baths | Price | Details |
|---|---|---|---|---|---|

|
#31
Rosemont Ln
Fredericksburg, VA 22408
|
1,561 sq. feet
|
2 baths 3 beds |
show details | |

|
#32
Greenvale Rd
Fredericksburg, VA 22407
|
1,248 sq. feet
|
2 baths 3 beds |
show details | |

|
#33
Bradenton Ct
Fredericksburg, VA 22407
|
4,103 sq. feet
|
4 baths 3 beds |
show details | |

|
#34
Manning Dr
Fredericksburg, VA 22405
|
1,528 sq. feet
|
2 baths 3 beds |
show details | |

|
#35
Hickory Hill Dr
Fredericksburg, VA 22408
|
1,728 sq. feet
|
3 baths 3 beds |
show details | |

|
#36
Piedmont Landing Dr
Fredericksburg, VA 22407
|
2,283 sq. feet
|
3 baths 3 beds |
show details | |

|
#37
Windridge Dr
Fredericksburg, VA 22407
|
1,416 sq. feet
|
3 baths 3 beds |
show details | |

|
#38
Bedford Ct
Fredericksburg, VA 22408
|
2,342 sq. feet
|
3 baths 4 beds |
show details | |

|
#39
Little Whim Rd
Fredericksburg, VA 22405
|
2,073 sq. feet
|
3 baths 3 beds |
show details | |

|
#40
River Walk St
Fredericksburg, VA 22401
|
2,868 sq. feet
|
3 baths 4 beds |
show details |
| Photo | Address | Area | Beds / Baths | Price | Details |
|---|---|---|---|---|---|

|
#41
Massaponax Church Rd
Fredericksburg, VA 22408
|
2,498 sq. feet
|
2 baths 3 beds |
show details | |

|
#42
Warwick Pl
Fredericksburg, VA 22408
|
1,116 sq. feet
|
2 baths 3 beds |
show details | |

|
#43
Dabney Ct
Fredericksburg, VA 22408
|
2,239 sq. feet
|
3 baths 4 beds |
show details | |

|
#44
Brushy Creek Cir
Fredericksburg, VA 22406
|
3,456 sq. feet
|
3 baths 4 beds |
show details | |

|
#45
Hanover St
Fredericksburg, VA 22401
|
1,224 sq. feet
|
1 baths 2 beds |
show details | |

|
#46
N Hampton Ln
Fredericksburg, VA 22408
|
1,996 sq. feet
|
2 baths 4 beds |
show details | |

|
#47
Ponderosa Pl
Fredericksburg, VA 22405
|
1,188 sq. feet
|
2 baths 3 beds |
show details | |

|
#48
Overlook Ct
Fredericksburg, VA 22405
|
1,804 sq. feet
|
2 baths 3 beds |
show details | |

|
#49
Wales Dr
Fredericksburg, VA 22407
|
1,632 sq. feet
|
3 baths 3 beds |
show details | |

|
Check over 1 million property listings on Foreclosure.com!
|
browse all offers | |||

Latest news about housing in Fredericksburg, VA collected exclusively by city-data.com from local newspapers, TV, and radio stations

 | Good Safe Apartments in Fredericksburg (1 reply) |
| Relocating to Fredericksburg, looking for apartment or small house (13 replies) |
| Downtown Fredericksburg Homes (3 replies) |
| Suggestions on Fredricksburg apartments? (0 replies) |
| Fredericksburg Apartments (3 replies) |
| Fredericksburg to NYC homesickness (23 replies) |

Median year apartment built: 1994
Household type by relationship:
Households: 28,451- Male householders: 5,540 (1,823 living alone), Female householders: 5,812 (2,195 living alone)
4,122 spouses (4,067 opposite-sex spouses), 1,008 unmarried partners, (957 opposite-sex unmarried partners), 7,288 children (7,029 natural, 37 adopted, 221 stepchildren), 645 grandchildren, 215 brothers or sisters, 140 parents, 0 foster children, 214 other relatives, 1,079 non-relatives
- In group quarters: 2,383
Size of family households: 2,816 2-persons, 1,222 3-persons, 1,092 4-persons, 276 5-persons, 488 6-persons, 115 7-or-more-persons.
Size of nonfamily households: 4,135 1-person, 1,389 2-persons, 113 3-persons, 24 5-persons, 5 7-or-more-persons.
2,756 married couples with children.
2,567 single-parent households (508 men, 2,059 women).
83.3% of residents of Fredericksburg speak English at home.
8.0% of residents speak Spanish at home (53% speak English very well, 21% speak English well, 26% speak English not well).
6.6% of residents speak other Indo-European language at home (54% speak English very well, 27% speak English well, 15% speak English not well, 4% don't speak English at all).
0.6% of residents speak Asian or Pacific Island language at home (45% speak English very well, 52% speak English well, 3% speak English not well).
1.1% of residents speak other language at home (70% speak English very well, 19% speak English well, 12% speak English not well).
Foreign born population: 3,241 (11.4%)
(37.0% of them are naturalized citizens)
| Here: | 7.7 |
| State: | 7.0 |
| Here: | 3.9 |
| State: | 4.3 |

- Bedrooms in owner-occupied houses and condos in Fredericksburg, Virginia
- 0no bedroom
- 681 bedroom
- 5562 bedrooms
- 1,7223 bedrooms
- 1,5154 bedrooms
- 5955+ bedrooms

- Bedrooms in renter-occupied apartments in Fredericksburg, Virginia
- 244no bedroom
- 2,0041 bedroom
- 2,7922 bedrooms
- 1,7853 bedrooms
- 2544 bedrooms
- 535+ bedrooms

- Cars and other vehicles available in Fredericksburg in owner-occupied houses/condos
- 152no vehicle
- 9181 vehicle
- 2,2322 vehicles
- 7533 vehicles
- 2024 vehicles
- 1985+ vehicles

- Cars and other vehicles available in Fredericksburg in renter-occupied apartments
- 919no vehicle
- 3,6551 vehicle
- 2,0502 vehicles
- 4443 vehicles
- 304 vehicles
- 345+ vehicles

- Rooms in owner-occupied houses in Fredericksburg, Virginia
- 01 room
- 162 rooms
- 483 rooms
- 1534 rooms
- 5745 rooms
- 4506 rooms
- 8727 rooms
- 6848 rooms
- 1,6579+ rooms

- Rooms in renter-occupied apartments in Fredericksburg, Virginia
- 2441 room
- 5152 rooms
- 1,7993 rooms
- 2,0254 rooms
- 1,3175 rooms
- 5436 rooms
- 4097 rooms
- 1478 rooms
- 1339+ rooms


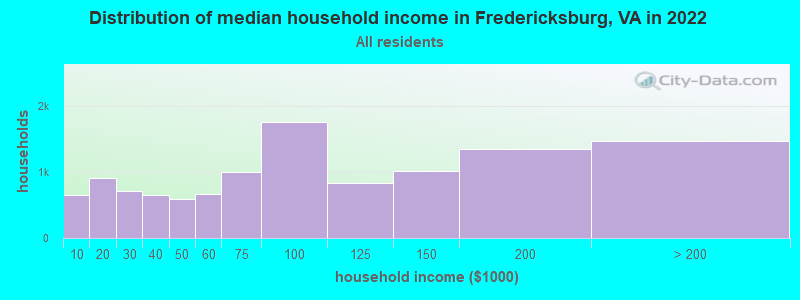
Fredericksburg, VA household income distribution

- 657Less than $10,000
- 904$10,000 to $19,999
- 704$20,000 to $29,999
- 648$30,000 to $39,999
- 593$40,000 to $49,999
- 672$50,000 to $59,999
- 1,001$60,000 to $74,999
- 1,756$75,000 to $99,999
- 829$100,000 to $124,999
- 1,011$125,000 to $149,999
- 1,349$150,000 to $199,999
- 1,471$200,000 or more
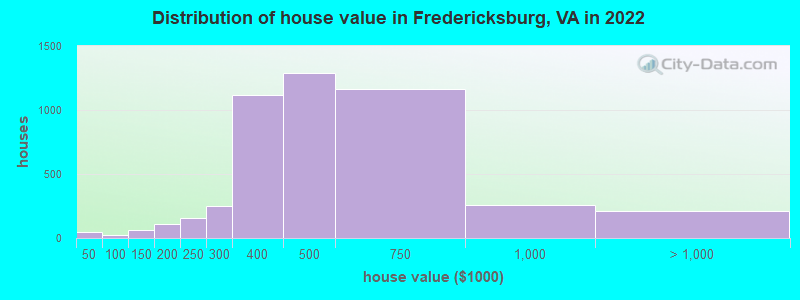
Home value of owner - occupied houses in 2022 in Fredericksburg, VA
-
- 26Less than $10,000
- 7$30,000 to $34,999
- 8$35,000 to $39,999
- 7$50,000 to $59,999
- 14$80,000 to $89,999
- 4$90,000 to $99,999
- 42$100,000 to $124,999
- 19$125,000 to $149,999
- 16$150,000 to $174,999
- 91$175,000 to $199,999
- 158$200,000 to $249,999
- 246$250,000 to $299,999
- 1,114$300,000 to $399,999
- 1,287$400,000 to $499,999
- 1,164$500,000 to $749,999
- 256$750,000 to $999,999
- 60$1,000,000 to $1,499,999
- 50$1,500,000 to $1,999,999
- 103$2,000,000 or more
Rent paid by renters in 2022 in Fredericksburg, VA
-
- 34Less than $100
- 29$100 to $149
- 84$150 to $199
- 278$200 to $249
- 77$250 to $299
- 49$300 to $349
- 71$350 to $399
- 70$400 to $449
- 83$450 to $499
- 69$500 to $549
- 2$550 to $599
- 23$600 to $649
- 108$650 to $699
- 16$700 to $749
- 50$750 to $799
- 74$800 to $899
- 388$900 to $999
- 1,430$1,000 to $1,249
- 1,603$1,250 to $1,499
- 1,396$1,500 to $1,999
- 831$2,000 to $2,499
- 63$2,500 to $2,999
- 12$3,000 to $3,499
- 24$3,500 or more
- 141No cash rent


Percentage of workers working in this county: 45.0%
Number of people working at home: 2,264 (15.6% of all workers)
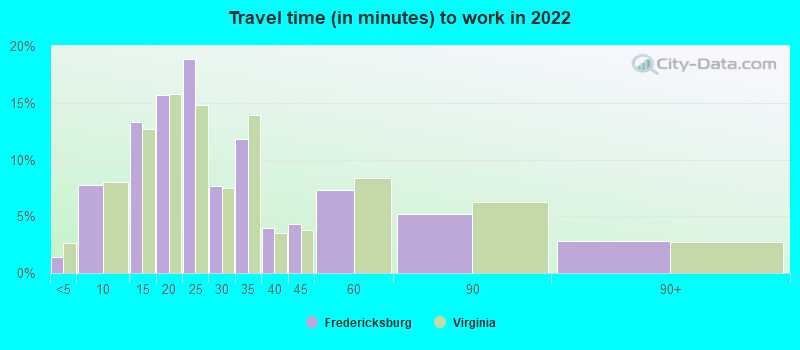
Travel time to work (commute)
- Less than 5 minutes: 206
- 5 to 9 minutes: 1,622
- 10 to 14 minutes: 2,526
- 15 to 19 minutes: 1,361
- 20 to 24 minutes: 1,080
- 25 to 29 minutes: 689
- 30 to 34 minutes: 836
- 35 to 39 minutes: 256
- 40 to 44 minutes: 171
- 45 to 59 minutes: 1,090
- 60 to 89 minutes: 1,217
- 90 or more minutes: 1,034
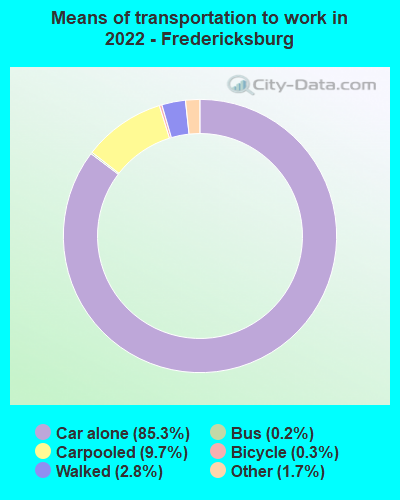
Means of transportation to work:
- Drove a car alone: 20,587 (76.0%)
- Carpooled: 2,367 (8.7%)
- Bus: 39 (0.1%)
- Long-distance train or commuter rail: 11 (0.0%)
- Taxi: 507 (1.9%)
- Bicycle: 67 (0.2%)
- Walked: 716 (2.6%)
- Worked at home: 2,264 (8.4%)

- Unemployment by race in 2022
- Unemployment rate for White non-Hispanic residents
- 1.8%Males
- 6.5%Females
- Unemployment rate for Black residents
- 6.7%Males
- 0.9%Females
- Unemployment rate for Asian residents
- 17.7%Males
- 1.8%Females
- Unemployment rate for other race residents
- 4.0%Males
- 1.0%Females
- Unemployment rate for two or more race residents
- 1.7%Males
- 3.6%Females
- Unemployment rate for Hispanic or Latino residents
- 2.5%Males
- 4.1%Females

- Year of entry for the foreign-born population in Fredericksburg, Virginia
- 2,0472010 or later
- 6562000 to 2009
- 3381990 to 1999
- 2611980 to 1989
- 871970 to 1979
- 159Before 1970

First ancestries reported:
- English: 1,425 (9.8%)
- American: 907 (6.2%)
- Afghan: 800 (5.5%)
- Irish: 731 (5.0%)
- European: 692 (4.8%)
- German: 575 (3.9%)
- Sierra Leonean: 210 (1.4%)
- Lebanese: 206 (1.4%)
- Scotch-Irish: 170 (1.2%)
- Italian: 161 (1.1%)
- Iranian: 155 (1.1%)
- Ugandan: 139 (1.0%)
- British: 129 (0.9%)
- African: 119 (0.8%)
- Norwegian: 112 (0.8%)
- Scottish: 86 (0.6%)
- Palestinian: 81 (0.6%)
- Welsh: 59 (0.4%)
- Polish: 53 (0.4%)
- French Canadian: 42 (0.3%)
- Greek: 41 (0.3%)
- Ghanaian: 30 (0.2%)
- Nigerian: 30 (0.2%)
- Swedish: 21 (0.1%)
- Egyptian: 19 (0.1%)
- Canadian: 16 (0.1%)
- Northern European: 16 (0.1%)
- Haitian: 15 (0.1%)
- Eastern European: 14 (0.10%)
- Hungarian: 13 (0.09%)
- French: 13 (0.09%)
- Lithuanian: 11 (0.08%)
- Ukrainian: 10 (0.07%)
- Danish: 10 (0.07%)
- Slovak: 7 (0.05%)
- Portuguese: 7 (0.05%)
- Swiss: 7 (0.05%)
- Slovene: 6 (0.04%)
- Finnish: 5 (0.03%)
- Russian: 5 (0.03%)
Most common places of birth for foreign-born residents (%):
| Fredericksburg: | 34.4% (1,114) |
| Virginia: | 1.8% (19,426) |
| Fredericksburg: | 9.7% (314) |
| Virginia: | 5.3% (57,498) |
| Fredericksburg: | 8.9% (289) |
| Virginia: | 9.9% (107,534) |
| Fredericksburg: | 8.0% (259) |
| Virginia: | 3.0% (32,892) |
| Fredericksburg: | 4.7% (151) |
| Virginia: | 1.3% (14,417) |
| Fredericksburg: | 3.9% (128) |
| Virginia: | 3.3% (35,938) |
| Fredericksburg: | 3.4% (110) |
| Virginia: | 0.9% (9,440) |
| Fredericksburg: | 3.2% (105) |
| Virginia: | 0.8% (8,513) |
| Fredericksburg: | 3.1% (100) |
| Virginia: | 0.6% (6,458) |
| Fredericksburg: | 2.9% (95) |
| Virginia: | 1.6% (17,346) |
| Fredericksburg: | 2.5% (80) |
| Virginia: | 1.7% (18,227) |
| Fredericksburg: | 2.3% (76) |
| Virginia: | 4.9% (52,857) |
| Fredericksburg: | 1.8% (57) |
| Virginia: | 0.1% (1,127) |
| Fredericksburg: | 1.8% (57) |
| Virginia: | 1.2% (12,984) |
| Fredericksburg: | 1.7% (55) |
| Virginia: | 3.9% (42,989) |
Place of birth for U.S.-born residents:
- This state: 14,154
- Other state: 10,370
- Northeast: 3,139
- Midwest: 1,264
- South: 4,866
- West: 1,097
72.8% of Fredericksburg residents lived in the same house 1 years ago.
Out of people who lived in different houses, 18.1% lived in this county.
Out of people who lived in different counties, 76.3% lived in Virginia.
| Fredericksburg: | 72.8% |
| State average: | 86.6% |
Education attainment for males 25 years and older:
- No schooling: 15
- Nursery to 4th grade: 40
- 5th and 6th grade: 135
- 7th and 8th grade: 77
- 9th grade: 87
- 10th grade: 35
- 11th grade: 92
- 12th grade, no diploma: 78
- High school graduate (or equivalency): 1,880
- Less than 1 year of college: 466
- Some college more than 1 year, no degree: 1,233
- Associate degree: 316
- Bachelor's degree: 1,859
- Master's degree: 1,264
- Professional school degree: 268
- Doctorate degree: 192

Education attainment for females 25 years and older:
- No schooling: 143
- Nursery to 4th grade: 56
- 5th and 6th grade: 45
- 7th and 8th grade: 88
- 9th grade: 109
- 10th grade: 33
- 11th grade: 80
- 12th grade, no diploma: 51
- High school graduate (or equivalency): 1,802
- Less than 1 year of college: 645
- Some college more than 1 year, no degree: 1,368
- Associate degree: 509
- Bachelor's degree: 2,482
- Master's degree: 1,289
- Professional school degree: 168
- Doctorate degree: 106


Housing units in structures:
- One, detached: 5,030
- One, attached: 1,311
- Two: 265
- 3 or 4: 349
- 5 to 9: 1,226
- 10 to 19: 2,493
- 20 to 49: 937
- 50 or more: 639
- Mobile homes: 56
- Boats, RVs, vans, etc.: 7
Housing units lacking complete kitchen facilities in 2022: 1.9%
House/condo owner moved in on average 7 years ago
Renter moved in on average 0 years ago

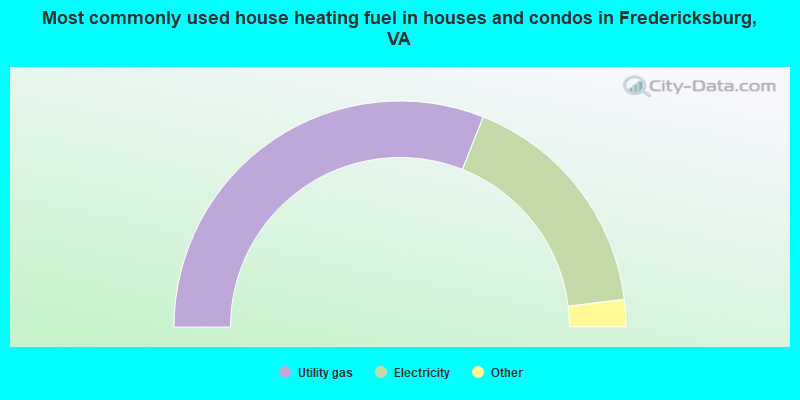
- 62.1%Utility gas
- 34.1%Electricity
- 1.4%Fuel oil, kerosene, etc.
- 0.8%Bottled, tank, or LP gas
- 0.7%No fuel used
- 0.6%Solar energy
- 0.3%Other fuel
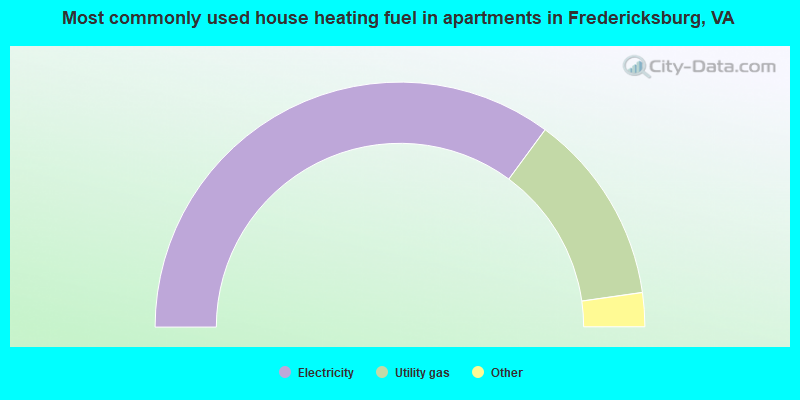
- 70.2%Electricity
- 25.3%Utility gas
- 1.5%Bottled, tank, or LP gas
- 1.5%No fuel used
- 1.3%Fuel oil, kerosene, etc.
- 0.2%Other fuel
Private vs. public school enrollment:
| Here: | 14.0% |
| Virginia: | 13.2% |
| Here: | 12.8% |
| Virginia: | 10.2% |
| Here: | 6.9% |
| Virginia: | 18.7% |


