Franklin, TN (Tennessee) Houses and Residents
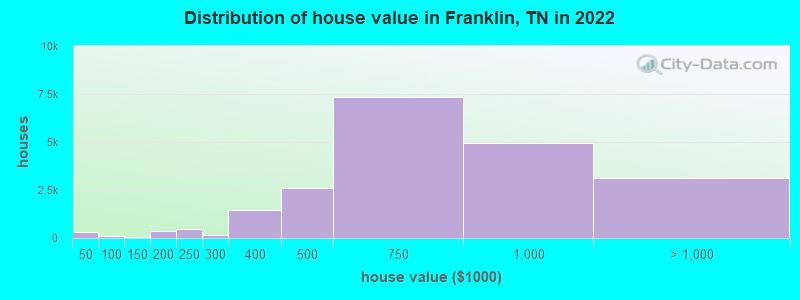
Estimated median house or condo value in 2022: $696,000 (it was $179,500 in 2000 )
Franklin:
$696,000Tennessee:
$284,800
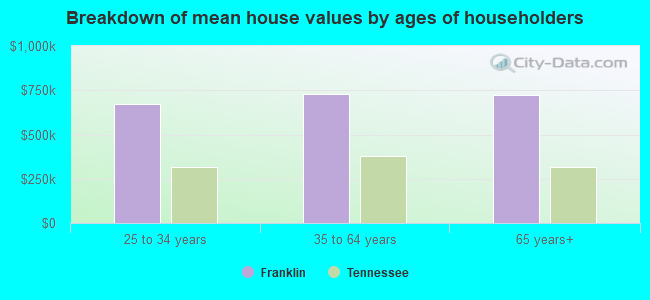
Lower value quartile - upper value quartile: $515,300 - $923,500Mean price in 2022: Detached houses: $721,098 Here:
$721,098State:
$374,382
Townhouses or other attached units: $515,563 Here:
$515,563State:
$354,101
In 2-unit structures: $510,354 Here:
$510,354State:
$247,693
In 3-to-4-unit structures: $456,341 Here:
$456,341State:
$239,060
In 5-or-more-unit structures: $413,898 Here:
$413,898State:
$317,434
Mobile homes: $180,921 Here:
$180,921State:
$101,421
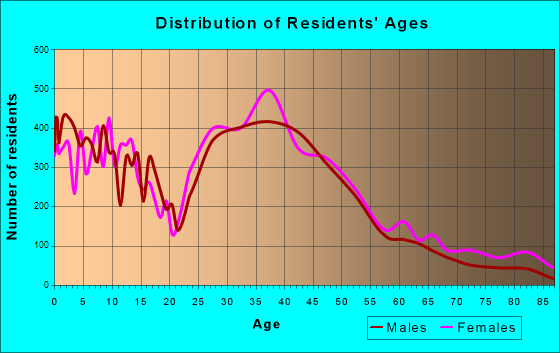
Total population: 70,612 (Urban population: 41,452, Rural population: 304 (all nonfarm) )
Houses: 35,295 (34,057 occupied: 21,523 owner occupied, 12,534 renter occupied )
% of renters here:
37%State:
33%
Housing density: 1,175 houses/condos per square mile
Median price asked for vacant for-sale houses and condos in 2022: $359,607.
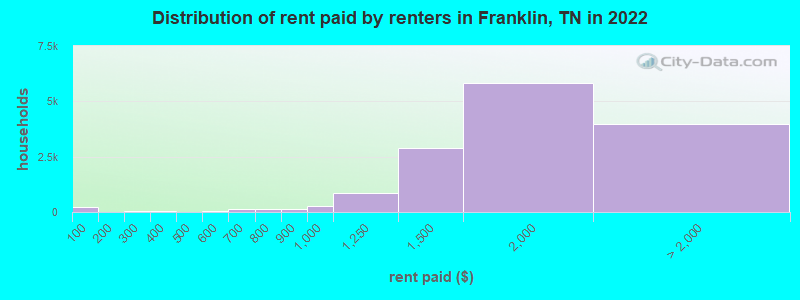
Median contract rent in 2022: $1,793 (lower quartile is $1,424, upper quartile is over $2,000)
Median rent asked for vacant for-rent units in 2022: $2,190
Median gross rent in Franklin, TN in 2022: $1,921
Housing units in Franklin with a mortgage: 13,347 (1,665 second mortgage, 0 home equity loan, 1,535 both second mortgage and home equity loan )Houses without a mortgage: 490
Median household income for houses/condos with a mortgage: $142,241
Median household income for apartments without a mortgage: $92,814
Median monthly housing costs: $1,846
Data:
Median house or condo value ($)
Median house or condo value ($ change since 2000)
Median house or condo value ($) - White
Median house or condo value ($) - Black or African American
Median house or condo value ($) - Asian
Median house or condo value ($) - Hispanic or Latino
Median house or condo value ($) - American Indian and Alaska Native
Median house or condo value ($) - Multirace
Median house or condo value ($) - Other Race
Median price asked for mobile homes ($)
Household density (households per square mile)
Mean house or condo value by units in structure - 1, detached ($)
Mean house or condo value by units in structure - 1, attached ($)
Mean house or condo value by units in structure - 2 ($)
Mean house or condo value by units in structure by units in structure - 3 or 4 ($)
Mean house or condo value by units in structure - 5 or more ($)
Mean house or condo value by units in structure - Boat, RV, van, etc. ($)
Mean house or condo value by units in structure - Mobile home ($)
Median contract rent ($)
Median contract rent - Lower quartile ($)
Median contract rent - Upper quartile ($)
Median gross rent ($)
Urban houses (%)
Rural houses (%)
Houses occupied (%)
Houses occupied (% change since 2000)
Houses owner occupied (%)
Houses owner occupied (% change since 2000)
Houses renter occupied (%)
Houses renter occupied (% change since 2000)
Vacant housing units - For rent (%)
Vacant housing units - For rent (% change since 2000)
Vacant housing units - For sale only (%)
Vacant housing units - For sale only (% change since 2000)
Vacant housing units - Rented or sold, not occupied (%)
Vacant housing units - Rented or sold, not occupied (% change since 2000)
Vacant housing units - For seasonal, recreational, or occasional use (%)
Vacant housing units - For seasonal, recreational, or occasional use (% change since 2000)
Vacant housing units - For migrant workers (%)
Vacant housing units - For migrant workers (% change since 2000)
Vacant housing units - Other vacant (%)
Vacant housing units - Other vacant (% change since 2000)
Median monthly housing costs ($)
Median household income for houses/condos with a mortgage ($)
Median household income for houses/condos without a mortgage ($)
Median household income ($)
Median household income ($) - White
Median household income ($) - Black or African American
Median household income ($) - Asian
Median household income ($) - Hispanic or Latino
Median household income ($) - American Indian and Alaska Native
Median household income ($) - Multirace
Median household income ($) - Other Race
Mortgage status - with mortgage (%)
Mortgage status - with second mortgage (%)
Mortgage status - with home equity loan (%)
Mortgage status - with both second mortgage and home equity loan (%)
Mortgage status - without a mortgage (%)
Median year house/condo built
Median year apartment built
Household type by relationship - Male householder living alone (%)
Household type by relationship - Male householder not living alone (%)
Household type by relationship - Female householder living alone (%)
Household type by relationship - Female householder not living alone (%)
Household type by relationship - Opposite-Sex spouse (%)
Household type by relationship - Same-Sex spouse (%)
Household type by relationship - Opposite-Sex unmarried partner (%)
Household type by relationship - Same-Sex unmarried partner (%)
Household type by relationship - In group quarters (%)
Size of family households - 2-person household (%)
Size of family households - 3-person household (%)
Size of family households - 4-person household (%)
Size of family households - 5-person household (%)
Size of family households - 6-person household (%)
Size of family households - 7-or-more-person household (%)
Size of nonfamily households - 1-person household (%)
Size of nonfamily households - 2-person household (%)
Size of nonfamily households - 3-person household (%)
Size of nonfamily households - 4-person household (%)
Size of nonfamily households - 5-person household (%)
Size of nonfamily households - 6-person household (%)
Size of nonfamily households - 7-or-moreperson household (%)
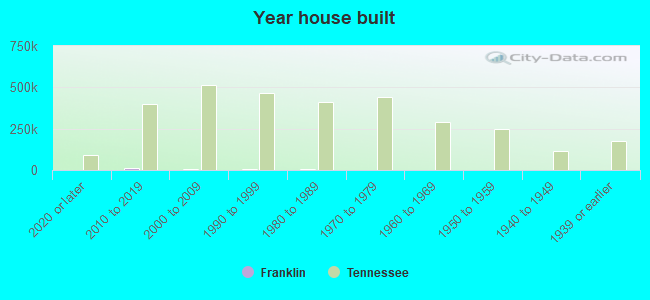
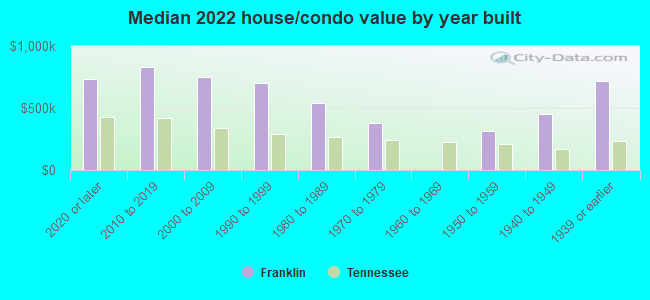
Year house built - Built 2010 or later (%)
Year house built - Built 2000 to 2009 (%)
Year house built - Built 1990 to 1999 (%)
Year house built - Built 1980 to 1989 (%)
Year house built - Built 1970 to 1979 (%)
Year house built - Built 1960 to 1969 (%)
Year house built - Built 1950 to 1959 (%)
Year house built - Built 1940 to 1949 (%)
Year house built - Built 1939 or earlier (%)
Median number of rooms in houses and condos
Median number of rooms in apartments
Median number of bedrooms in owner occupied houses
Mean number of bedrooms in owner occupied houses
Median number of bedrooms in renter occupied houses
Mean number of bedrooms in renter occupied houses
Median number of vehichles in owner occupied houses
Mean number of vehichles in owner occupied houses
Median number of vehichles in renter occupied houses
Mean number of vehichles in renter occupied houses
Rooms in owner-occupied houses - 1 room (%)
Rooms in owner-occupied houses - 2 rooms (%)
Rooms in owner-occupied houses - 3 rooms (%)
Rooms in owner-occupied houses - 4 rooms (%)
Rooms in owner-occupied houses - 5 rooms (%)
Rooms in owner-occupied houses - 6 rooms (%)
Rooms in owner-occupied houses - 7 rooms (%)
Rooms in owner-occupied houses - 8 rooms (%)
Rooms in owner-occupied houses - 9+ rooms (%)
Rooms in renter-occupied houses - 1 room (%)
Rooms in renter-occupied houses - 2 rooms (%)
Rooms in renter-occupied houses - 3 rooms (%)
Rooms in renter-occupied houses - 4 rooms (%)
Rooms in renter-occupied houses - 5 rooms (%)
Rooms in renter-occupied houses - 6 rooms (%)
Rooms in renter-occupied houses - 7 rooms (%)
Rooms in renter-occupied houses - 8 rooms (%)
Rooms in renter-occupied houses - 9+ rooms (%)
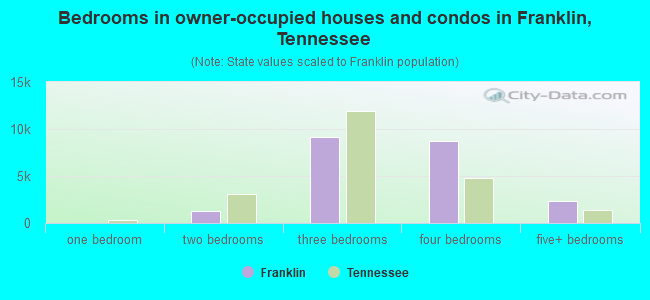
Bedrooms in owner-occupied houses - no bedrooms (%)
Bedrooms in owner-occupied houses - 1 bedroom (%)
Bedrooms in owner-occupied houses - 2 bedrooms (%)
Bedrooms in owner-occupied houses - 3 bedrooms (%)
Bedrooms in owner-occupied houses - 4 bedrooms (%)
Bedrooms in owner-occupied houses - 5+ bedrooms (%)
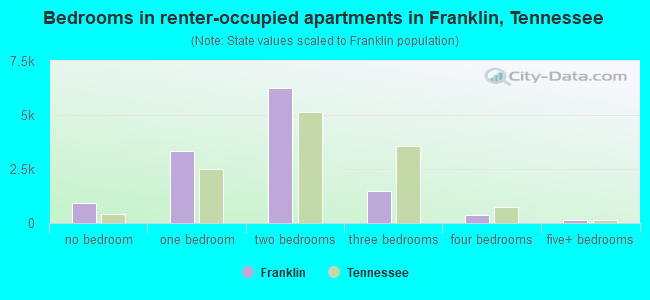
Bedrooms in renter-occupied houses - no bedrooms (%)
Bedrooms in renter-occupied houses - 1 bedroom (%)
Bedrooms in renter-occupied houses - 2 bedrooms (%)
Bedrooms in renter-occupied houses - 3 bedrooms (%)
Bedrooms in renter-occupied houses - 4 bedrooms (%)
Bedrooms in renter-occupied houses - 5+ bedrooms (%)
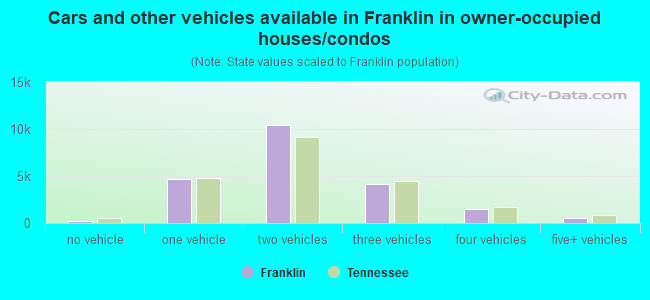
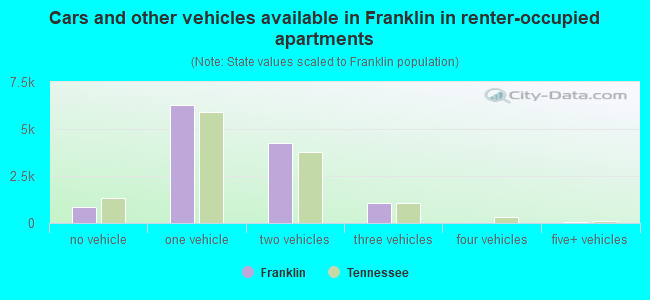
Vehicles available in owner-occupied houses - no vehicle available (%)
Vehicles available in owner-occupied houses - 1 vehicle available(%)
Vehicles available in owner-occupied houses - 2 Vehicles available (%)
Vehicles available in owner-occupied houses - 3 Vehicles available (%)
Vehicles available in owner-occupied houses - 4 Vehicles available (%)
Vehicles available in owner-occupied houses - 5+ Vehicles available (%)
Vehicles available in renter-occupied houses - no vehicle available (%)
Vehicles available in renter-occupied houses - 1 vehicle available (%)
Vehicles available in renter-occupied houses - 2 Vehicles available (%)
Vehicles available in renter-occupied houses - 3 Vehicles available (%)
Vehicles available in renter-occupied houses - 4 Vehicles available (%)
Vehicles available in renter-occupied houses - 5+ Vehicles available (%)
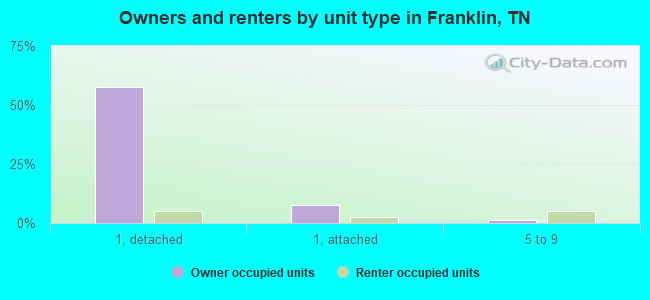
Housing units in structures - 1, detached (%)
Housing units in structures - 1, attached (%)
Housing units in structures - 2 (%)
Housing units in structures - 3 or 4 (%)
Housing units in structures - 5 to 9 (%)
Housing units in structures - 10 to 19 (%)
Housing units in structures - 20 to 49 (%)
Housing units in structures - 50 or more (%)
Housing units in structures - Mobile home (%)
Housing units in structures - Boat, RV, van, etc. (%)
Housing units in structures - Owners - 1, detached (%)
Housing units in structures - Owners - 1, attached (%)
Housing units in structures - Owners - 2 (%)
Housing units in structures - Owners - 3 or 4 (%)
Housing units in structures - Owners - 5 to 9 (%)
Housing units in structures - Owners - 10 to 19 (%)
Housing units in structures - Owners - 20 to 49 (%)
Housing units in structures - Owners - 50 or more (%)
Housing units in structures - Owners - Mobile home (%)
Housing units in structures - Owners - Boat, RV, van, etc. (%)
Housing units in structures - Renters - 1, detached (%)
Housing units in structures - Renters - 1, attached (%)
Housing units in structures - Renters - 2 (%)
Housing units in structures - Renters - 3 or 4 (%)
Housing units in structures - Renters - 5 to 9 (%)
Housing units in structures - Renters - 10 to 19 (%)
Housing units in structures - Renters - 20 to 49 (%)
Housing units in structures - Renters - 50 or more (%)
Housing units in structures - Renters - Mobile home (%)
Housing units in structures - Renters - Boat, RV, van, etc. (%)
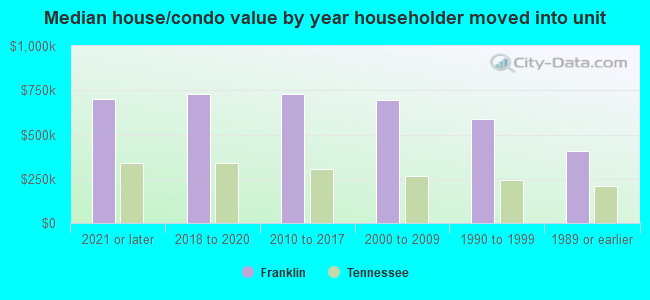
House/condo owner moved in on average (years ago)
Renter moved in on average (years ago)
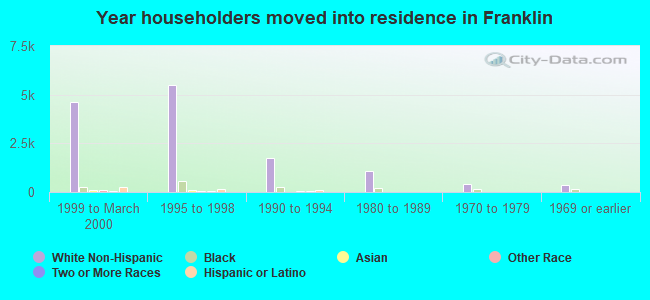
Year householder moved into unit - Moved in 1999 to March 2000 (%)
Year householder moved into unit - Moved in 1999 to March 2000 (%) - White
Year householder moved into unit - Moved in 1999 to March 2000 (%) - Black or African American
Year householder moved into unit - Moved in 1999 to March 2000 (%) - Asian
Year householder moved into unit - Moved in 1999 to March 2000 (%) - Hispanic or Latino
Year householder moved into unit - Moved in 1999 to March 2000 (%) - American Indian and Alaska Native
Year householder moved into unit - Moved in 1999 to March 2000 (%) - Multirace
Year householder moved into unit - Moved in 1999 to March 2000 (%) - Other Race
Year householder moved into unit - Moved in 1995 to 1998 (%)
Year householder moved into unit - Moved in 1995 to 1998 (%) - White
Year householder moved into unit - Moved in 1995 to 1998 (%) - Black or African American
Year householder moved into unit - Moved in 1995 to 1998 (%) - Asian
Year householder moved into unit - Moved in 1995 to 1998 (%) - Hispanic or Latino
Year householder moved into unit - Moved in 1995 to 1998 (%) - American Indian and Alaska Native
Year householder moved into unit - Moved in 1995 to 1998 (%) - Multirace
Year householder moved into unit - Moved in 1995 to 1998 (%) - Other Race
Year householder moved into unit - Moved in 1990 to 1994 (%)
Year householder moved into unit - Moved in 1990 to 1994 (%) - White
Year householder moved into unit - Moved in 1990 to 1994 (%) - Black or African American
Year householder moved into unit - Moved in 1990 to 1994 (%) - Asian
Year householder moved into unit - Moved in 1990 to 1994 (%) - Hispanic or Latino
Year householder moved into unit - Moved in 1990 to 1994 (%) - American Indian and Alaska Native
Year householder moved into unit - Moved in 1990 to 1994 (%) - Multirace
Year householder moved into unit - Moved in 1990 to 1994 (%) - Other Race
Year householder moved into unit - Moved in 1980 to 1989 (%)
Year householder moved into unit - Moved in 1980 to 1989 (%) - White
Year householder moved into unit - Moved in 1980 to 1989 (%) - Black or African American
Year householder moved into unit - Moved in 1980 to 1989 (%) - Asian
Year householder moved into unit - Moved in 1980 to 1989 (%) - Hispanic or Latino
Year householder moved into unit - Moved in 1980 to 1989 (%) - American Indian and Alaska Native
Year householder moved into unit - Moved in 1980 to 1989 (%) - Multirace
Year householder moved into unit - Moved in 1980 to 1989 (%) - Other Race
Year householder moved into unit - Moved in 1970 to 1979 (%)
Year householder moved into unit - Moved in 1970 to 1979 (%) - White
Year householder moved into unit - Moved in 1970 to 1979 (%) - Black or African American
Year householder moved into unit - Moved in 1970 to 1979 (%) - Asian
Year householder moved into unit - Moved in 1970 to 1979 (%) - Hispanic or Latino
Year householder moved into unit - Moved in 1970 to 1979 (%) - American Indian and Alaska Native
Year householder moved into unit - Moved in 1970 to 1979 (%) - Multirace
Year householder moved into unit - Moved in 1970 to 1979 (%) - Other Race
Year householder moved into unit - Moved in 1969 or earlier (%)
Year householder moved into unit - Moved in 1969 or earlier (%) - White
Year householder moved into unit - Moved in 1969 or earlier (%) - Black or African American
Year householder moved into unit - Moved in 1969 or earlier (%) - Asian
Year householder moved into unit - Moved in 1969 or earlier (%) - Hispanic or Latino
Year householder moved into unit - Moved in 1969 or earlier (%) - American Indian and Alaska Native
Year householder moved into unit - Moved in 1969 or earlier (%) - Multirace
Year householder moved into unit - Moved in 1969 or earlier (%) - Other Race
Housing units lacking complete plumbing facilities (%)
Housing units lacking complete kitchen facilities (%)
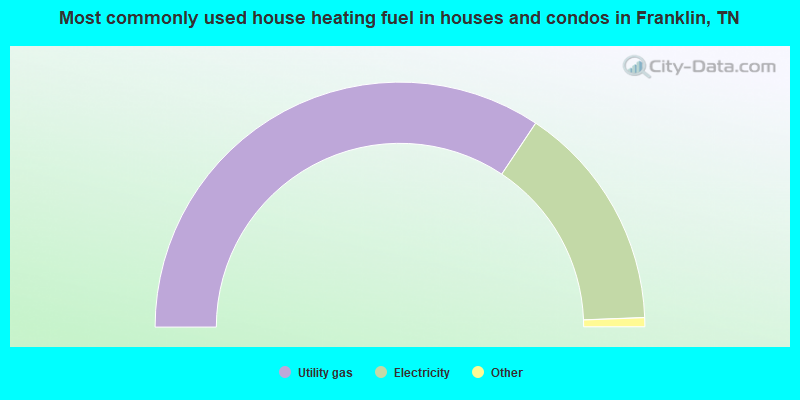
House heating fuel used in houses and condos - Utility gas (%)
House heating fuel used in houses and condos - Bottled, tank, or LP gas (%)
House heating fuel used in houses and condos - Electricity (%)
House heating fuel used in houses and condos - Fuel oil, kerosene, etc. (%)
House heating fuel used in houses and condos - Coal or coke (%)
House heating fuel used in houses and condos - Wood (%)
House heating fuel used in houses and condos - Solar energy (%)
House heating fuel used in houses and condos - Other fuel (%)
House heating fuel used in houses and condos - No fuel used (%)
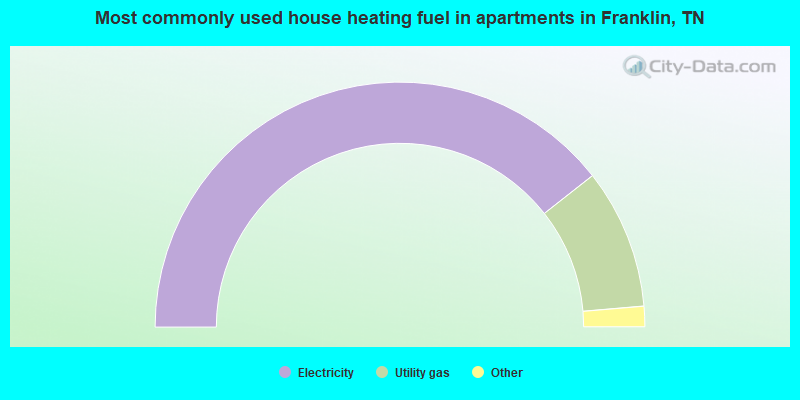
House heating fuel used in apartments - Utility gas (%)
House heating fuel used in apartments - Bottled, tank, or LP gas (%)
House heating fuel used in apartments - Electricity (%)
House heating fuel used in apartments - Fuel oil, kerosene, etc. (%)
House heating fuel used in apartments - Coal or coke (%)
House heating fuel used in apartments - Wood (%)
House heating fuel used in apartments - Solar energy (%)
House heating fuel used in apartments - Other fuel (%)
House heating fuel used in apartments - No fuel used (%)
Latest news about housing in Franklin, TN collected exclusively by city-data.com from local newspapers, TV, and radio stations
Median year house/condo built: 2001Median year apartment built: 1999Household type by relationship:
Households: 86,904
Male householders: 17,279 (3,336 living alone ), Female householders: 16,778 (5,695 living alone )20,150 spouses (19,698 opposite-sex spouses ), 1,562 unmarried partners , (1,431 opposite-sex unmarried partners ), 26,284 children (25,377 natural , 507 adopted , 400 stepchildren ), 2,490 grandchildren , 194 brothers or sisters , 268 parents , 0 foster children , 602 other relatives , 480 non-relatives In group quarters: 817
Size of family households: 10,626 2-persons , 5,392 3-persons , 5,603 4-persons , 1,723 5-persons , 449 6-persons , 181 7-or-more-persons .
Size of nonfamily households: 9,031 1-person , 971 2-persons , 81 4-persons .
16,443 married couples with children. single-parent households (891 men , 2,014 women ).
86.9% of residents of Franklin speak English at home. of residents speak Spanish at home (63% speak English very well , 23% speak English well , 13% speak English not well ).of residents speak other Indo-European language at home (85% speak English very well , 11% speak English well , 4% speak English not well ).of residents speak Asian or Pacific Island language at home (72% speak English very well , 18% speak English well , 10% speak English not well ).
Foreign born population: 7,990 (9.2%)of them are naturalized citizens )
Median number of rooms in houses and condos:
Median number of rooms in apartments
Owner-occupied Renter-occupied
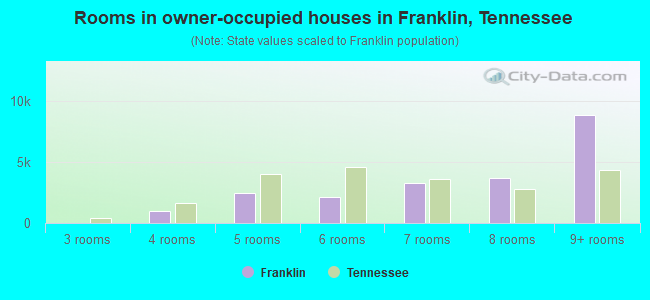
Rooms in owner-occupied houses in Franklin, Tennessee
0 1 room 0 2 rooms 0 3 rooms 1,006 4 rooms 2,491 5 rooms 2,151 6 rooms 3,299 7 rooms 3,718 8 rooms 8,858 9+ rooms
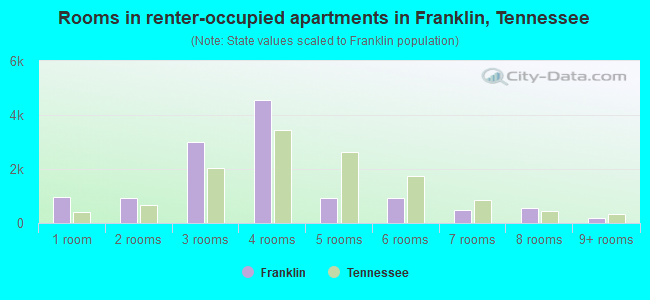
Rooms in renter-occupied apartments in Franklin, Tennessee
945 1 room 938 2 rooms 3,014 3 rooms 4,561 4 rooms 910 5 rooms 938 6 rooms 491 7 rooms 564 8 rooms 173 9+ rooms
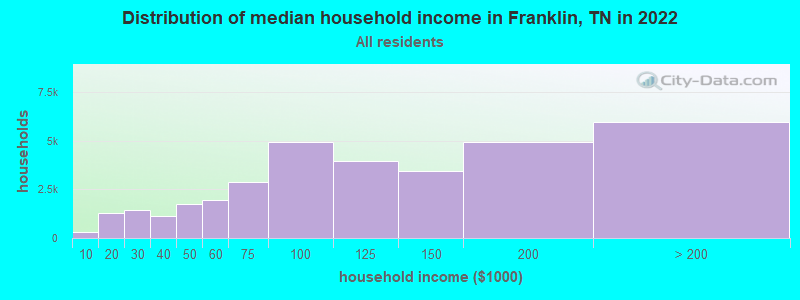
Franklin, TN household income distribution 329 Less than $10,0001,282 $10,000 to $19,9991,465 $20,000 to $29,9991,148 $30,000 to $39,9991,732 $40,000 to $49,9991,936 $50,000 to $59,9992,860 $60,000 to $74,9994,964 $75,000 to $99,9993,945 $100,000 to $124,9993,452 $125,000 to $149,9994,967 $150,000 to $199,9995,977 $200,000 or more
Home value of owner - occupied houses in 2022 in Franklin, TN 84 Less than $10,00017 $10,000 to $14,99990 $15,000 to $19,99910 $20,000 to $24,99950 $25,000 to $29,99919 $35,000 to $39,99918 $40,000 to $49,99927 $50,000 to $59,99924 $70,000 to $79,99910 $80,000 to $89,99934 $90,000 to $99,99921 $100,000 to $124,99949 $125,000 to $149,999115 $150,000 to $174,999255 $175,000 to $199,999458 $200,000 to $249,999171 $250,000 to $299,9991,481 $300,000 to $399,9992,603 $400,000 to $499,9997,338 $500,000 to $749,9994,924 $750,000 to $999,9991,924 $1,000,000 to $1,499,999597 $1,500,000 to $1,999,999582 $2,000,000 or moreRent paid by renters in 2022 in Franklin, TN 205 Less than $10010 $200 to $24925 $250 to $29922 $300 to $34915 $350 to $39914 $450 to $49924 $500 to $549114 $600 to $6499 $650 to $69975 $700 to $74981 $750 to $799114 $800 to $899262 $900 to $999839 $1,000 to $1,2492,899 $1,250 to $1,4995,845 $1,500 to $1,9992,129 $2,000 to $2,499729 $2,500 to $2,999185 $3,000 to $3,499665 $3,500 or more288 No cash rent
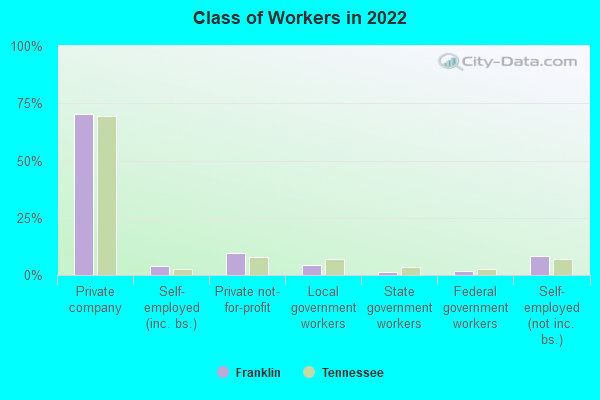
Percentage of workers working in this county: 74.5%Number of people working at home: 15,626 (33.6% of all workers )
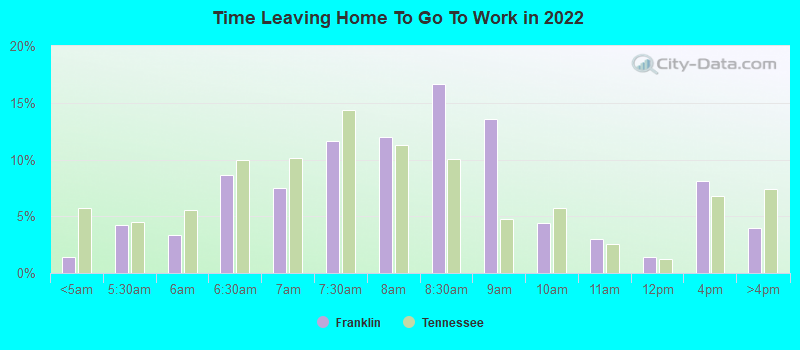
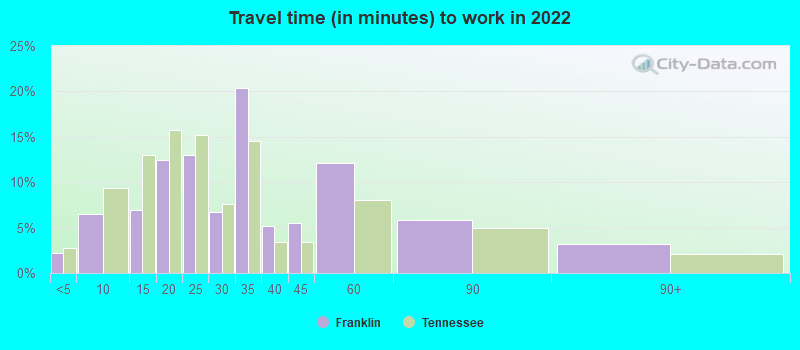
Travel time to work (commute)
Less than 5 minutes: 1,1985 to 9 minutes: 3,97310 to 14 minutes: 2,77215 to 19 minutes: 5,92920 to 24 minutes: 4,57425 to 29 minutes: 2,28830 to 34 minutes: 5,74535 to 39 minutes: 79440 to 44 minutes: 1,12245 to 59 minutes: 2,86860 to 89 minutes: 67190 or more minutes: 414
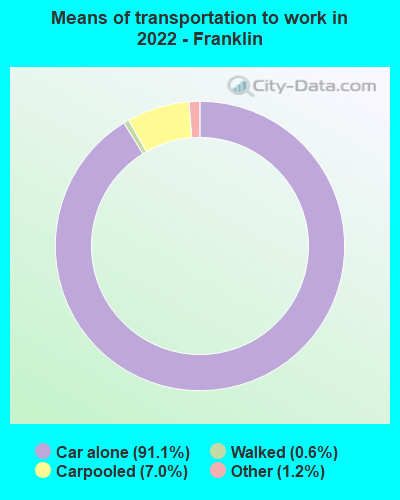
Means of transportation to work:
Drove a car alone: 57,038 (71.9%)Carpooled: 5,472 (6.9%)Bus : 60 (0.1%)Light rail, streetcar or trolley : 43 (0.1%)Taxi: 962 (1.2%)Bicycle: 19 (0.0%)Walked: 320 (0.4%)Worked at home: 13,975 (17.6%)
Unemployment by race in 2022
Unemployment rate for White non-Hispanic residents 2.2% Males2.7% FemalesUnemployment rate for Black residents 0.8% Males9.9% FemalesUnemployment rate for Asian residents 1.6% Males1.9% FemalesUnemployment rate for other race residents 7.9% MalesUnemployment rate for two or more race residents 1.8% Males1.0% FemalesUnemployment rate for Hispanic or Latino residents 0.7% Males4.4% Females
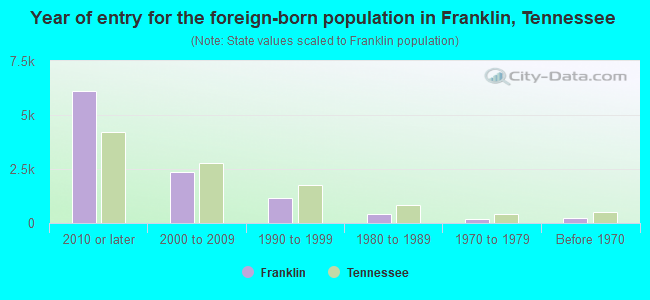
Year of entry for the foreign-born population in Franklin, Tennessee
6,125 2010 or later 2,343 2000 to 2009 1,154 1990 to 1999 420 1980 to 1989 190 1970 to 1979 246 Before 1970
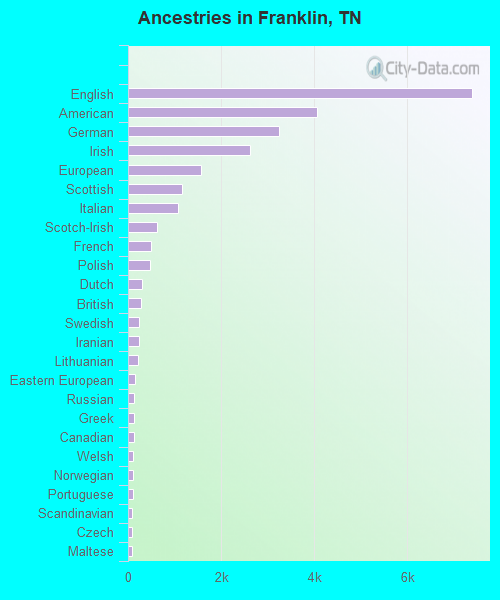
First ancestries reported:
English: 7,383 (17.9%)
American: 4,056 (9.8%)
German: 3,249 (7.9%)
Irish: 2,613 (6.3%)
European: 1,561 (3.8%)
Scottish: 1,167 (2.8%)
Italian: 1,078 (2.6%)
Scotch-Irish: 633 (1.5%)
French: 493 (1.2%)
Polish: 462 (1.1%)
Dutch: 296 (0.7%)
British: 272 (0.7%)
Swedish: 232 (0.6%)
Iranian: 232 (0.6%)
Lithuanian: 218 (0.5%)
Eastern European: 146 (0.4%)
Russian: 134 (0.3%)
Greek: 129 (0.3%)
Canadian: 128 (0.3%)
Welsh: 113 (0.3%)
Norwegian: 98 (0.2%)
Portuguese: 98 (0.2%)
Scandinavian: 93 (0.2%)
Czech: 91 (0.2%)
Maltese: 90 (0.2%)
Armenian: 89 (0.2%)
Turkish: 89 (0.2%)
Swiss: 82 (0.2%)
Ukrainian: 81 (0.2%)
French Canadian: 69 (0.2%)
Hungarian: 61 (0.1%)
Slovak: 56 (0.1%)
Danish: 54 (0.1%)
Romanian: 50 (0.1%)
African: 50 (0.1%)
British West Indian: 49 (0.1%)
South African: 43 (0.1%)
Albanian: 40 (0.10%)
Bulgarian: 35 (0.08%)
Yugoslavian: 29 (0.07%)
Northern European: 27 (0.07%)
Cajun: 23 (0.06%)
Austrian: 22 (0.05%)
Lebanese: 19 (0.05%)
Brazilian: 17 (0.04%)
Australian: 17 (0.04%)
Egyptian: 15 (0.04%)
Belgian: 15 (0.04%)
Czechoslovakian: 13 (0.03%)
Croatian: 12 (0.03%)
Haitian: 12 (0.03%)
Nigerian: 9 (0.02%)
Estonian: 8 (0.02%)
Serbian: 8 (0.02%)
Most common places of birth for foreign-born residents (%): India Franklin:
29.2% (2,974)Tennessee:
6.1% (23,079)
Mexico Franklin:
8.7% (885)Tennessee:
23.0% (86,435)
China, excluding Hong Kong and Taiwan Franklin:
7.7% (779)Tennessee:
3.3% (12,582)
Venezuela Franklin:
7.6% (773)Tennessee:
1.6% (5,936)
Korea Franklin:
5.1% (523)Tennessee:
2.3% (8,490)
Philippines Franklin:
5.1% (518)Tennessee:
3.1% (11,640)
Honduras Franklin:
4.6% (472)Tennessee:
4.6% (17,433)
Canada Franklin:
3.3% (335)Tennessee:
2.7% (10,295)
Iran Franklin:
2.2% (221)Tennessee:
0.8% (2,872)
Vietnam Franklin:
1.8% (187)Tennessee:
2.4% (8,894)
Brazil Franklin:
1.6% (166)Tennessee:
0.8% (3,098)
Japan Franklin:
1.6% (161)Tennessee:
0.9% (3,225)
Place of birth for U.S.-born residents:
This state: 29,577Other state: 47,766Northeast: 8,001Midwest: 15,932South: 17,653West: 6,180 83.1% of Franklin residents lived in the same house 1 years ago.
Out of people who lived in different houses, 23.9% lived in this county.
Out of people who lived in different counties, 45.3% lived in Tennessee.
Franklin:
83.1%State average:
87.0%
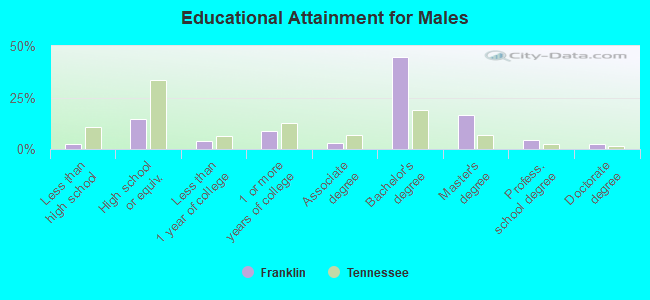
Education attainment for males 25 years and older:
No schooling: 226Nursery to 4th grade: 05th and 6th grade: 07th and 8th grade: 1509th grade: 8110th grade: 011th grade: 22312th grade, no diploma: 51High school graduate (or equivalency): 3,956Less than 1 year of college: 1,049Some college more than 1 year, no degree: 2,401Associate degree: 778Bachelor's degree: 12,275Master's degree: 4,537Professional school degree: 1,214Doctorate degree: 655
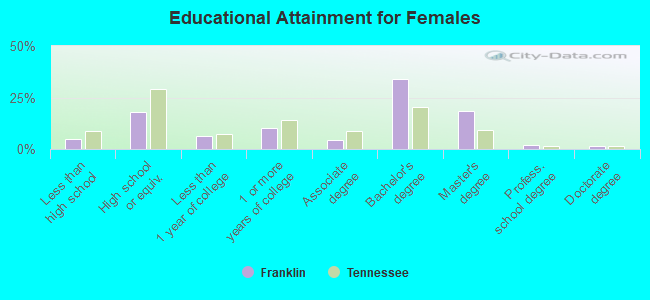
Education attainment for females 25 years and older:
No schooling: 728Nursery to 4th grade: 05th and 6th grade: 2397th and 8th grade: 1029th grade: 3510th grade: 4811th grade: 012th grade, no diploma: 321High school graduate (or equivalency): 5,682Less than 1 year of college: 2,067Some college more than 1 year, no degree: 3,280Associate degree: 1,411Bachelor's degree: 10,873Master's degree: 5,891Professional school degree: 674Doctorate degree: 494
Housing units in structures:
One, detached: 19,781One, attached: 3,715Two: 3233 or 4: 4485 to 9: 2,02210 to 19: 1,51920 to 49: 2,75950 or more: 4,436Mobile homes: 255Boats, RVs, vans, etc.: 37Housing units lacking complete plumbing facilities in 2022: 0.4%Housing units lacking complete kitchen facilities in 2022: 1.5%House/condo owner moved in on average 7 years ago
Renter moved in on average 0 years ago
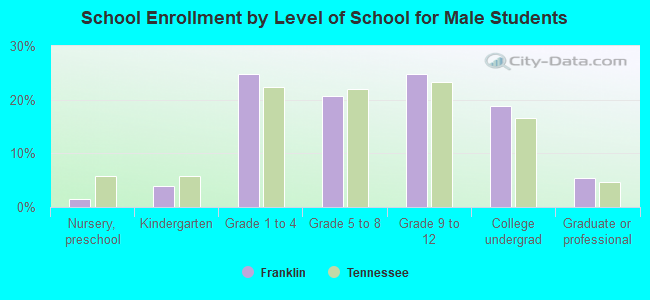
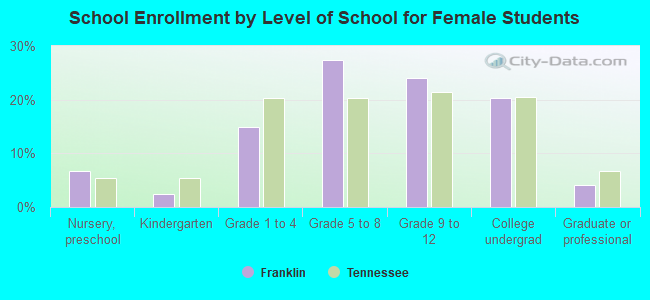
Private vs. public school enrollment:
Students in private schools in grades 1 to 8 (elementary and middle school): 1,199 Here:
11.4%Tennessee:
15.0%
Students in private schools in grades 9 to 12 (high school): 1,121 Here:
19.2%Tennessee:
16.2%
Students in private undergraduate colleges: 226